2282
Correlation of fetal MRI with neurodevelopmental outcome in fetuses with ventriculomegaly1Department of Radiology and Biomedical Imaging, University of California San Francisco, SAN FRANCISCO, CA, United States
Synopsis
Ventriculomegaly (VM) is the most common referred abnormality for fetal MRI and may be isolated or associated with additional abnormalities. We performed MR exams in 46 fetus diagnosed with isolated VM on ultrasound (US) and assessed neurodevelopmental outcome at 12 and 30 months with Bayley-III. Ventricle size (VS) measured by US and MRI and Bayley-III scores were analyzed using linear models. VS measured at older gestational age and longitudinal VS changes on MRI predicted outcome better than at younger age and on US. The presence of additional brain findings on fetal MRI significantly correlated with outcome and improved outcome predictability.
Synopsis
Ventriculomegaly (VM) is the most common referred abnormality for fetal MRI and may be isolated or associated with additional abnormalities. We performed MR exams in 46 fetus diagnosed with isolated VM on ultrasound (US) and assessed neurodevelopmental outcome at 12 and 30 months with Bayley-III. Ventricle size (VS) measured by US and MRI and Bayley-III scores were analyzed using linear models. VS measured at older gestational age and longitudinal VS changes on MRI predicted outcome better than at younger age and on US. The presence of additional brain findings on fetal MRI significantly correlated with outcome and improved outcome predictability.Purpose
Ventriculomegaly (VM) is the most common prenatally diagnosed brain abnormality with occurrence of approximately 1% in the total fetal population.1, 2 VM is traditionally diagnosed when ventricular atrial diameter exceeds 10mm with the classification of mild 10-11.9mm, moderate 12-15mm and severe >15mm. 3 Prognosis is better in fetuses with mild VM compared to those with severe VM. Currently, ultrasound (US) is the accepted method for prenatal screening; and evaluation of the ventricle size is an essential part of the exam. However, sonographic evaluation of the fetal brain for additional findings is limited by many factors, including technique and lower contrast resolution, resulting in historically very limited prenatal detection of parenchymal brain abnormalities.4 Fetal MRI is a well-established method used as a confirmation diagnostic tool of VM after suspected ultrasound findings. With relatively higher tissue resolution, MRI may demonstrate more additional findings in fetuses with VM that can alter patient counseling.4
This study was designed to determine the contribution of ventricle size and additional brain abnormalities on fetal MRI in predicting neurodevelopmental outcome.
Material and Methods
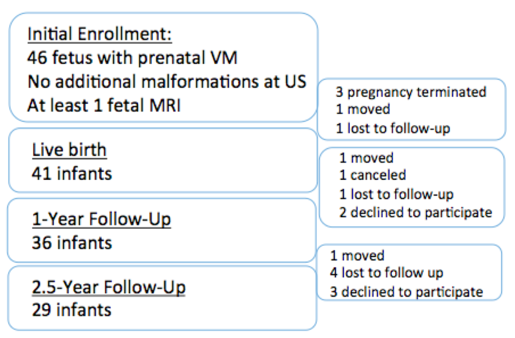
46 women with sonographic diagnosis of fetal isolated VM (VS<15mm) were enrolled in this study and underwent a fetal MRI scan. A second MRI (MR2) was performed approximately 5 weeks later in 37 cases. Follow-up assessment of neuromotor, cognitive, language and behavior development was performed at 12 and 30 months with Bayley-III (Fig 1). Ventricle size (VS) measured by US and MRI as well as follow-up Bayley-III scores were analyzed using linear models while correcting for potential covariates, including gestational age at MRI and sex. All the significances were corrected for multiple comparisons using Bonferroni adjustment: P<0.05 / 8 [no. of comparisons for all the 8 outcome scores] = 0.006.Results
Fetal MRI1 was performed at a mean GA of 25.03 wks. MRI2 was performed at mean GA of 29.97 wks. Ventricle size ranged from 5.1 to 27mm. On fetal MRI, 35 fetuses had confirmation of sonographically suspected isolated VM; while 11 fetuses had additional brain findings. Additional findings included: germinal matrix hemorrhage (4), schizencephaly (1), parenchymal and intraventricular hemorrhage (1), focal periventricular white matter injury (2), abnormal sulcation (1), callosal agenesis (1), Choroid plexus cysts (1).
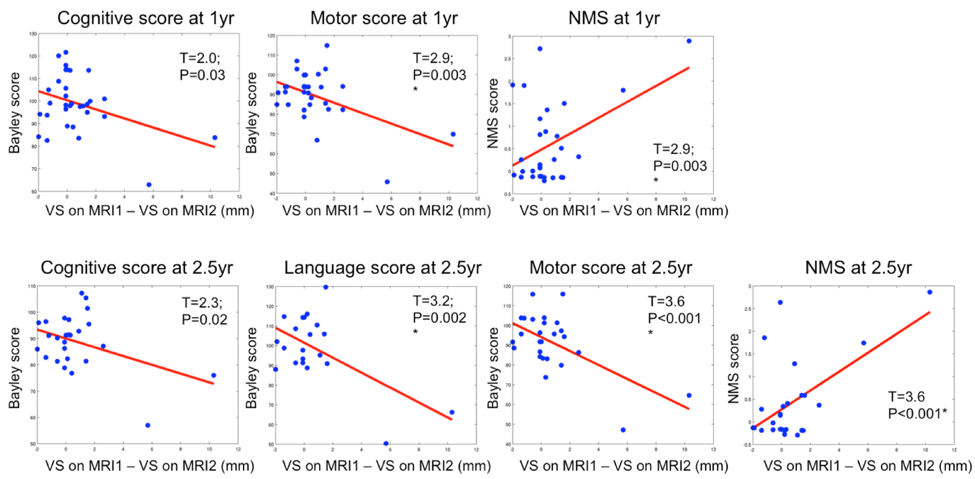
Compared to MRI1, 25 cases showed smaller VS while 9 showed increasing VS on MR2. VS change between MR1 and MR2 predicted neurodevelopmental outcome and correlated with Bayley motor scores and NMS at 1 year and all outcomes at 2.5 years (Fig. 2).
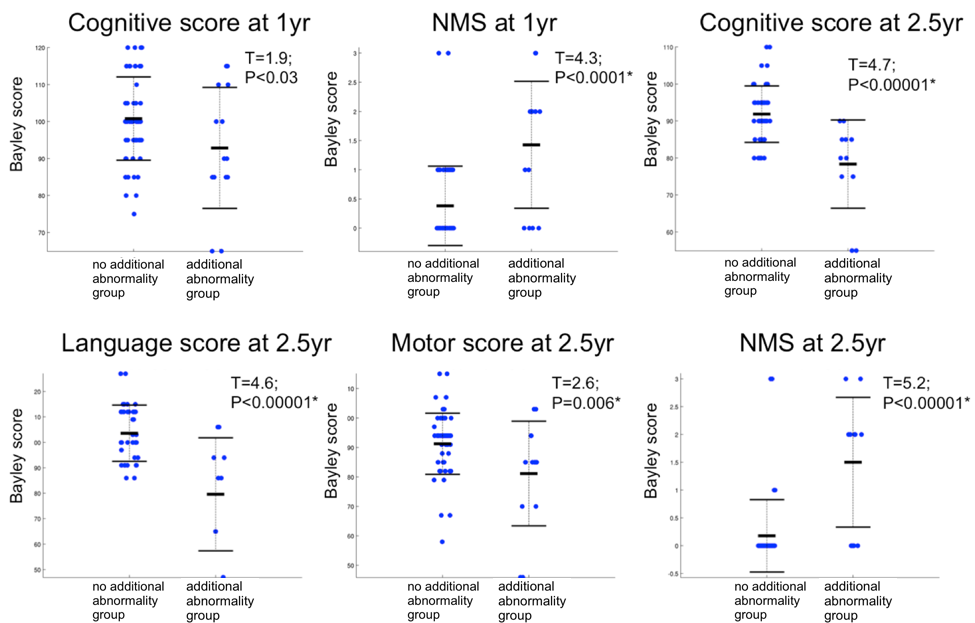
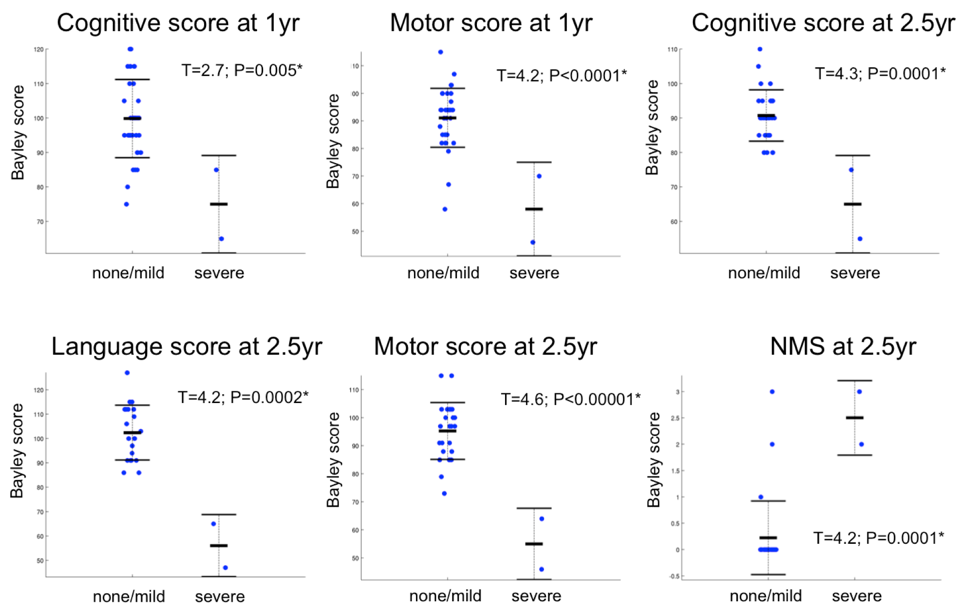
There was significantly worse outcome in fetuses with additional abnormalities on fetal MRI compared to those with isolated VM (Fig. 3). Grouping our data into “none/mild additional abnormalities” or “severe additional abnormalities” group (Fig 4), we observed significantly worse outcome occurring in “severe” group compared to “none/mild” group.
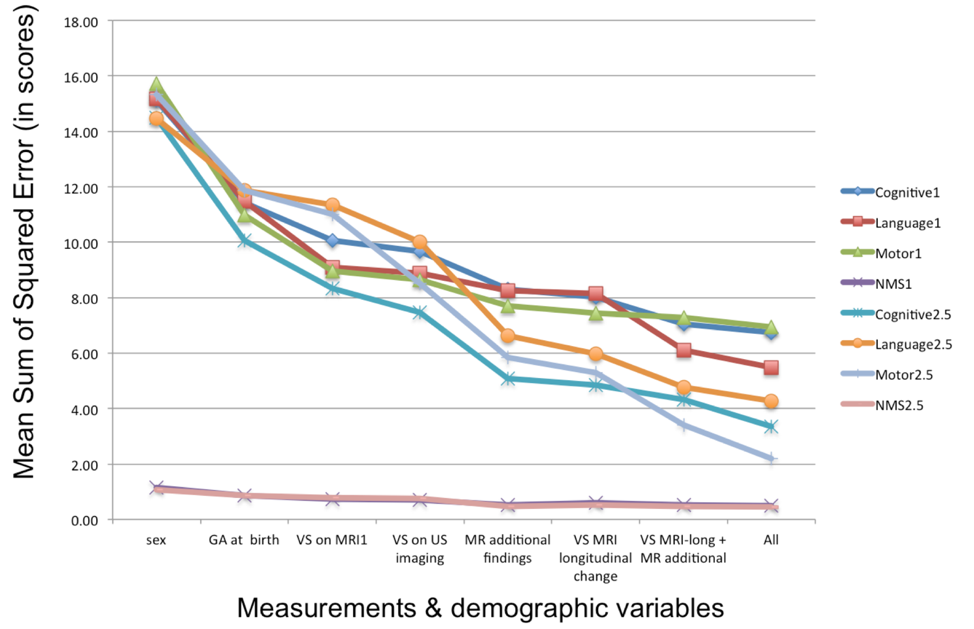
Computation of the mean sum of squared error (Fig. 5) showed that the mean error of prediction in all the outcomes was decreased in the following order: sex, age at birth, VS on MRI1, VS on US, MRI additional findings, longitudinal VS changes between MRI1 and MRI2, multivariate MRI parameters and multivariate demographic and MRI parameters.
Acknowledgements
NIH R01EB009756References
1. Bromley B, Frigoletto F, Benacerraf B, et al. Mild fetal lateral cerebral ventri- culomegaly: clinical course and outcome. Am J Obstet Gynecol 1991;164:863–7.
2. Goldstein R, LaPidus A, Filly R, Cardoza J. Mild lateral cerebral ventric- ular dilatation in utero: clinical significance and prognosis. Radiology 1990;176:237–42.
3. Melchiorre K, Bhide A, Gika AD, et al. Counseling in isolated mild fetal ventriculomegaly.Ultrasound Obstet Gynecol. 2009 Aug;34(2):212-24
4. Reddy U, Filly R, Copel J, et al. Prenatal Imaging: Ultrasonography and Magnetic Resonance Imaging. Obstet Gynecol. 2008 Jul; 112(1): 145–157.
Figures