2278
Reorganisation of cerebellar and dentate nucleus activity in multiple sclerosis subjects performing a complex visuomotor task: An event-related fMRI study1UCL Institute of Neurology, Queen Square MS Centre, University College London, London, United Kingdom, 2Department of Diagnostic Radiology, Faculty of Applied Medical Science, KAU, Jeddah, Saudi Arabia, 3Department of Neurosciences, Rehabilitation, Ophthalmology, Genetics and Maternal and Child Health, University of Genoa, Genoa, Italy, 4Department of Brain and Behavioural Sciences, University of Pavia, Pavia, Italy, 5Brain Connectivity Centre, C. Mondino National Neurological Institute, Pavia, Italy, 6Wellcome Centre for Imaging Neuroscience, University College London, London, United Kingdom, 7Brain MRI 3T Mondino Research Center, C. Mondino National Neurological Institute, Pavia, Italy
Synopsis
This study investigates the response to different grip force levels in the cerebellum and its dentate nucleus in MS. We found that cerebellar responses were functionally parcellated; with linear effects in the anterior cerebellum and complex nonlinear responses in the posterior cerebellum. This behaviour is consistent with healthy subjects (nonlinear responses in bilateral lobules V-VI and ipsilateral VIII), although MS subjects additionally show a strong linear response in lobule I-IV and nonlinear responses primarily localised in lobules V-VI. In the dentate nucleus, the motor portion in MS was silent as compared to the healthy subjects.
Purpose
To investigate the neurometric relationship between grip force (GF) and blood-oxygen-level-dependent (BOLD) signal responses in the cerebellum of multiple sclerosis (MS) patients.Introduction
The human cerebellum is implicated in motor as well as cognitive and higher-level functions1,2. Recent work has established a complex relationship between BOLD signal and applied GF in the cortex and in the cerebellum of healthy volunteers (HV) during a complex motor task3,4. How these signals are altered in pathology is unknown. Here we aimed to characterise linear and nonlinear responses in MS to a range of applied GFs, focusing on the cerebellum and its dentate nucleus (DN).Methods
Subjects: 16 right-handed (RH) HV (12 females; mean age 32 (±4.75) years) and 16 RH relapsing-remitting MS (RRMS) patients (11 females; mean age 36 (±5.21) years; median expanded disability status (EDSS) 4, range (1.5-6.5)).
MRI protocol: 3.0 T MRI (Philips Achieva, Philips-Healthcare, Best, The Netherlands) with a 32-channel head coil. Imaging protocol: 1) BOLD sensitive T2*-weighted EPI: TE/TR=35/2500ms, voxel size =3×3×2.7mm3, inter-slice gap=0.3mm, SENSE =2, 46 slices acquired with descending order, FOV=192×192mm2, 200 volumes, flip angle=90°; 2) 3D anatomical T1-weighted 1x1x1mm3 reference scan.
FMRI paradigm: A dynamic event-related power grip paradigm with the right (dominant) hand was designed using an MR-compatible squeeze ball. 75 active trials (3s each) were divided equally into 5 GF targets (20, 30, 40, 50, and 60 % of the subject’s maximum voluntary contraction), randomised with 75 rests. Visual cue was used for instructions.
Image pre-processing and statistical analyses: Pre-processing steps used the spatially unbiased infratentorial template (SUIT) software5 for cerebellum and its DN implemented within SPM126. Pre-processing included slice timing, realignment, and co-registration to T1-weighted volumes. The within-subject first level analysis model included five regressors of interest comprising polynomial functions of GF (up to the 4th order). The 0th order term represents the main effect of grip compared to rest, over force levels. The 1st order models BOLD linear effects; higher-orders model complex nonlinear relationships (e.g. U-shaped captured by +2nd order or more complicated neurometric functions that can be approximated by 3rd and 4th polynomial orders). At this level, t-statistics were used to test for the effects of each polynomial coefficient. Then, the SUIT normalization to the cerebellum template was performed. The normalized cerebellum functional contrast images (of each polynomial order) from each subject were smoothed (kernel =8mm). A (between-subjects) second level random effects analysis was applied to test for increasingly higher-order nonlinear effects with one or two sample t-tests for within- and between-group effects, respectively. Significance was corrected (FWE) at the cluster level (P<0.05). The resulting SPMs were visualized on the flattened cerebellum template7 using Caret8. Data was subsequently normalised using a lower smoothing kernel (4mm) together with the SUIT DN template9 to investigate the effect in the DN. Correlations with the EDSS were explored.
Results
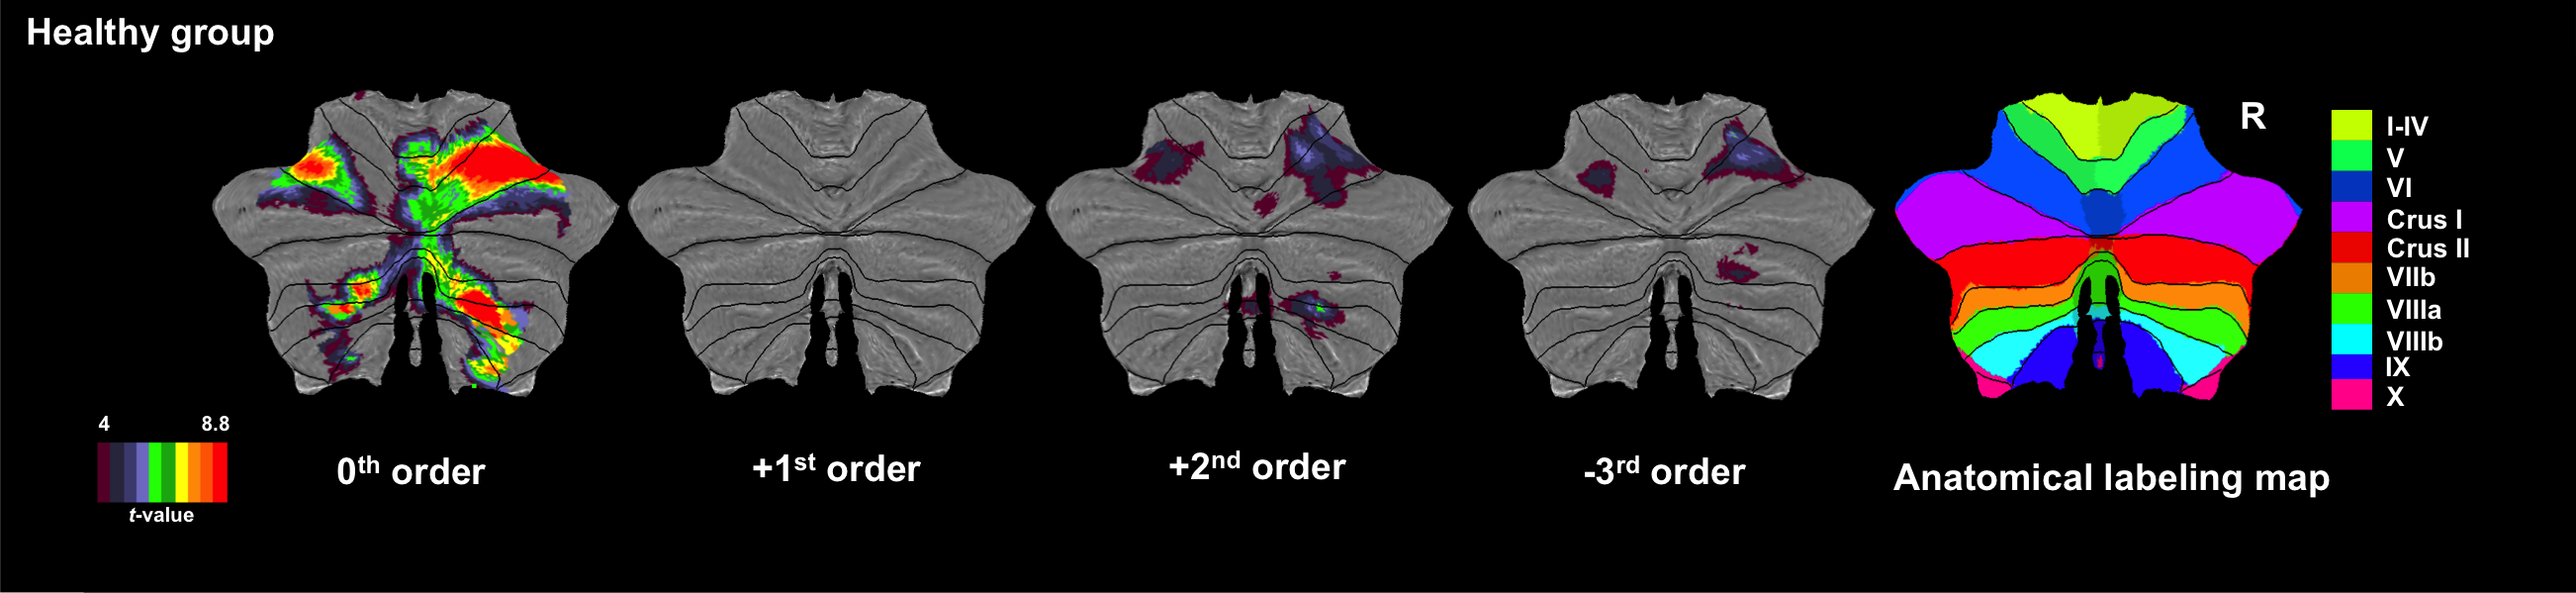
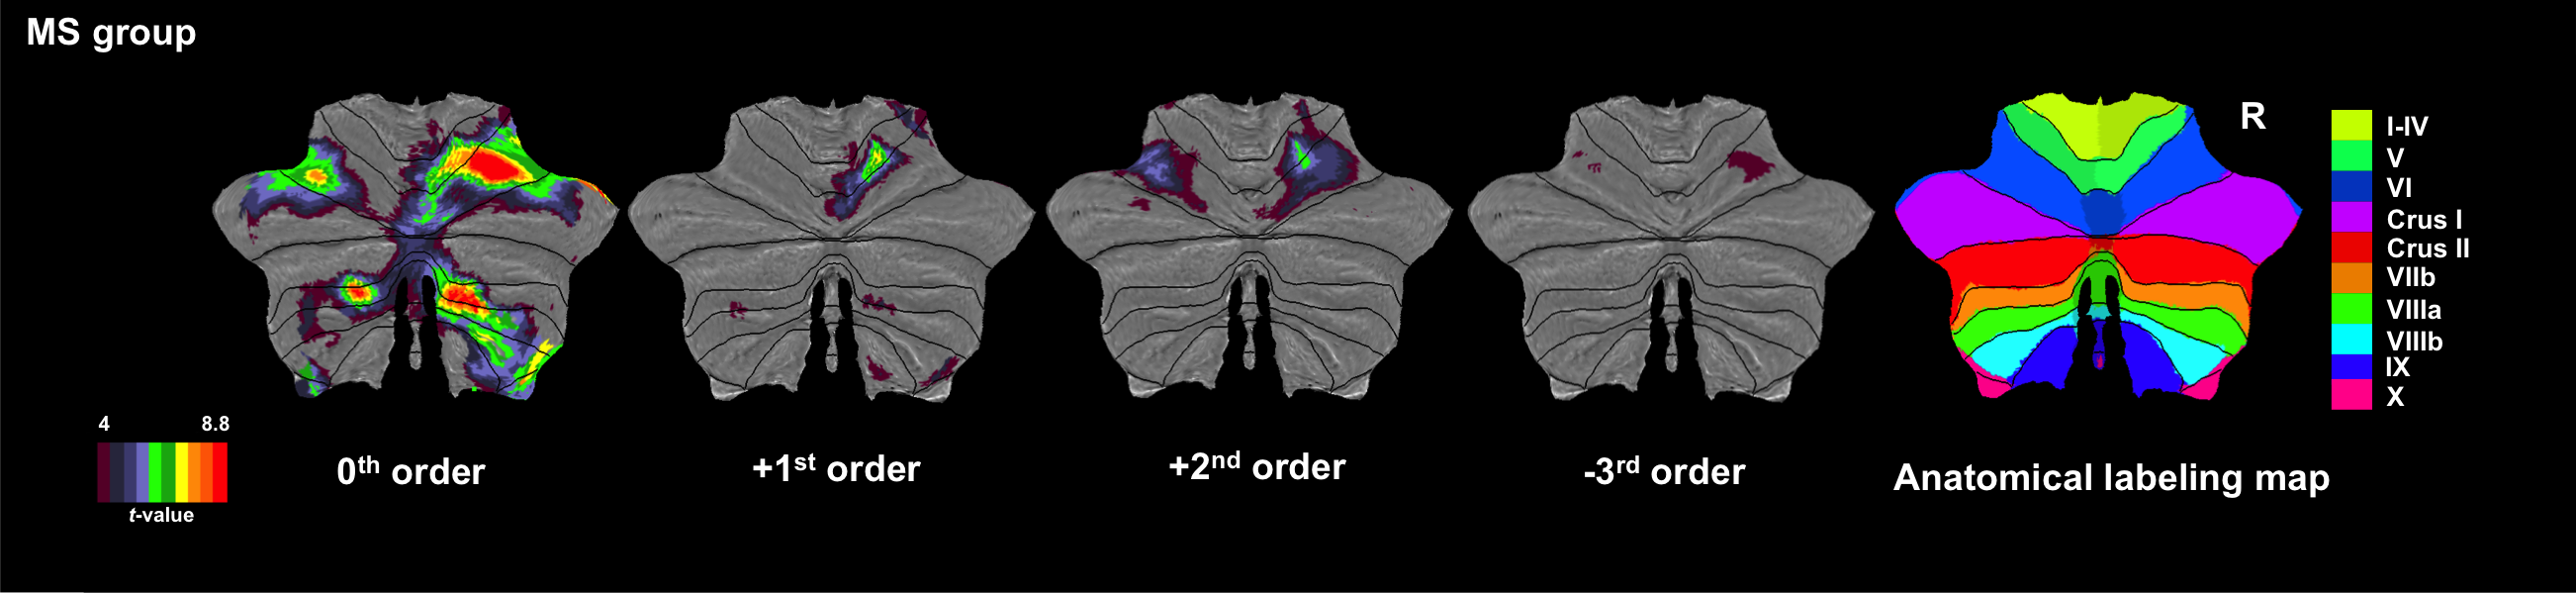
Figures 1 and 2 show activations projected onto the flattened cerebellum for HV and MS. In both groups, a main effect (i.e. irrespective of GF (0th order)) was detected in the anterior and posterior cerebellum. Positive 1st order effects were seen only in MS within the anterior cerebellum and lobule VI (medially). Areas following a positive 2nd order term (U-shaped profile) were seen in both groups in the superior cerebellum (lobules V-VI bilaterally). Negative 3rd order effects were observed in lobule VI bilaterally in both groups (although with a smaller effect size in MS) and in lobule VII in HV only.
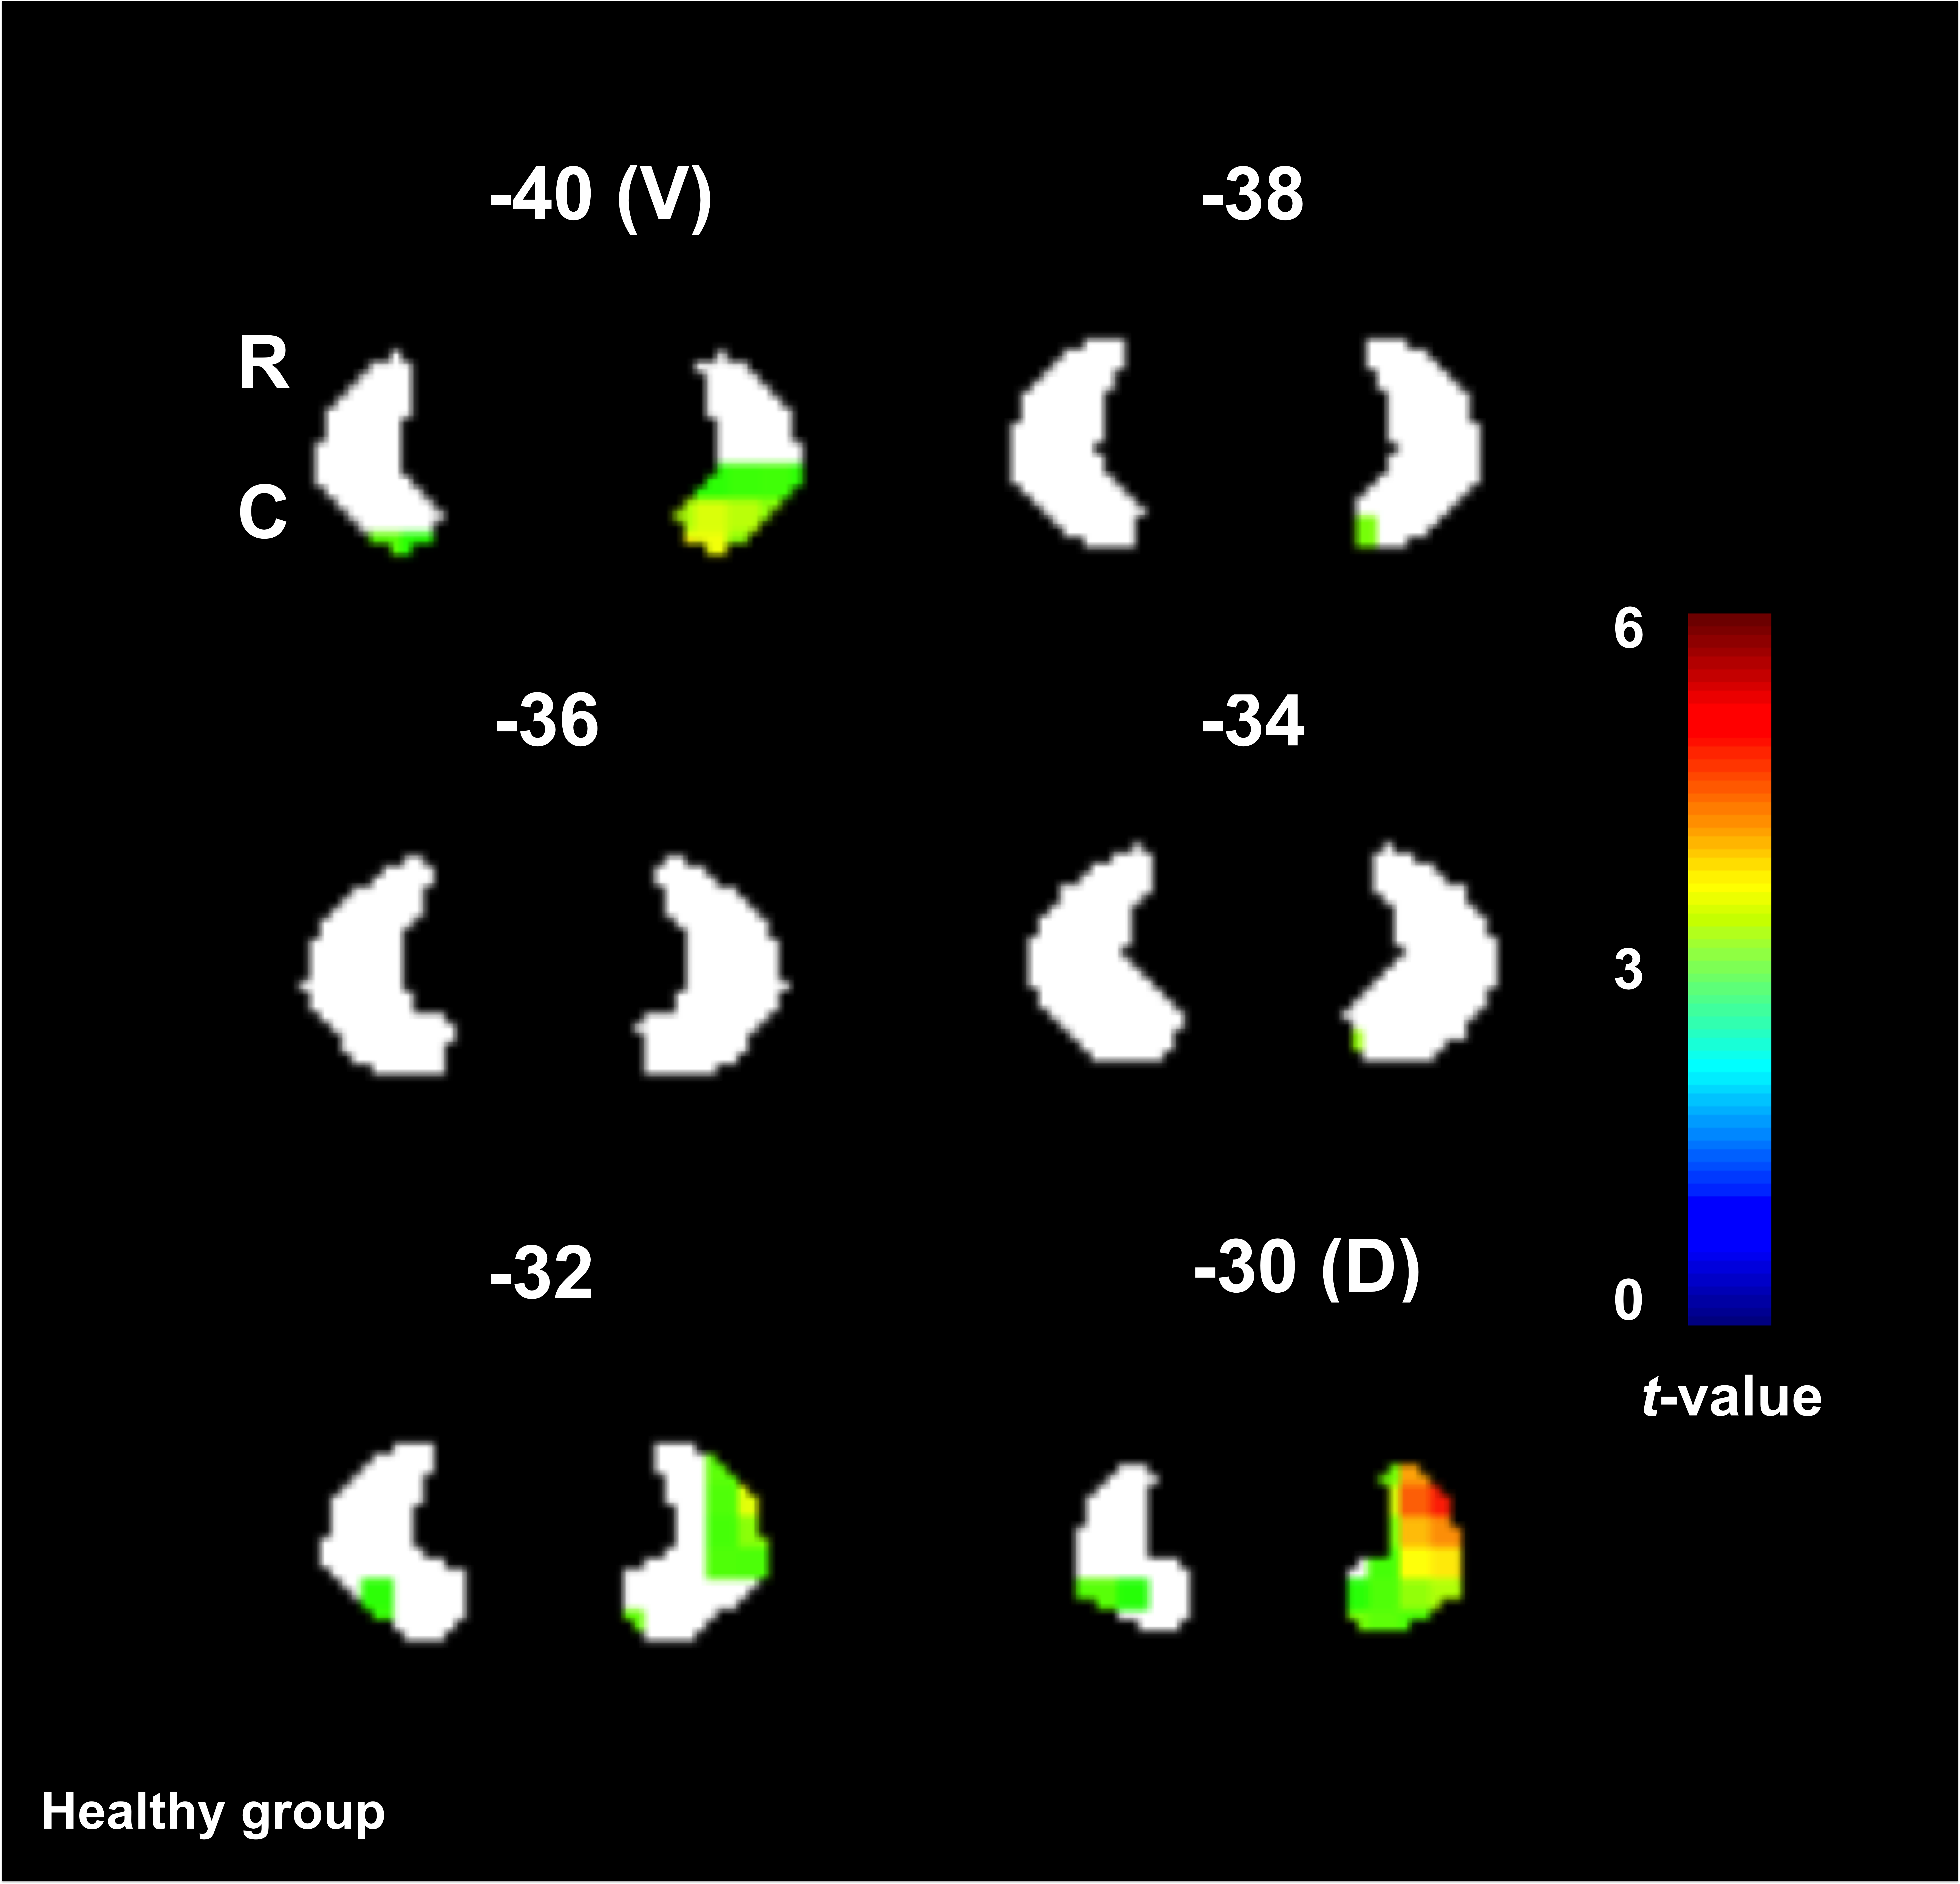
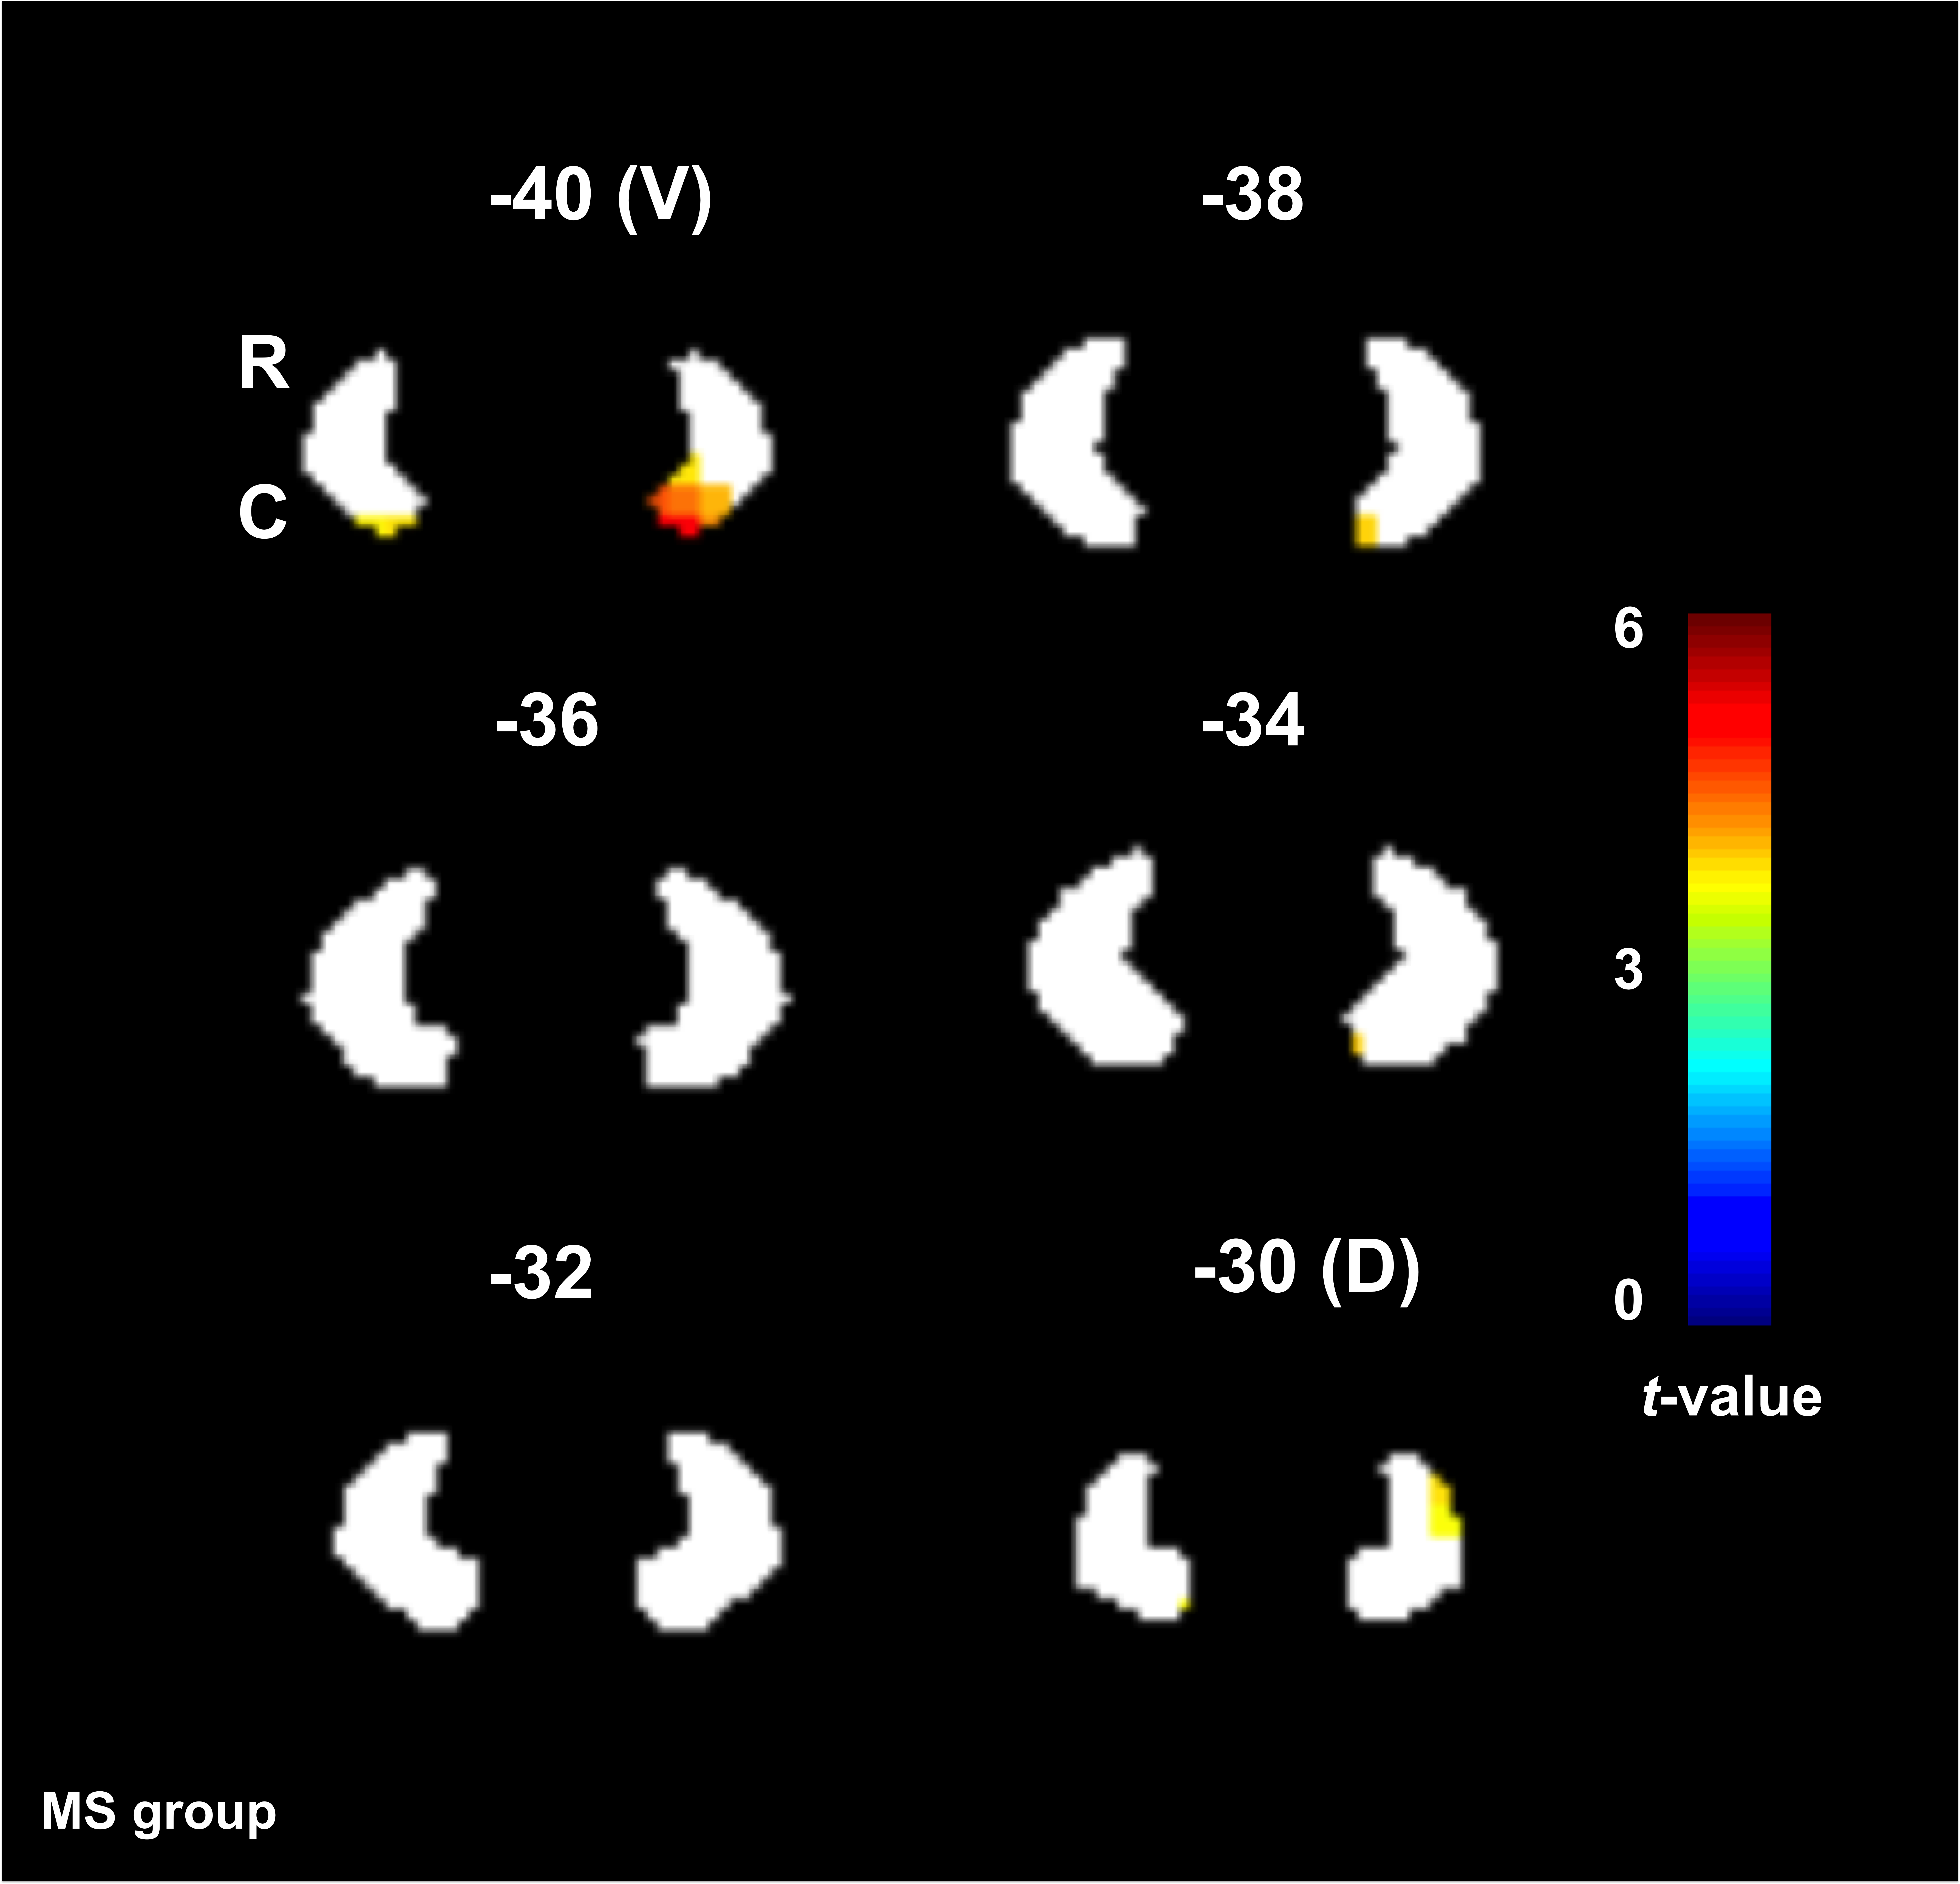
The ventral part of the DN was activated (0th order only) in both groups, whereas the dorsal part was primarily activated in HV. Figures 3 and 4 show the main effect of gripping in the DN.
In the 0th, +1st and +2nd orders, the BOLD effects were negatively correlated with the EDSS in most of the anterior cerebellar lobules.
Conclusion
In this study, we investigated the effects of MS pathology on cerebellar (and DN) responses to a complex visuomotor task. Comparing the main effect of gripping in MS and HV, we showed increased recruitment of the anterior cerebellum and lobule VI, which could be, at first glance, related to compensation mechanisms linearly depending on applied force. However, the negative correlations with EDSS suggests a possible unsuccessful compensatory mechanism or maladaptation. +2nd and -3rd order effects were observed in MS but with lesser extent and lower effect size than HV, possibly indicating a loss of efficiency. Interestingly, the dorsal part of DN, which is more involved in motor functions10,11, was silent in MS compared to HV. These findings suggest a complex cerebellar reorganization of the functional anatomy of visuomotor integration.Acknowledgements
MS society of the UK; National Institute for Health Research, University College London; AA was supported by KAU (Saudi Arabia), UKSACB and MOHE. MP was supported by the AKWO association, Lavagna (Italy). KJF was supported by the Wellcome trust.References
1. Spraker MB, Corcos DM, Kurani AS, Prodoehl J, Swinnen SP, Vaillancourt DE. Specific cerebellar regions are related to force amplitude and rate of force development. Neuroimage 2012;59(2):1647-56.
2. Stoodley CJ, Schmahmann JD. Functional topography in the human cerebellum: a meta-analysis of neuroimaging studies. Neuroimage 2009;44(2):489-501.
3. Alahmadi AA, Samson RS, Gasston D, Pardini M, Friston KJ, D'Angelo E, Toosy AT, Wheeler-Kingshott CA. Complex motor task associated with non-linear BOLD responses in cerebro-cortical areas and cerebellum. Brain Struct Funct 2016;221(5):2443-58.
4. Keisker B, Hepp-Reymond MC, Blickenstorfer A, Meyer M, Kollias SS. Differential force scaling of fine-graded power grip force in the sensorimotor network. Hum Brain Mapp 2009;30(8):2453-65.
5. Diedrichsen J. A spatially unbiased atlas template of the human cerebellum. NeuroImage 2006;33(1):127-38.
6. (http://www.fil.ion.ucl.ac.uk/spm).
7. Diedrichsen J, Zotow E. Surface-Based Display of Volume-Averaged Cerebellar Imaging Data. PloS one 2015;10(7):e0133402.
8. (http://brainmap.wustl.edu/caret).
9. Diedrichsen J, Maderwald S, Küper M, Thürling M, Rabe K, Gizewski ER, Ladd ME, Timmann D. Imaging the deep cerebellar nuclei: a probabilistic atlas and normalization procedure. Neuroimage 2011;54(3):1786-94.
10. Dum RP, Strick PL. An unfolded map of the cerebellar dentate nucleus and its projections to the cerebral cortex. Journal of neurophysiology 2003;89(1):634-639.
11. Küper M, Dimitrova a, Thürling M, Maderwald S, Roths J, Elles HG, Gizewski ER, Ladd ME, Diedrichsen J, Timmann D. Evidence for a motor and a non-motor domain in the human dentate nucleus--an fMRI study. NeuroImage 2011;54(4):2612-22.
Figures