2274
Diffusion fMRI of mouse optic nerve with antidromic electrical stimulation1Radiology, Washington University School of Medicine, St. Louis, MO, United States, 2The Hope Center for Neurological Disorders, Washington University School of Medicine, St. Louis, MO, United States, 3Biostatistics, Washington University School of Medicine, St. Louis, MO, United States, 4Neurology, The University of North Carolina in Chapel Hill, NC, United States, 5Neurology, Washington University School of Medicine, St. Louis, MO, United States, 6Biomedical Engineering, Washington University in St. Louis, St. Louis, MO, United States
Synopsis
Previously, we have successfully employed diffusion fMRI (dfMRI) to assess impaired axonal function in experimental autoimmune encephalomyelitis (EAE) mice undergoing visual stimulation. However, the prior dfMRI experiments cannot resolve contributions from retinal dysfunction to the decreased dfMRI changes observed in EAE mice. To address this shortcoming, we implanted an MR-compatible tungsten electrode at lateral geniculate nucleus (LGN) to perform antidromic stimulation of optic nerves. We demonstrated perpendicular apparent diffusion coefficient decreased with antidromic electrical stimulation at LGN bypassing visual input through retina.
Introduction
Previously, we employed diffusion fMRI (dfMRI) to assess axonal activation in normal mouse optic nerves (ON) and observed a 27% decrease with visual stimulation in the perpendicular apparent diffusion coefficient (ADC⊥) vs. baseline.1 We subsequently applied dfMRI to measure ON function in experimental autoimmune encephalomyelitis (EAE) mice observing reduced activation-associated ΔADC⊥, suggesting potential axonal dysfunction in EAE mice that is consistent with optic neuritis.2 However, the previous diffusion fMRI experiments cannot resolve potentially confounding contributions of retinal dysfunction in EAE mice.3 To address whether the visual-stimulus-induced ΔADC⊥ response represents axonal function without confounding retinal dysfunction, we propose and demonstrate an antidromic electrical stimulation of optic nerve using implanted MR-compatible tungsten electrodes4 at lateral geniculate nucleus (LGN).Materials and Methods
Manganese-enhanced MRI: At 24 hr after intravitreal injection with 0.25 µL of 0.2-M MnCl2 at the left eye, a 3D T1-wighted (T1W) MRI was performed on a mouse.5 A diffusion-weighted image (MEMRI_DWI) was subsequently acquired on the same mouse with the following parameters: TR = 0.2 s, TE = 27.3 ms, NT = 64, FOV = 30 × 30 mm2, matrix size = 192 × 192, thickness = 1.0 mm, b-value = 1.0 ms/µm2, δ = 5 ms, and Δ = 18 ms, 5 consecutive slices were imaged covering from optic chiasm to superior colliculus. Electrode implantation: A 15-mm midline skin incision was made and the skull exposed on 9 -10 weeks old C57BL/6 female mice. A tungsten electrode was implanted through a 2-mm burr hole at right LGN: 1.7 mm posterior to the bregma, 2.7 mm lateral to the midline, 3.1 mm deep. Either 35- or 50-µm diameter tungsten wires were employed. Stimulation conditions: (1) A 35-µm diameter tungsten electrode (n=5) with biphasic square-waves of 5 Hz, 10Vpeak-peak, 100-ms pulse width, and (2) a 50-µm diameter tungsten electrode with biphasic square-waves of 5 (n=4) and 10 Hz (n=5), 10Vpeak-peak, 50- and 100-ms pulse width, respectively. DWI: Mice were anesthetized with 0.8 - 1% isoflurane in O2. Diffusion fMRI was performed on a 4.7-T Agilent small-animal MR scanner using a multiple-echo spin-echo imaging sequence6 with the following parameters: TR = 1.5 s, TE = 34.4 ms, inter-echo delay = 18.2 ms, FOV = 20 × 20 mm2, matrix size = 256 × 256 (zero-filled to 512 × 512), and slice thickness = 1.3 mm. A pair of single-direction (perpendicular to optic nerve) DWI was acquired with b-value = 0.1 and 1.4 ms/µm2, δ = 5 ms, and Δ = 18 ms. Acquisition time was 12.8 minute for each pair of DW images.1, 2 Diffusion fMRI strategy: We acquired one baseline DWI without stimulation, followed by a DWI with electrical stimulation at LGN. After a single acquisition during stimulation, and an additional DWI was acquired immediately after the stimulation was turned off. Data analysis: ADC⊥ maps were generated from high and low b-value measurements under each condition. ROI was selected using the same procedure reported previously.1Results
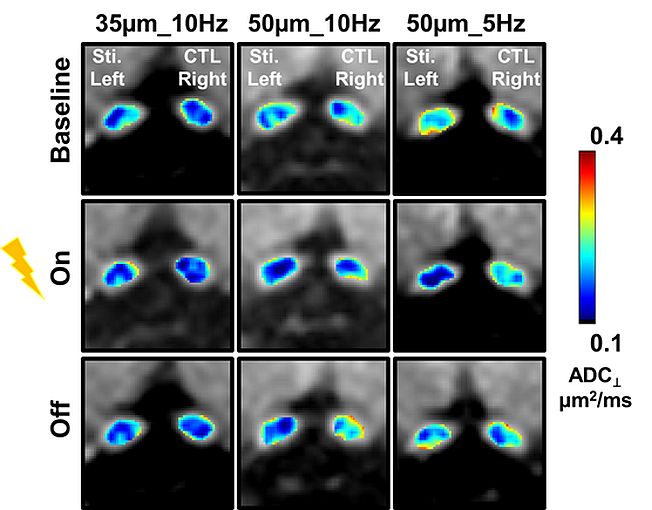
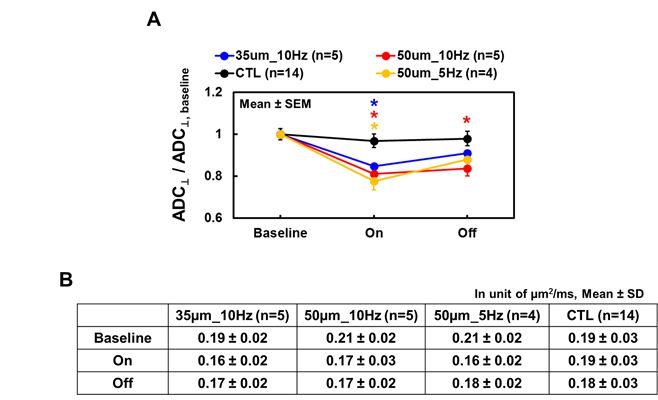
The MEMRI traced visual pathways from the anterior optic nerve fibers to contralateral LGN, and superior colliculus (Fig. 1A). The coordinate for electrode implantation at right LGN was fine-tuned based on the mouse brain atlas7 and MEMRI_DWI (Fig. 1 B). After electrode implantation, the electrode location was confirmed before each scan using DWI (Fig. 1C). During the electrical stimulation, decreased ADC⊥ (vs. baseline) of stimulated optic nerve (left) was detected while no detectable ADC⊥ change was seen at control optic nerve (right). Results clearly support that ADC⊥ change was associated with electrical stimulation (Figs. 2 and 3). We observed 15% and 19% of ADC⊥ decrease with 10Hz stimulation using 35- and 50-µm diameter tungsten electrodes, respectively (Fig. 3), suggesting activation-associated ADC⊥ change was input-current dependent. With the same 50-µm diameter tungsten wire, the 19% and 22% ADC⊥ decrease was seen with 10 and 5 Hz stimulating frequencies, respectively (Fig. 3), suggesting lower frequency might produce stronger nerve response as reflected by bigger ADC⊥ change. A slow ADC⊥ recovery was observed after turning off stimulation. This may reflect the effect of habituation from prolonged stimulation leading to the microstructural changes that required longer time to recover (Fig. 3).Conclusion
In the current study, we demonstrate the feasibility of diffusion fMRI with electrical stimulation under isoflurane anesthesia to assess axonal activation in mouse optic nerve bypassing the retina. The ADC⊥ change is dependent on the caliber of tungsten wires and stimulating frequency. Lower stimulating frequency resulted in higher optic nerve response, suggesting multiple variables available to change stimulation paradigm for examining the effect of stimulation intensity on ΔADC⊥.Acknowledgements
Authors thank Dr. SungHo Lee's experience sharing of tungsten-electrode fabrication. Supported in part by NIH R01-NS047592, P01-NS059560, U01-EY025500 and NMSS RG 5258-A-5.References
1. Spees WM, Lin TH, Song SK. White-matter diffusion fMRI of mouse optic nerve. NeuroImage 2013;65:209-215.
2. Lin TH, Spees WM, Chiang CW, Trinkaus K, Cross AH, Song SK. Diffusion fMRI detects white-matter dysfunction in mice with acute optic neuritis. Neurobiology of disease 2014;67:1-8.
3. Horstmann L, Schmid H, Heinen AP, Kurschus FC, Dick HB, Joachim SC. Inflammatory demyelination induces glia alterations and ganglion cell loss in the retina of an experimental autoimmune encephalomyelitis model. Journal of neuroinflammation 2013;10:120.
4. Lai HY, Albaugh DL, Kao YC, Younce JR, Shih YY. Robust deep brain stimulation functional MRI procedures in rats and mice using an MR-compatible tungsten microwire electrode. Magnetic resonance in medicine 2015;73:1246-1251.
5. Lin TH, Kim JH, Perez-Torres C, et al. Axonal transport rate decreased at the onset of optic neuritis in EAE mice. Neuroimage 2014;100C:244-253.
6. Tu TW, Budde MD, Xie M, et al. Phase-aligned multiple spin-echo averaging: a simple way to improve signal-to-noise ratio of in vivo mouse spinal cord diffusion tensor image. Magnetic resonance imaging 2014;32:1335-1343.
7. Franklin KBJ, Paxinos G. The mouse brain in stereotaxic coordinates. 3rd compact ed. New York, N.Y.: London : Elsevier/Academic Press; 2008:1 v. (various pagings).
Figures