2271
Radiomics Features Extracted from MRI as Biomarkers for Neuromyelitis Optica Spectrum Disorder and Multiple Sclerosis Differentiation1Department of Radiology, Chinese PLA General Hospital, Beijing, People's Republic of China, 2Chinese Academy of Sciences, Beijing, People's Republic of China, 3GE healthcare, Shanghai, People's Republic of China, 4Department of Neurology, Chinese PLA General Hospital, Beijing, People's Republic of China
Synopsis
The aim of our study was to ultilize combined radiomcis features extracted from T2-weighted MRI images as quantitative imaging biomarkers to differentiate neuromyelitis optica spectrum disorder (NMOSD) and multiple sclerosis (MS). Twenty-nine NMOSD patients and forty-five MS patients were enrolled. Our study showed 61 radiomics features and 8-feature-based radiomics signature were significantly different between NMOSD and MS. Therefore, radiomics may be an newly useful method which provides a promising non-invasive way of differentiating NMOSD and MS.
Introduction
Neuromyelitis optica spectrum disorder (NMOSD) has different pathophysiology, approaches to treatment and prognosis from multiple sclerosis (MS). 1,2 It is challenging to distinguish these two disorders by clinical manifestations and conventional neuroimaging, especially for the NMOSD patients with multiple brain lesions that are similar to MS.1,3 MRI, which is currently used for the diagnosis of NMOSD and MS, 4,5 is limited in signal intensity, lesion distribution, morphology. Radiomics which is known as the process of conversion of digital medical images into mineable high-dimensional data provides comprehensive quantification of region of interest ( ROI) by extracting and mining large number image features from medical images. 6-9 The aim of this study was to ultilize combined radiomcis features extracted from T2-weighted MRI images as quantitative imaging biomarkers to differentiate NMOSD and MS.Methods
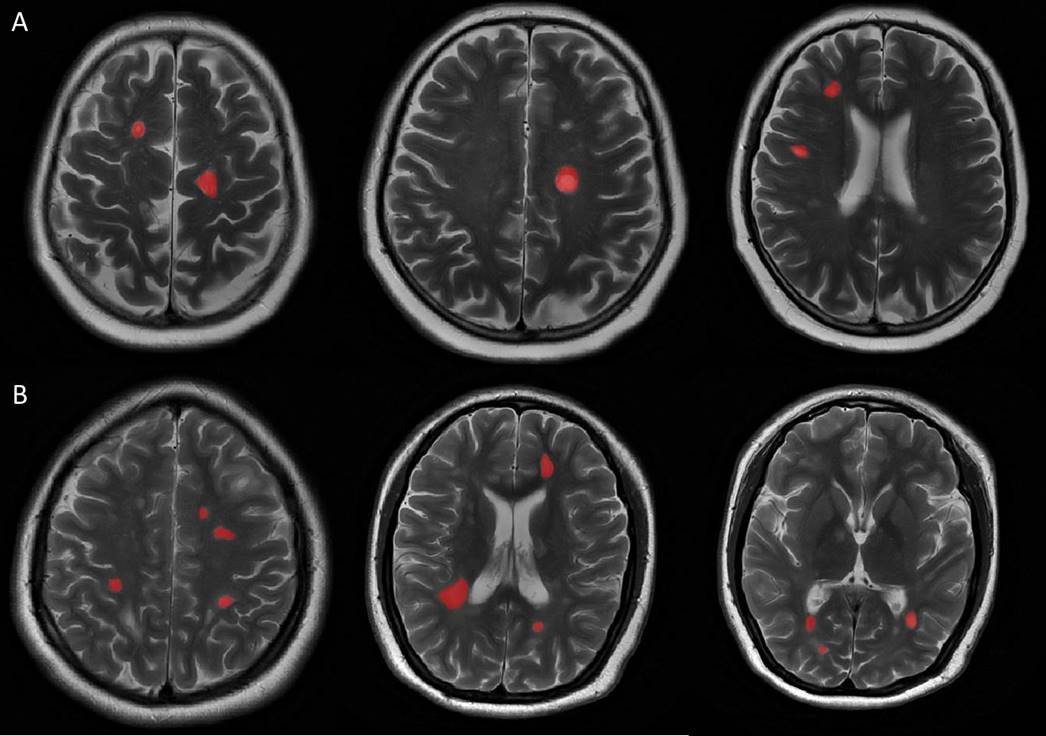
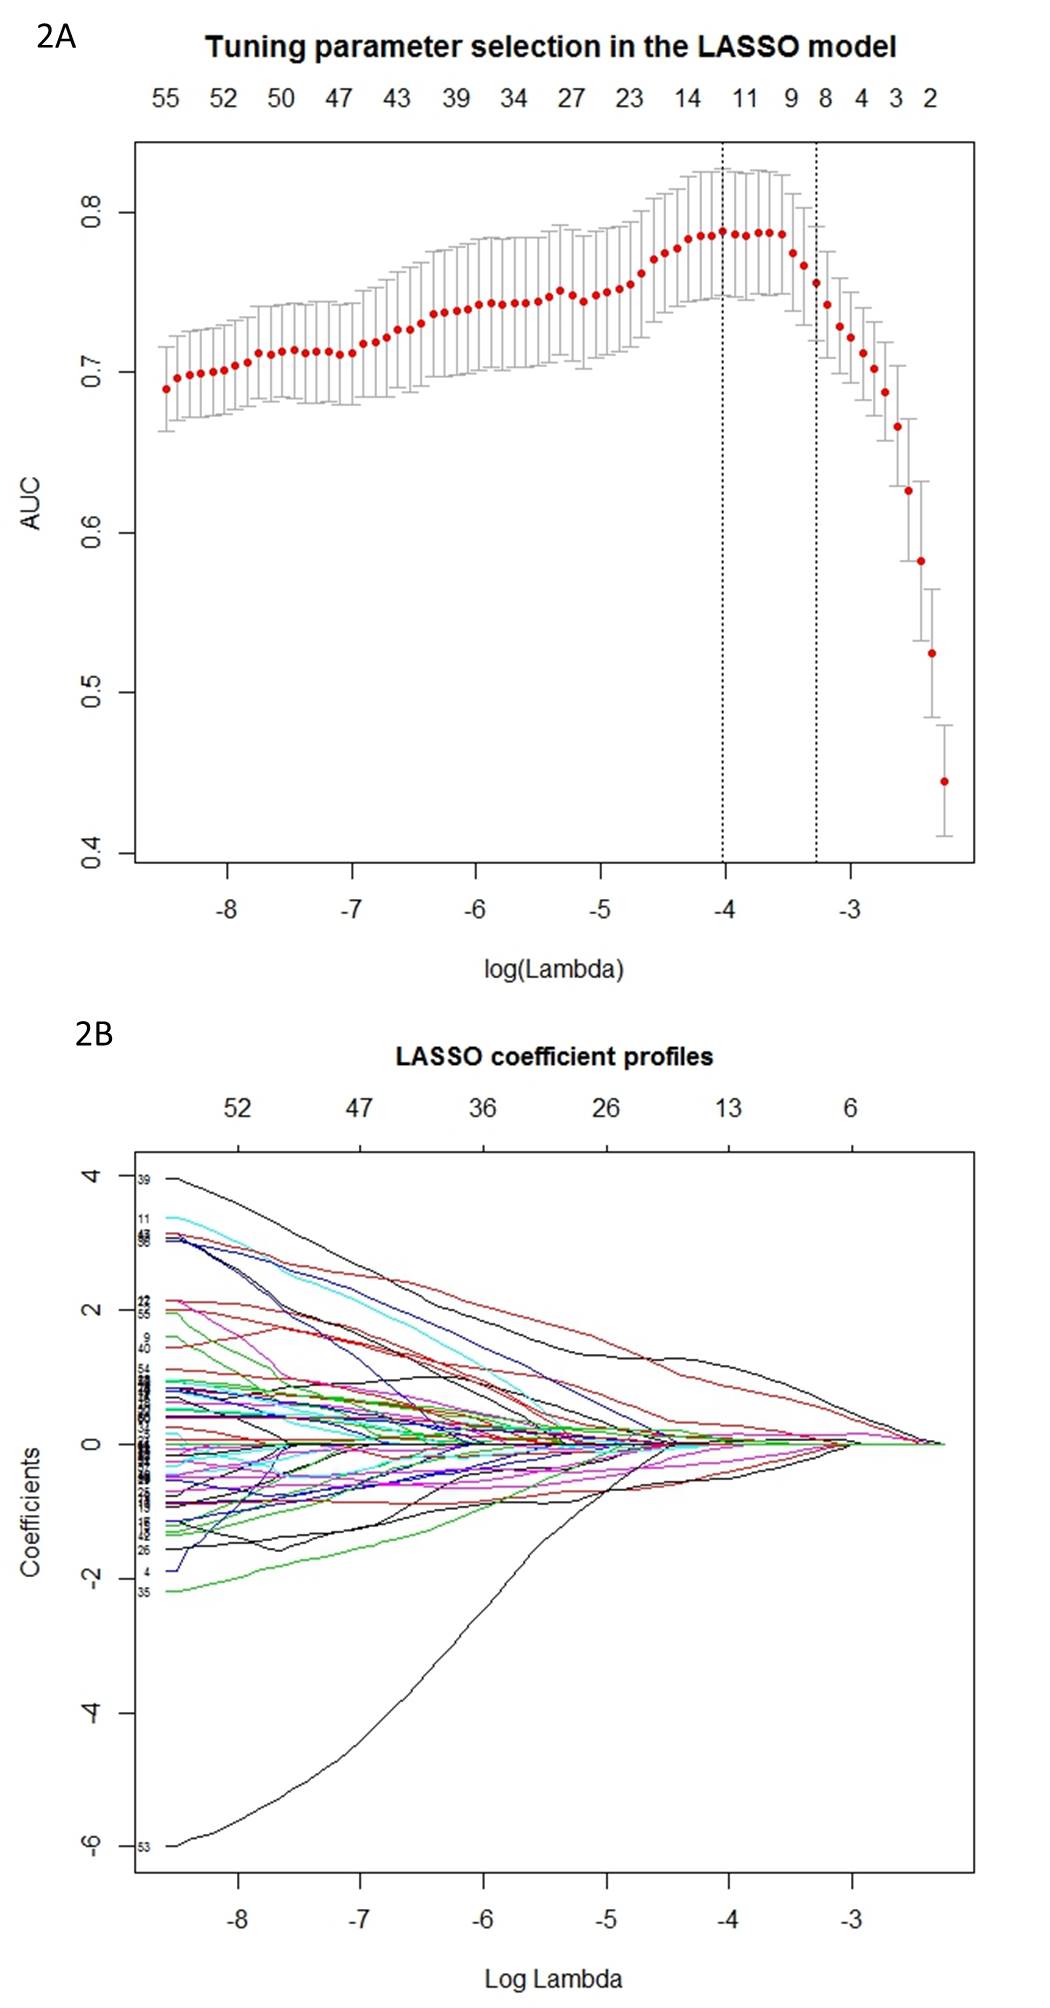
Twenty-nine NMOSD patients (according to the 2015 revised diagnostic criteria) and forty-five MS patients (according to the 2010 revised Mcdonald criteria) were prospectively and consecutively enrolled from September 2014 to May 2016. All the patients underwent MRI exams including axial T2-weighted images (T2WI), cortical T2 Fluid Attenuated Inversion Recovery (FLAIR) sequence as well as diffusion weighted images (DWI). MS and NMOSD lesions were identified if the area measured was greater than 10 mm2 at the slice with the largest cross-section of lesion in periventricular, juxtacortical and infratentorial regions, as well as subcortical white matter and deep grey matter (manually drawn on axial T2WI as ROIs using ITK-SNAP software by experienced radiologists). Lesions were identified and delineated using axial T2WI and cortical T2 FLAIR sequence. Two hundred and seventy-three 2D radiomics features were extracted from the ROIs above using in-house feature extraction software with algorithms implemented in Matlab 2014a (Mathworks, Natick, USA). The feature sets were divided into four groups: (I) shape, (II) first order texture, (III) second order texture and (IV) wavelet features. Least absolute shrinkage and selection operator (LASSO) regression model was used for data dimention reduction , feature selection and radiomics signature building.6 The receiver operating characteristic (ROC) curves were drawn to compare the efficacy of feature analysis in differentiating NMOSD and MS. The 2D segmentation and radiomics signature building were illustrated in figure 1 and figure 2, respectively.Results and Discussion
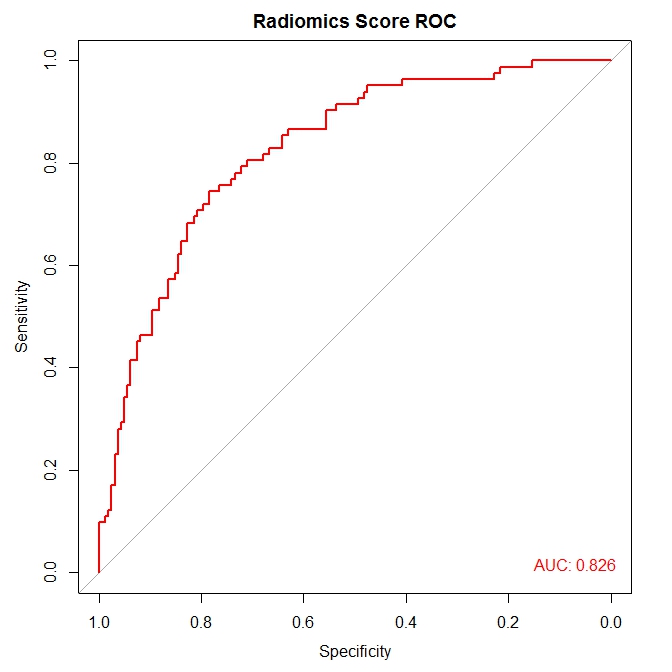
There were no significant differences in age between MS (mean age, 38±10 years; 30 women) and NMOSD (mean age, 34±13 years; 27 women). Sixty-one radiomics features, most of which were the second order texture features calculated from the gray level co-occurrence matrix (GLCM), were significantly different (p value <0.05) between NMOSD and MS which revealed the potential discrimination power of texture analysis to be used for our object. The radiomics signature, which was combined with eight radiomics features (0_fos_uniformity, Max3D, 2_GLCM_contrast, 1_GLRLM_SRE, 4_GLCM_IDMN, 1_GLCM_maximum_probability, Surface_to_volume_ratio, and 2_GLCM_autocorrelation) from LASSO regression, was significantly different between the two groups (P<0.001), with area under ROC curve (AUC) of 0.826 (95%CI: 0.773-0.880) (Figure 3).Conclusion
In this study, Sixty-one radiomics features and 8-feature-based radiomics signature built by feature extraction and LASSO regression from T2WI were significantly different between NMOSD and MS. Therefore, radiomics may be an newly useful method which provides a promising non-invasive way of differentiating NMOSD and MS. Further study is warranted.Acknowledgements
None.References
1. Chawla S, Kister I, Wuerfel J, et al. Iron and Non-Iron-Related Characteristics of Multiple Sclerosis and Neuromyelitis Optica Lesions at 7T MRI. AJNR American journal of neuroradiology. 2016 Jul;37(7):1223-30.
2. Lennon VA, Wingerchuk DM, Kryzer TJ, et al. A serum autoantibody marker of neuromyelitis optica: distinction from multiple sclerosis. The Lancet. 2004;364(9451):2106-12.
3. Eshaghi A, Riyahi-Alam S, Saeedi R, et al. Classification algorithms with multi-modal data fusion could accurately distinguish neuromyelitis optica from multiple sclerosis. NeuroImage Clinical. 2015;7:306-14.
4. Wingerchuk DM, Banwell B, Bennett JL, et al. International consensus diagnostic criteria for neuromyelitis optica spectrum disorders. Neurology. 2015 Jul 14;85(2):177-89.
5. Polman CH, Reingold SC, Banwell B, et al. Diagnostic criteria for multiple sclerosis: 2010 revisions to the McDonald criteria. Annals of neurology. 2011 Feb;69(2):292-302.
6. Huang YQ, Liang CH, He L, et al. Development and validation of a radiomics nomogram for preoperative predicting lymph node metastasis in colorectal cancer. J Clin Oncol. 2016; 34(18): 2157-2164.
7. Gillies RJ, Kinahan PE, Hricak H. Radiomics: Images Are More than Pictures, They Are Data1. Radiology. 2016;278:563-577.
8. Lambin, P, Rios-velazquez, E, Leijenaar, R. Radiomics?: Extracting more information from medical images using advanced feature analysis. Eur J Cancer. 2012; 48(4): 441–446.
9. Aerts, HJ, Velazquez, ER, Leijenaar, RT, et al. Decoding tumour phenotype by noninvasive imaging using a quantitative radiomics approach. Nat Commun. 2014; 5: 4006.
Figures