2270
Permeability of the Blood-brain Barrier may Differentiate Neuromyelitis Optica Spectrum Disorder from Multiple Sclerosis1Department of Radiology, Chinese PLA General Hospital, Beijing, People's Republic of China, 2GE healthcare China, Beijing, Beijing, People's Republic of China, 3GE healthcare China, Shanghai, Shanghai, People's Republic of China, 4Department of Neurology, Chinese PLA General Hospital, Beijing, People's Republic of China
Synopsis
The aim of our study was to characterize blood-brain barrier (BBB) permeability in neuromyelitis optica spectrum disorder (NMOSD) and multiple sclerosis (MS) using dynamic contrast-enhanced MRI (DCE-MRI). Twenty-two NMOSD patients and twenty-three MS patients were enrolled. Significantly higher BBB permeability were found in lesions and normal appearing grey matter in MS group when compared with NMOSD but no differences were observed in corpus callosum. Hence BBB permeability, measured by DCE-MRI may be used for differential diagnosis between NMOSD and MS and may provide novel insights into the underlying pathological differences.
Introduction
Previous researches have demonstrated that blood-brain barrier (BBB) permeability can be used as an imaging biomarker to reflect the microvascular integrity and hemodynamic change in multiple sclerosis (MS) and to predict conversion from optic neuritis to MS.1-3 However, knowledge of BBB damage in neuromyelitis optica spectrum disorder (NMOSD), and quantitative biomarker regarding MS and NMOSD are still lacking. The primary purpose of this study is first to characterize BBB permeability/abnormality in NMOSD and MS using metrics derived from dynamic contrast-enhanced MRI (DCE-MRI), and then to determine whether BBB permeability/abnormality can be used to differentiate NMOSD from MS.Methods
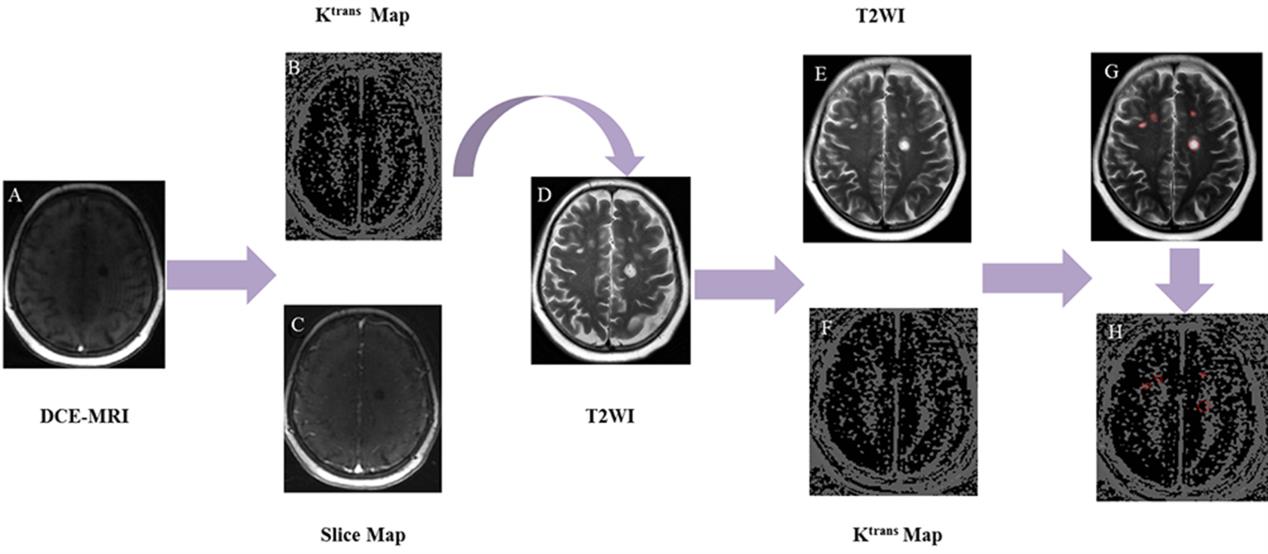
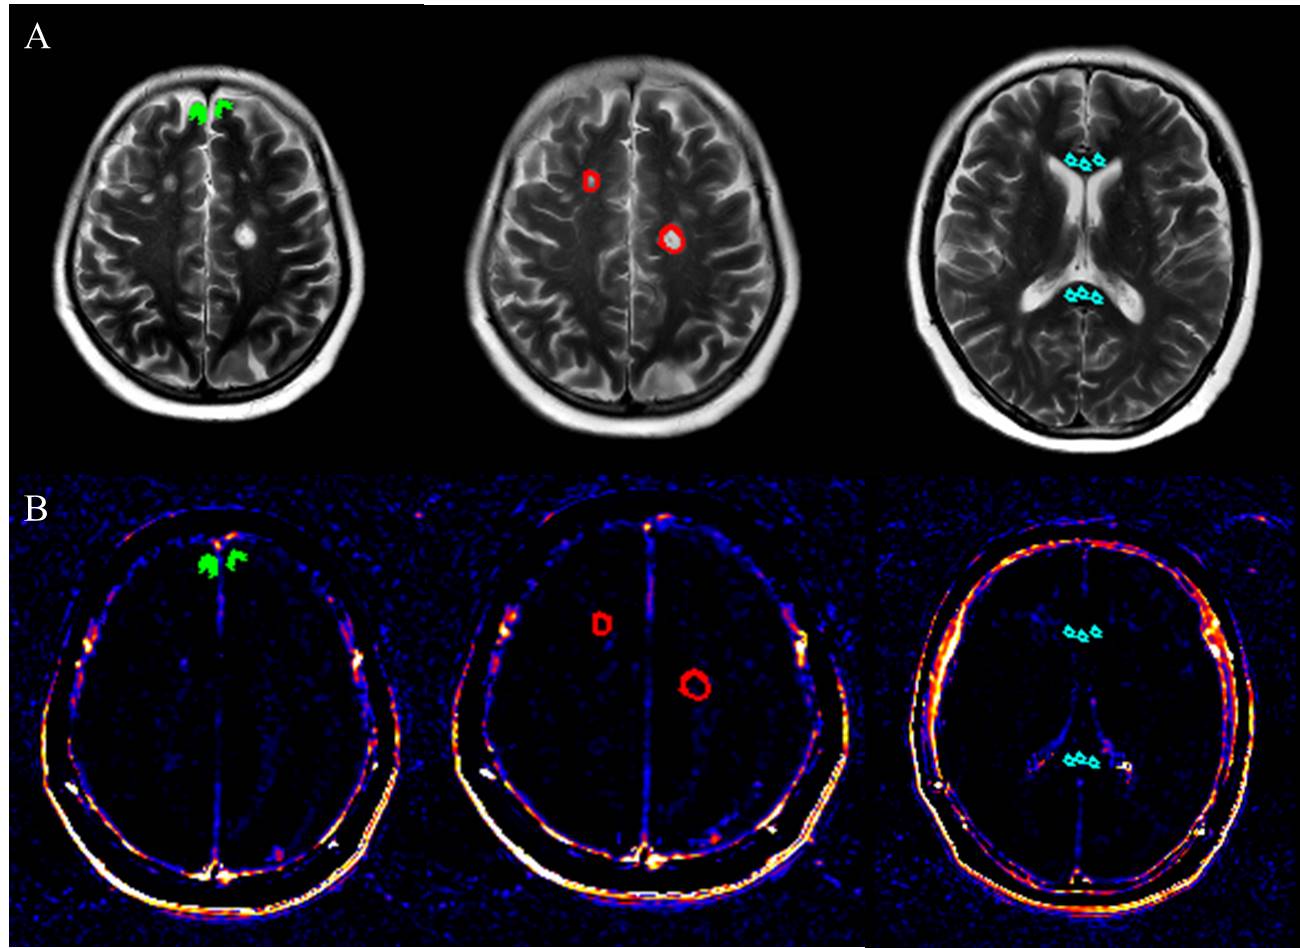
Twenty-Two NMOSD patients (according to the 2015 revised diagnostic criteria) and twenty-three MS patients (according to the 2010 revised Mcdonald criteria) were prospectively and consecutively enrolled from September 2014 to May 2016. All the participants underwent MRI exams including axial T2-weighted images (T2WI), cortical T2 Fluid Attenuated Inversion Recovery (FLAIR) sequence as well as DCE-MRI. Volume transfer constant (Ktrans)/slice maps indicating BBB permeability were generated and calculated using a semi-automatic software Omni-Kinetics (GE Healthcare, China). Patlak model was used for the calculation of Ktrans values. Axial images of T2WI were manually registered to Ktrans/slice maps of DCE-MRI using SPM 8.0. MS and NMOSD lesions, normal appearing grey matter (NAGM) and corpus callosum were manually drawn on axial T2WI as regions of interest (ROIs) using MIPAV software by experienced radiologists. MS and NMOSD lesions were identified if the area measured at the slice with the largest lesion cross section is greater than 10 mm2 in periventricular, juxtacortical and infratentorial, as well as subcortical white matter and deep grey matter. Lesions were identified and delineated using axial T2WI and cortical T2 FLAIR sequence. NAGM was outlined in the frontal cortex adjacent to superior sagittal sinus,4 and lesions were avoided based on axial T2WI and sagittal CUBE FLAIR images. The size of ROIs in NAGM varied from 10-35 mm2 according to the cortical thickness of the individuals.5 The identified ROIs were then transferred from T2WI to Ktrans for measurements of lesion, corpus callosum, and NAGM. Ktrans measurements were averaged if the lesion was present on multiple slices. The image post-processing and ROI placement were illustrated in figure 1 and figure 2, respectively.Results
Demographics and the measured permeability of the blood–brain barrier in NMOSD and MS patients are summarized in Table 1. No significant difference existed in age between NMOSD (mean age, 35±14 years; 21 women) and MS (mean age, 37±11 years; 17 women) group. A total of 109 NMOSD lesions, 211 MS lesions, as well as the NAGM, and corpus callosum of each participant were analyzed. Significantly higher Ktrans values were found in lesions and NAGM in MS group when compared with NMOSD (0.0051 ± 0.0041 vs 0.0033 ± 0.0031, p= 0.000 for lesions and 0.0031± 0.0016 vs 0.0021± 0.0011, p=0.037 for NAGM). However, no significant differences were found in corpus callosum between MS and NMOSD groups. (0.0051±0.0044 vs 0.0037 ± 0.0024, p= 0.352).Discussion
Our study showed significantly higher BBB permeability in lesions and NAGM in MS compared to NMOSD groups. MS mainly shows inflammatory reaction while NMOSD mainly shows antigen-antibody reaction of aquaporin-4. 6 Increased vascular permeability and leukocyte infiltration, which directly reflect the BBB dysfunction, are more severe in MS patients compared to NMOSD. A growing number of studies have indicated that cortical demyelinated lesions are frequently present in MS patients but not in NMOSD/NMO. 7-10 Therefore, the presence of significantly higher cortical BBB permeability in MS could be reasonable, which is consistent with our MR imaging findings.Conclusion
In this study, the pivotal role of BBB pathology in distinguishing NMOSD from MS patients was confirmed based on results from DCE-MRI. The BBB permeability as measured by Ktrans was seen to be difference between MS and NMOSD lesions and NAGM but no differences were observed in corpus callosum. Hence the quantitative measures from DCE-MRI such as Ktrans may be used for differential diagnosis between NMOSD and MS and may provide novel insights into the underlying pathological differences.Acknowledgements
None.References
1. Cramer SP, Simonsen H, Frederiksen JL, Rostrup E, Larsson HB. Abnormal blood-brain barrier permeability in normal appearing white matter in multiple sclerosis investigated by MRI. NeuroImage Clinical. 2014;4:182-9.
2. Ingrisch M, Sourbron S, Morhard D, et al. Quantification of perfusion and permeability in multiple sclerosis: dynamic contrast-enhanced MRI in 3D at 3T. Investigative radiology. 2012 Apr;47(4):252-8.
3. Cramer SP, Modvig S, Simonsen HJ, et al. Permeability of the blood–brain barrier predicts conversion from optic neuritis tomultiple sclerosis. Brain. 2015;138:2571-2583.
4. Mainero C, Benner T, Radding A, et al. In vivo imaging of cortical pathology in multiple sclerosis using ultra-high field MRI. Neurology. 2009; 73(12):941-948.
5. Gao T, Lyu JH, Zhang JT, et al. Diffusion-weighted MRI findings and clinical correlations in sporadic Creutzfeldt CJakob disease. Journal of Neurology. 2015; 262: 1440-1446.
6. Popescu BF, Pirko I, Lucchinetti CF. Pathology of multiple sclerosis: where do we stand? Continuum (Minneapolis, Minn). 2013 Aug;19(4 Multiple Sclerosis):901-21.
7. Saji E, Arakawa M, Yanagawa K, et al. Cognitive impairment and cortical degenerationin neuromyelitis optica. Annals of neurology. 2013 Jan;73(1):65-76.
8. Calabrese M, Oh MS, Favaretto A, et al. No MRI evidence of cortical lesions in neuromyelitis optica. Neurology. 2012 Oct 16;79(16):1671-6.
9. Sinnecker T, Dorr J, Pfueller CF, et al. Distinct lesion morphology at 7-T MRI differentiates neuromyelitis optica from multiple sclerosis. Neurology. 2012 Aug 14;79(7):708-14.
10. Popescu BF, Parisi JE, Cabrera-Gomez JA, et al. Absence of cortical demyelination in neuromyelitis optica. Neurology. 2010 Dec 7;75(23):2103-9.
Figures