2268
Ultra-high spatial resolution imaging in vivo of human retina at 3T1Sino-Dutch Biomedical and Information Engineering School, Northeastern University, Shenyang, People's Republic of China, 2Department of Radiology, Wayne State University, Detroit, MI, United States, 3Shanghai Key Laboratory of Magnetic Resonance, East China Normal University, Shanghai, People's Republic of China, 4Department of Biomedical Engineering, Wayne State University, Detroit, MI, United States, 5Department of Anatomy and Cell Biology, Wayne State University, Detroit, MI, United States, 6Department of Ophthalmology, Wayne State University, Detroit, MI, United States, 7The MRI Institute for Biomedical Research, Detroit, United States
Synopsis
Imaging in vivo human retina remains a considerable challenge due to the thinness of the retina and eye motion. Here we provide proof-of-concept data supporting the use of an asymmetric gradient echo scan with TE to 5 ms and an effective resolution of 37 μm in the readout direction after partial Fourier reconstruction. To reduce motion, we employed a cued-blinking strategy and collected the data multiple times and averaged data that after co-registration. Preliminary results showed retina/choroid layer clearly with sufficient SNR to obtain a transretinal T1 map from vitreous body to sclera.
PURPOSE
MR Imaging has potential advantages for transformative functional mapping of the neuroretina in diseases such as retinal degeneration and diabetic retinopathy.1,2 The submillimeter-thickness of the human retina (which is about 250 mm as measured by OCT3) requires ultra-high spatial resolution but is a challenge in vivo for the human retina due to the motion of the eye. To address this problem, we test the utility of a fully-sampled asymmetric echo scheme to reduce the echo time to 5 ms for the GRE sequence with an effective resolution of 37 μm in the readout direction after partial Fourier reconstruction. We used a cued-blinking strategy4 to avoid motion artifacts.METHODS
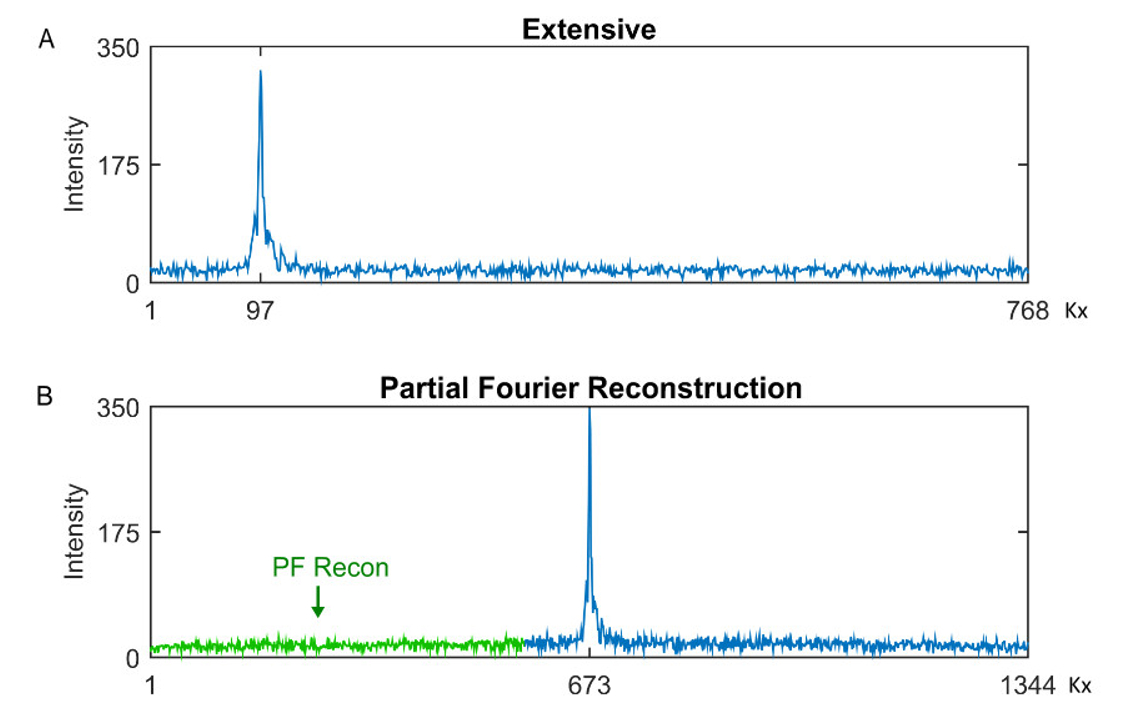
Sequence Design. We used an extended sampling window for the echo as shown in Figure 1A to enhance the resolution. After partial Fourier the readout k-space now appears fully sampled with the equivalent of 2688 points (as there is always an 100% oversampling in readout) as shown in Figure 1B. To implement this scheme, we need to take into account the asymmetric factor when calculating the readout gradient. For a field-of-view Lx, to obtain a given resolution Δx=Lx/nx with a given bandwidth, at least nx/2 points must be collected after the echo. Here we use an asymmetry factor of 12.5%, and nx = 1344 points on 50 mm to obtain a resolution of 37 μm.
Data acquisition and reconstruction. Three healthy volunteers were scanned on a Siemens 3T Verio using a single channel eye surface coil with diameter of 2.7 inches. Initial parameter adjustments were performed on two subjects (data not shown) before collecting the feasibility data shown herein. A single 2D slice located at the center of the lens and optical nerve head were acquired 25 times. A cued-blinking strategy was used to avoid motion artifacts.4 Imaging parameters were: TR = 35 ms, FA = 5, 10, 25, 35, 50 and 65 degrees respectively, TE = 5 ms, BW/pixel = 50 Hz/pixel, FOV = 50 mm x 50 mm, Acquisition Matrix = 768(readout) x 192(phase, 25%), PPF = 6/8, TH = 2.0 mm, 12.5% sampling points in front of the echo center and 87.5% behind the echo center, phase oversampling = 100% to avoid phase wrap-around, which lead to 11 seconds per acquisition. Iterative PF reconstruction was used to reconstruct the whole k-space.5 We stopped the iteration until the L2 norm of the difference reconstruction between iterations was lower than 1% of the square root of the sum of all pixels of the image.
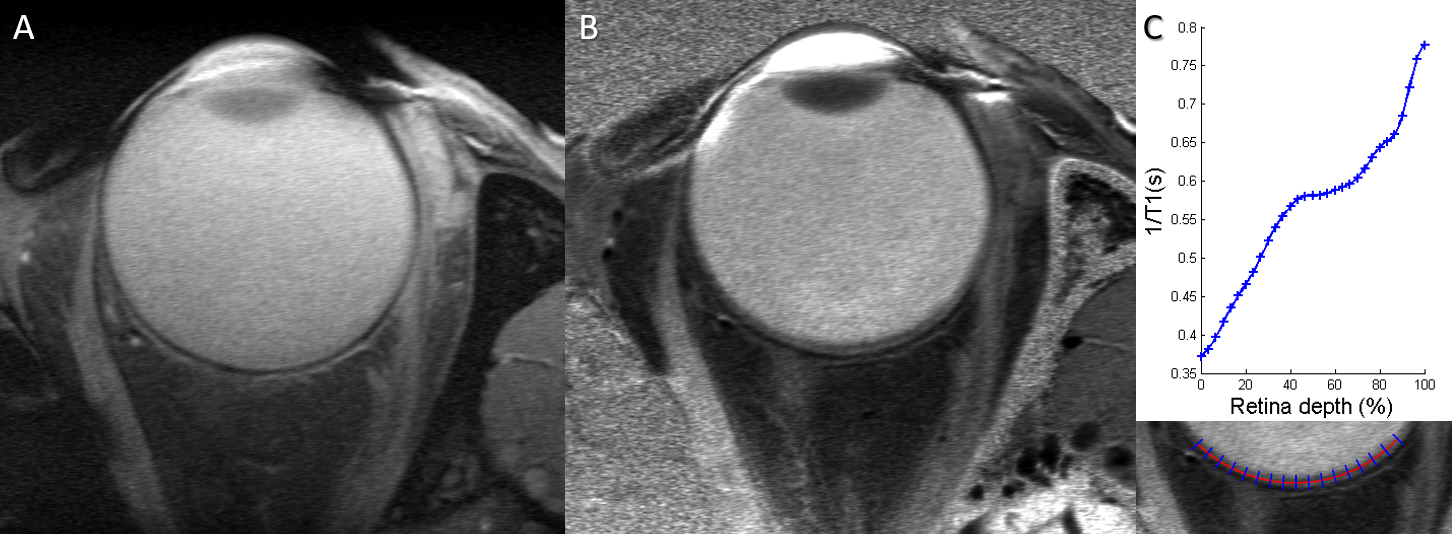
Data processing and analysis. The final images were generated after co-registration and averaging to improve SNR. Both T1 and spin density maps were created using a variable flip angle (VFA) approach.6,7 For the transretinal T1 measurement, firstly, we draw a ROI (red-curve in Figure 3C) along the center of the retina layer on the T1MAP. Then lines (blue-lines in Figure 3C) perpendicular to the ROI were mapped pixel by pixel so that 31 pixels covered the transretinal space. After that, 1/T1 profile was normalized with 0% depth at the presumptive vitreoretinal border and 100% depth at the presumptive retina-choroid border.
RESULTS
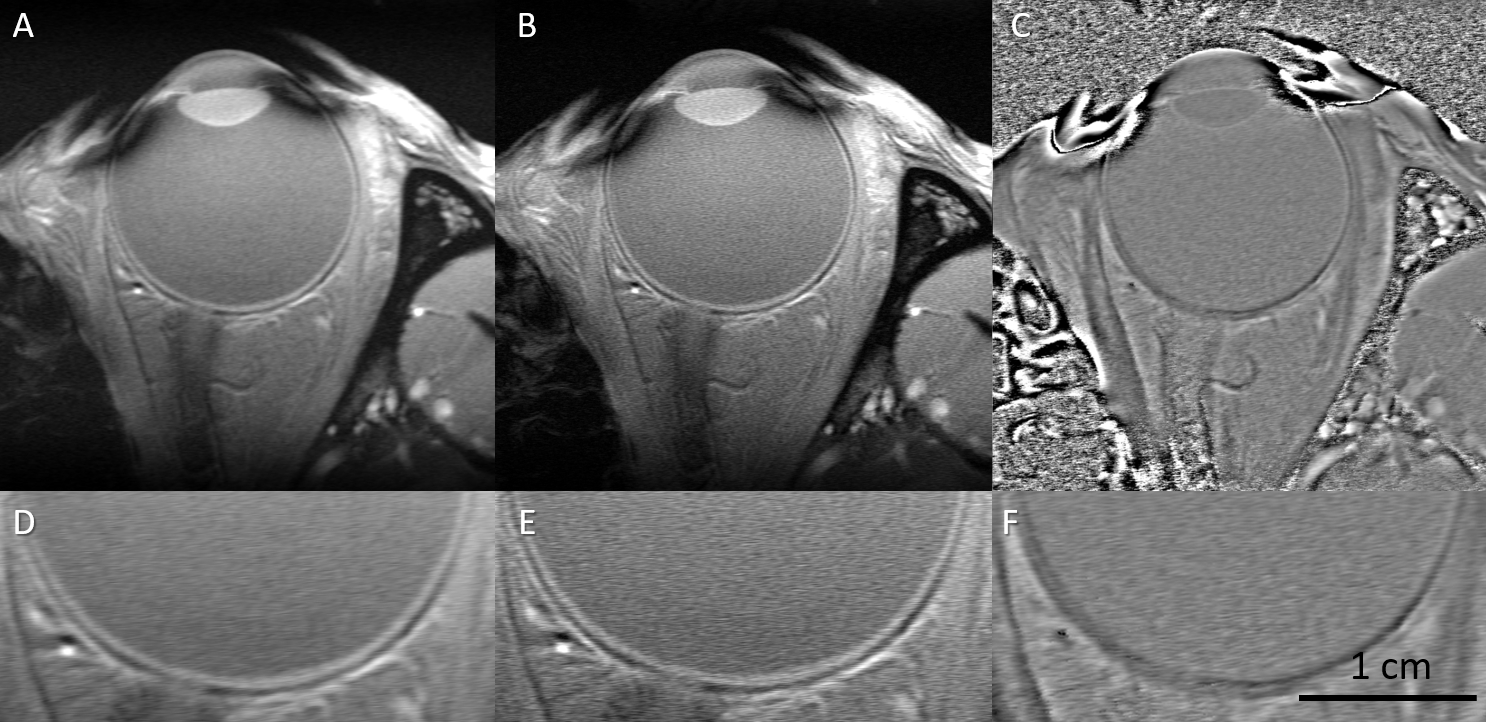
Since we are most interested in high resolution across the retina, we acquired the data with ultra-high spatial resolution in the readout direction and a lower resolution in the phase encoding direction. Although the iterative partial Fourier reconstructed image had decreased SNR due to increased resolution, this anatomical T1W image (FA = 25o), Figure 2B and 2E, along with the phase image (Figure 2C and 2F) with effective resolution of 37 μm in the readout direction depicted the retina/choroid layer clearly with sufficient SNR. The T1 map (Figure 3B) showed decreasing T1 along the retina depth from presumptive vitreoretinal border to presumptive retina-choroid border.DISCUSSION AND CONCLUSIONS
These preliminary human eye results acquired in a few minutes at 3T open the door to imaging neuroretina function, including within different compartments within rod photoreceptors in vivo.1 Most of the current MRI assays of rod cell compartment-specific function are based on endogenous contrast mechanisms, and this is expected to facilitate their translation into patients with, for example, diabetic retinopathy and retinal degenerative disease.1 Furthermore, this approach is potentially useful for imaging other tissues such as brain grey matter layers and knee cartilage layers in 3D as well when taking advantage of parallel imaging with multi-channel coils.Acknowledgements
Thanks to Mr. Zahid Latif and Mr. Yang Xuan, who are MR specialists in Department of Radiology, Wayne State University, for helping in collecting the data.References
1. Berkowitz BA, Bissig D, Roberts R. MRI of rod cell compartment-specific function in disease and treatment in vivo. Progress in retinal and eye research. 2016;51:90-106.2. Duong TQ. Magnetic resonance imaging of the retina: from mice to men. Magn Reson Med. 2014; 71(4):1526-30.
3. Adhi M, Aziz S, Muhammad K, Adhi MI. Macular thickness by age and gender in healthy eyes using spectral domain optical coherence tomography. PLoS One. 2012;7(5):e37638.
4. Berkowitz BA, McDonald C, Ito Y, et al. Measuring the human retinal oxygenation response to a hyperoxic challenge using MRI: eliminating blinking artifacts and demonstrating proof of concept. Magn Reson Med. 2001;46(2):412-6.
5. Haacke EM, Brown RW, Thompson MR, Venkatesan R. Magnetic resonance imaging: physical principles and sequence design: Wiley-Liss New York:; 1999.
6. Venkatesan R, Lin W, Haacke EM. Accurate determination of spin-density and T1 in the presence of RF-field inhomogeneities and flip-angle miscalibration. Magn Reson Med. 1998;40(4):592-602
7. Wang HZ, Riederer SJ, Lee JN. Optimizing the precision in T1 relaxation estimation using limited flip angles. Magn Reson Med. 1987;5(5):399-416.
Figures