2267
How does blindness onset impact on the structure of the optic radiation?1CIMeC Center for Mind/Brain Sciences, Trento University, Trento, Italy, 2Institute of Psychology (IPSY) and of Neurosciences (IoNS); University of Louvain-la-Neuve; Belgium
Synopsis
The human brain is capable of massive reorganization in case of sensory deprivation. Blind studies show white and gray matter changes depending on blindness onset. However, the anatomical reorganization of the optical tract in blind is largely unknown. We investigated the changes in the optic radiation tract using diffusion-based tractography techniques in early and late blind subjects compared to age- and gender-matched healthy sighted controls. We found activity-dependent alterations of the optical radiation, demonstrating the importance of visual experience for the integrity of the tract. The characterization of such reorganization processes may have clinical value when assessing sight restoration possibilities.
Purpose
The optic radiation (OR) represents the main pathway to convey visual input from the lateral geniculate nucleus (LGN) of the thalamus to the occipital cortex where this information is elaborated. Its anatomy has been largely investigated in dissection and tractography studies in healthy sighted controls (SC)1,2. However, little is known about the anatomical profile of the OR fibers in blind subjects3. Using a region of interest (ROI)-based approach, a few studies have found widespread fractional anisotropy (FA) differences in early blind (EB) relative to SC, but no differences between late blind (LB) and SC 4,5. The goals of this study are: 1) to reconstruct the profile of the OR in EB and LB subjects and to characterize tract-specific differences in blind relative to normal sighted subjects, 2) to test whether sight deprivation onset affects OR’s reorganization.Methods
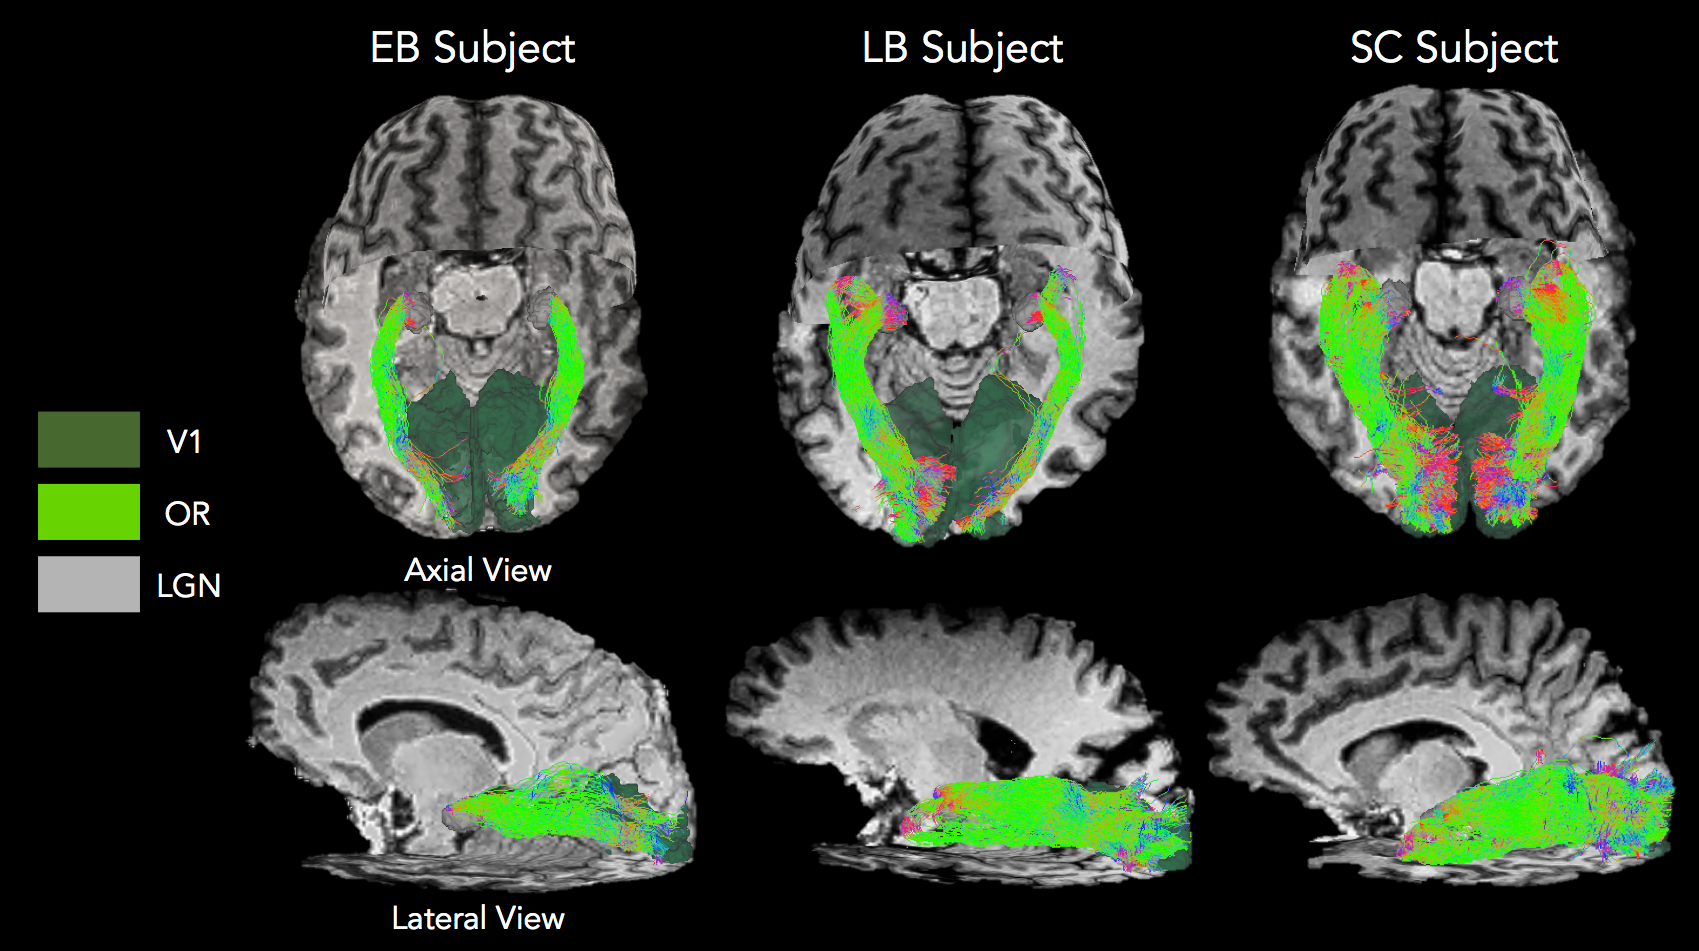
14 early blind (6 males, mean age 33, onset ≤ 3 years old) and 11 late blind (8 males, mean age 42, onset > 3 years old) subjects were investigated with two gender- and age-matched groups of healthy sighted controls. A 4T Bruker Medspec MRI scanner was used to acquire diffusion (2.3 mm isotropic voxel, 60 DW volumes and 10 b0 volumes, b=1500 s/mm2, TE=99 ms) and T1 anatomical (MPRAGE, 1 mm isotropic) data. Diffusion data were corrected for eddy currents and head motion in FSL followed by bias field correction and global intensity normalization using MrTrix36. A constrained spherical deconvolution model (lmax=6) was fit to the data and anatomically constrained7 probabilistic tractography was performed on up-sampled DW data (0.5 mm step size, 45° maximum angle threshold, 1000 seeds per voxel). Tracking was initiated from each voxel in the LGN with primary visual cortex (V1) as target. LGN and V1 were extracted from the Juelich atlas (25% threshold) and registered to the diffusion space of each subject in FSL. Streamline count, and tensor-derived mean scalar measures were extracted for each OR tract: fractional anisotropy (FA), radial diffusivity (RD), axial diffusivity (AD), mean diffusivity (MD).Results
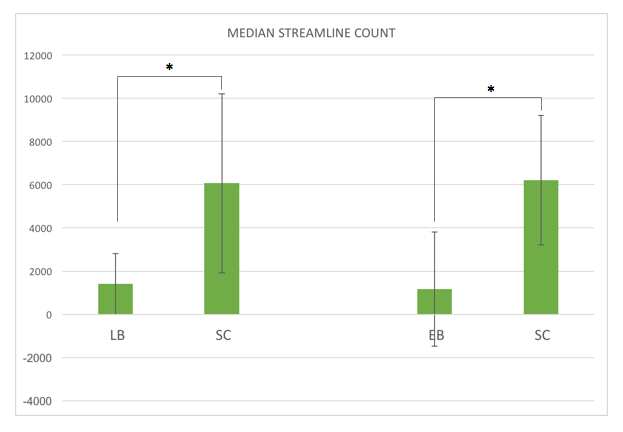
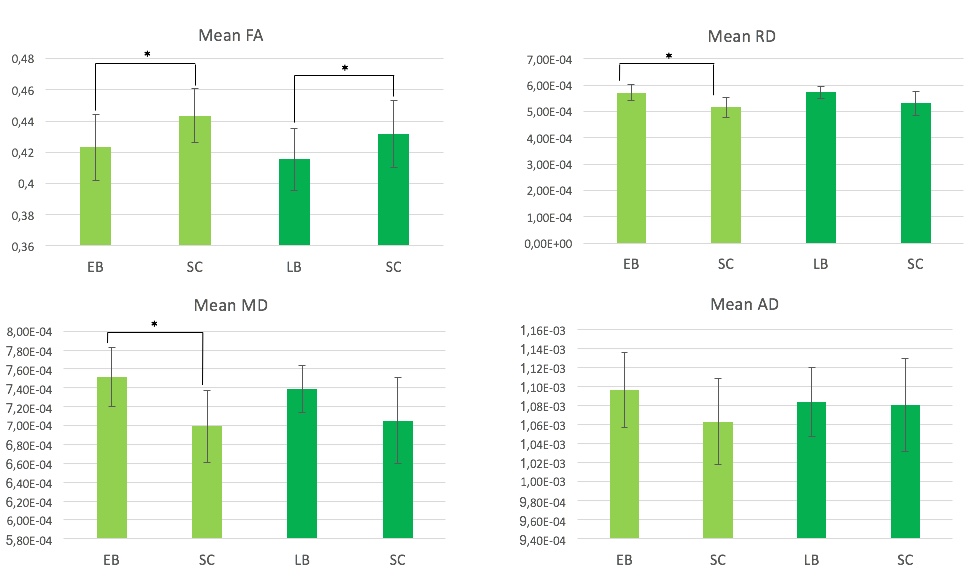
Considerable variability across subjects was observed in the number of OR streamlines within each group. However, overall the 3D profile of the OR appears qualitatively reduced in both EB and LB when compared to SC reconstructions (Figure 1). In agreement with this, streamline count (left and right OR averaged) was significantly reduced in both EB and LB subjects when compared to matched SC (p<0.05, Figure 2). Mean FA was significantly lower in both LB and EB compared to matched SC, while the difference in RD and MD was significant for the EB-SC comparison only (p<0.05, Figure 3). None of the DTI scalar metrics (FA, MD, AD, RD) correlated with blind onset in LB (age effects regressed out).Discussion and Conclusion
These preliminary results show activity-dependent alteration of the optical radiation, demonstrating the role experience plays in maintaining the integrity of this ancient visual structure. Somehow surprisingly, it seems that even late-acquired blindness and even for a relatively short period is sufficient to induce those modifications. Current study limitations include the use of ROIs from atlas that might introduce false positives results and wrong tract termination in the tractography reconstruction. Future work will investigate methods of obtaining a more reliable tractography reconstruction of this tract. Precise quantification of the optic radiation in early and late blind individual may have clinical value to assess the potential suitability of sight restoration.Acknowledgements
No acknowledgement found.References
1. Sarubbo S., De Benedictis A., Milani P., et al. The course and the anatomo-functional relationships of the optic radiation: a combined study with “post mortem” dissections and “in vivo” direct electrical mapping. Journal of Anatomy 2015; 226(1), 47-59.
2. Kammen A., Law M., tjan B.S., Toga A. W., Shi Y. Automated retinofugal visual pathway reconstruction with multi-shell HARDI and FOD-based analysis. Neuroimage. 2015; 125:767-779.
3. Shimony J.S., Burton H., Epstein A.A., et al. Diffusion tensor imaging reveals white matter reorganization in early blind humans. Cerebral Cortex, 2006; 16(11): 1652-1661.
4. Scoth F., Burgel U., Dorsch R., et al. Diffusion tensor imaging in acquired blind humans. Neuroscience Letters. 2006; 398, 178-182.
5. Shu N., Liu Y., Li J., et al. Altered anatomical Network in early blindness revealed by Diffusion Tensor Tractography. PLoS ONE. 2009;4(9),e7228.
6. J. D. Tournier, F. Calamante, and A. Connelly. MRtrix: Diffusion tractography in crossing fiber regions. Int. J. Imaging Syst. Technol. 2012;22(1), 53–66
7. Smith R. E., Tournier J. D., Calamante F., & Connelly A. Anatomically-constrained tractography: Improved diffusion MRI streamlines tractography through effective use of anatomical information. Neuroimage. 2012; 62(3), 1924-1938.
Figures