2262
Multi-parametric magnetic resonance imaging for differentiating benign from malignant orbital lymphoproliferative disorders1Radiology, The First Aaffiliated Hospitla of Nanjing Medical University, Nanjing, People's Republic of China
Synopsis
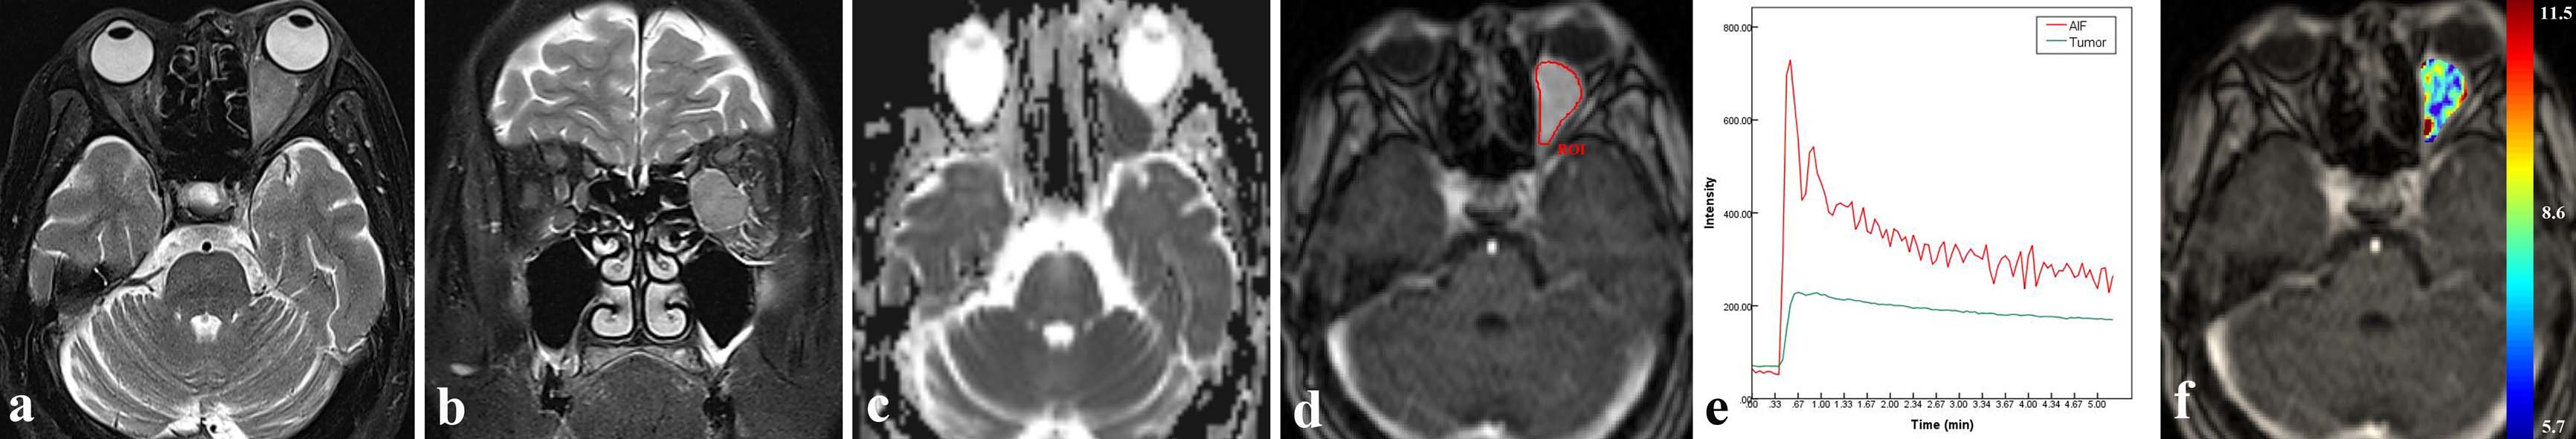
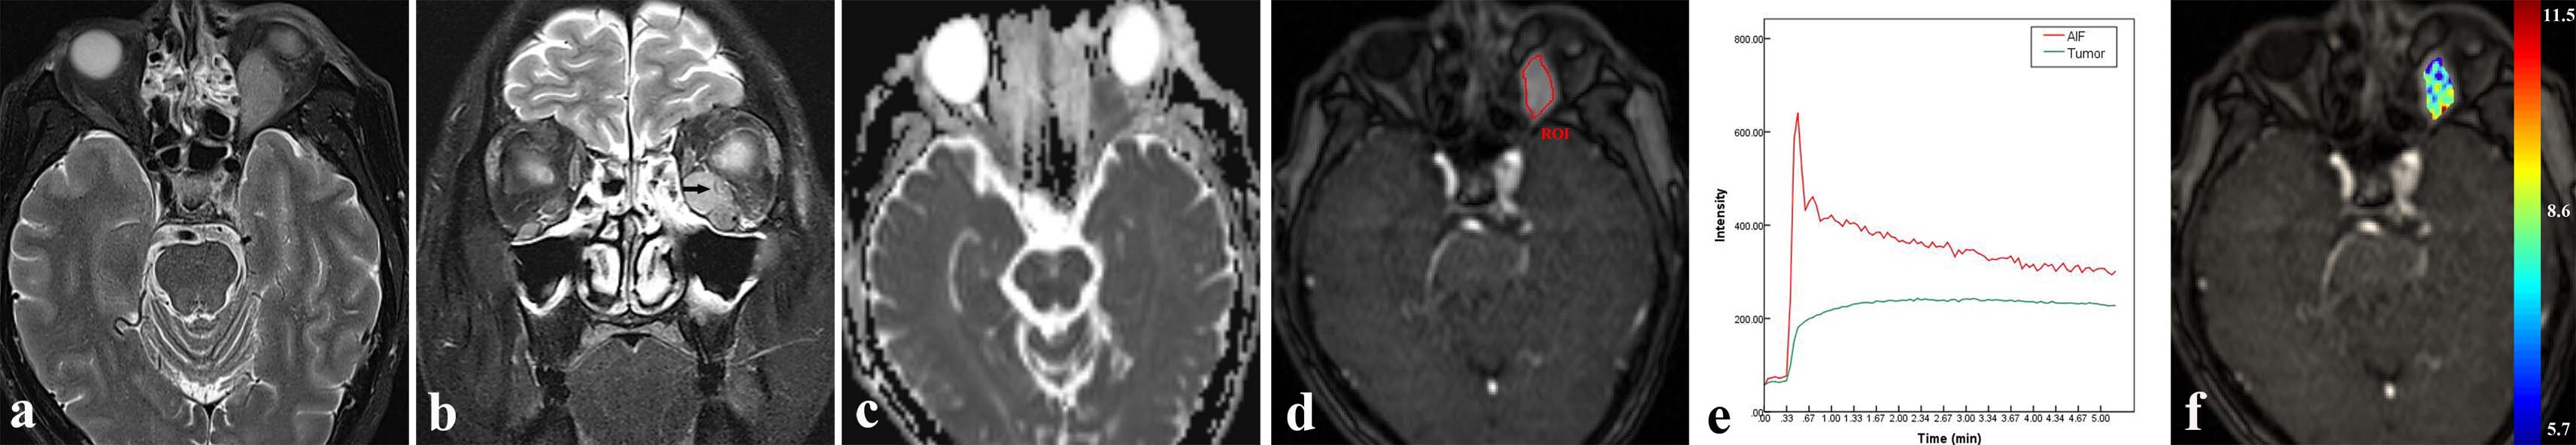
We applied multi-parametric magnetic resonance (MR) imaging techniques, including conventional MR, diffusion weighted imaging (DWI) and dynamic contrast enhance MR imaging (DCE-MRI) in the evaluation of orbital lymphoproliferative disorders (OLPDs).These three imaging techniques evaluated the morphologic, diffusion and perfusion characteristic,respectively. We aim to determine the optimal combination of parameters derived from 3T multi-parametric MR imaging for differentiating malignant from benign OLPDs.
Purpose
To determine the optimal combination of parameters derived from 3T multi-parametricMR imaging for differentiating malignant from benign OLPDs.Methods
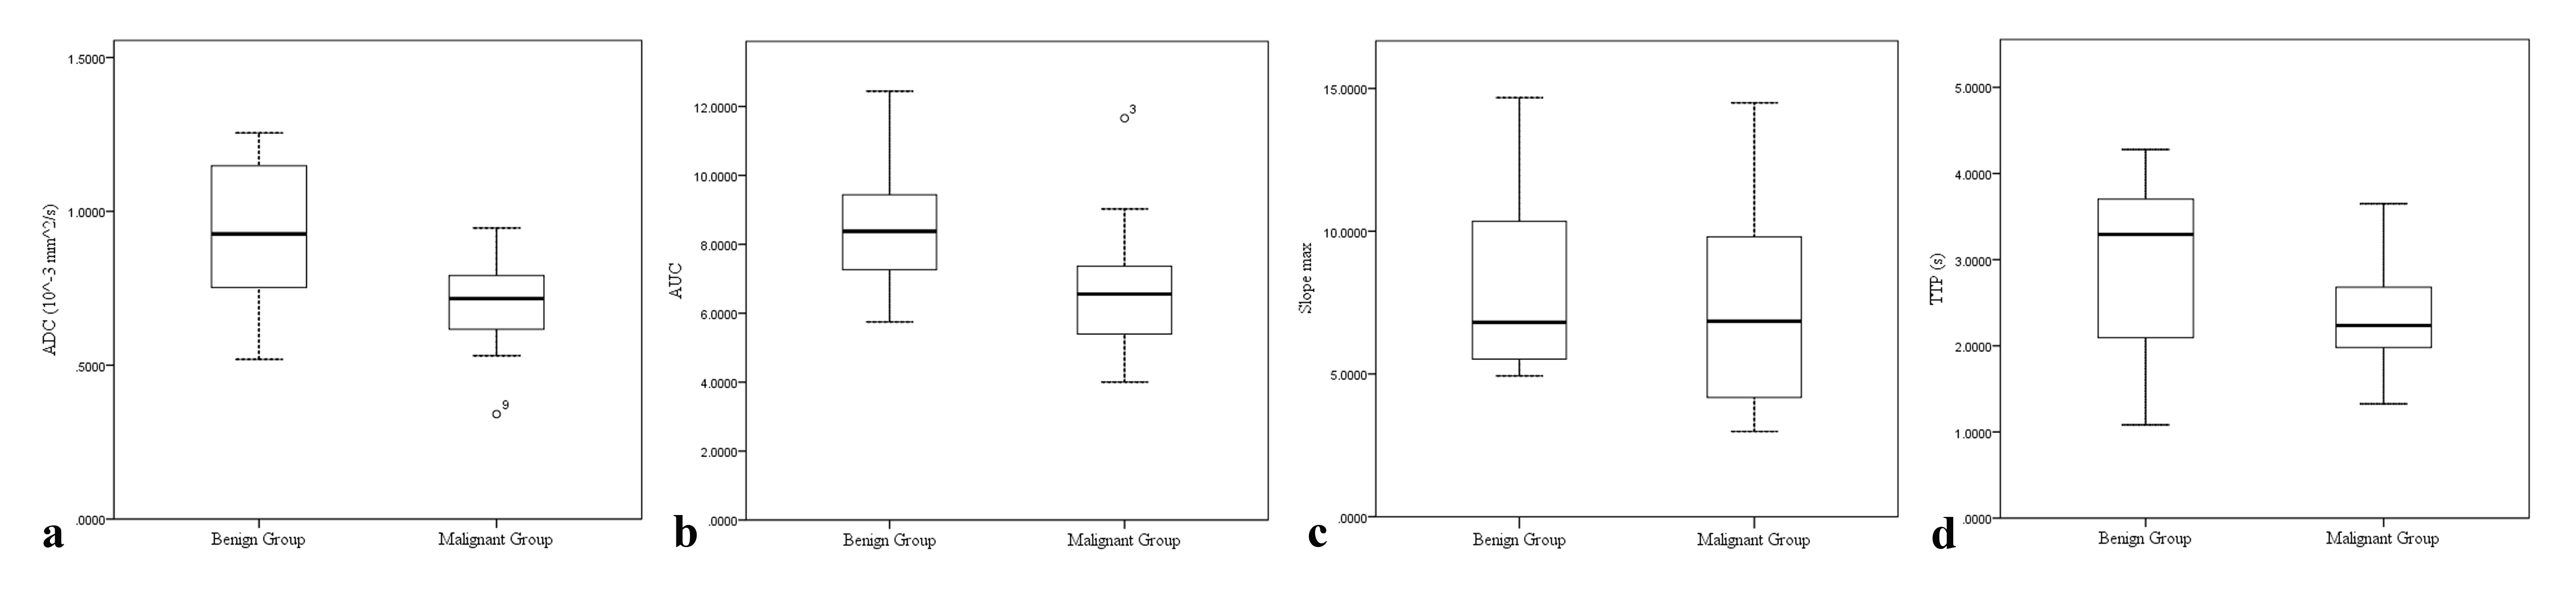
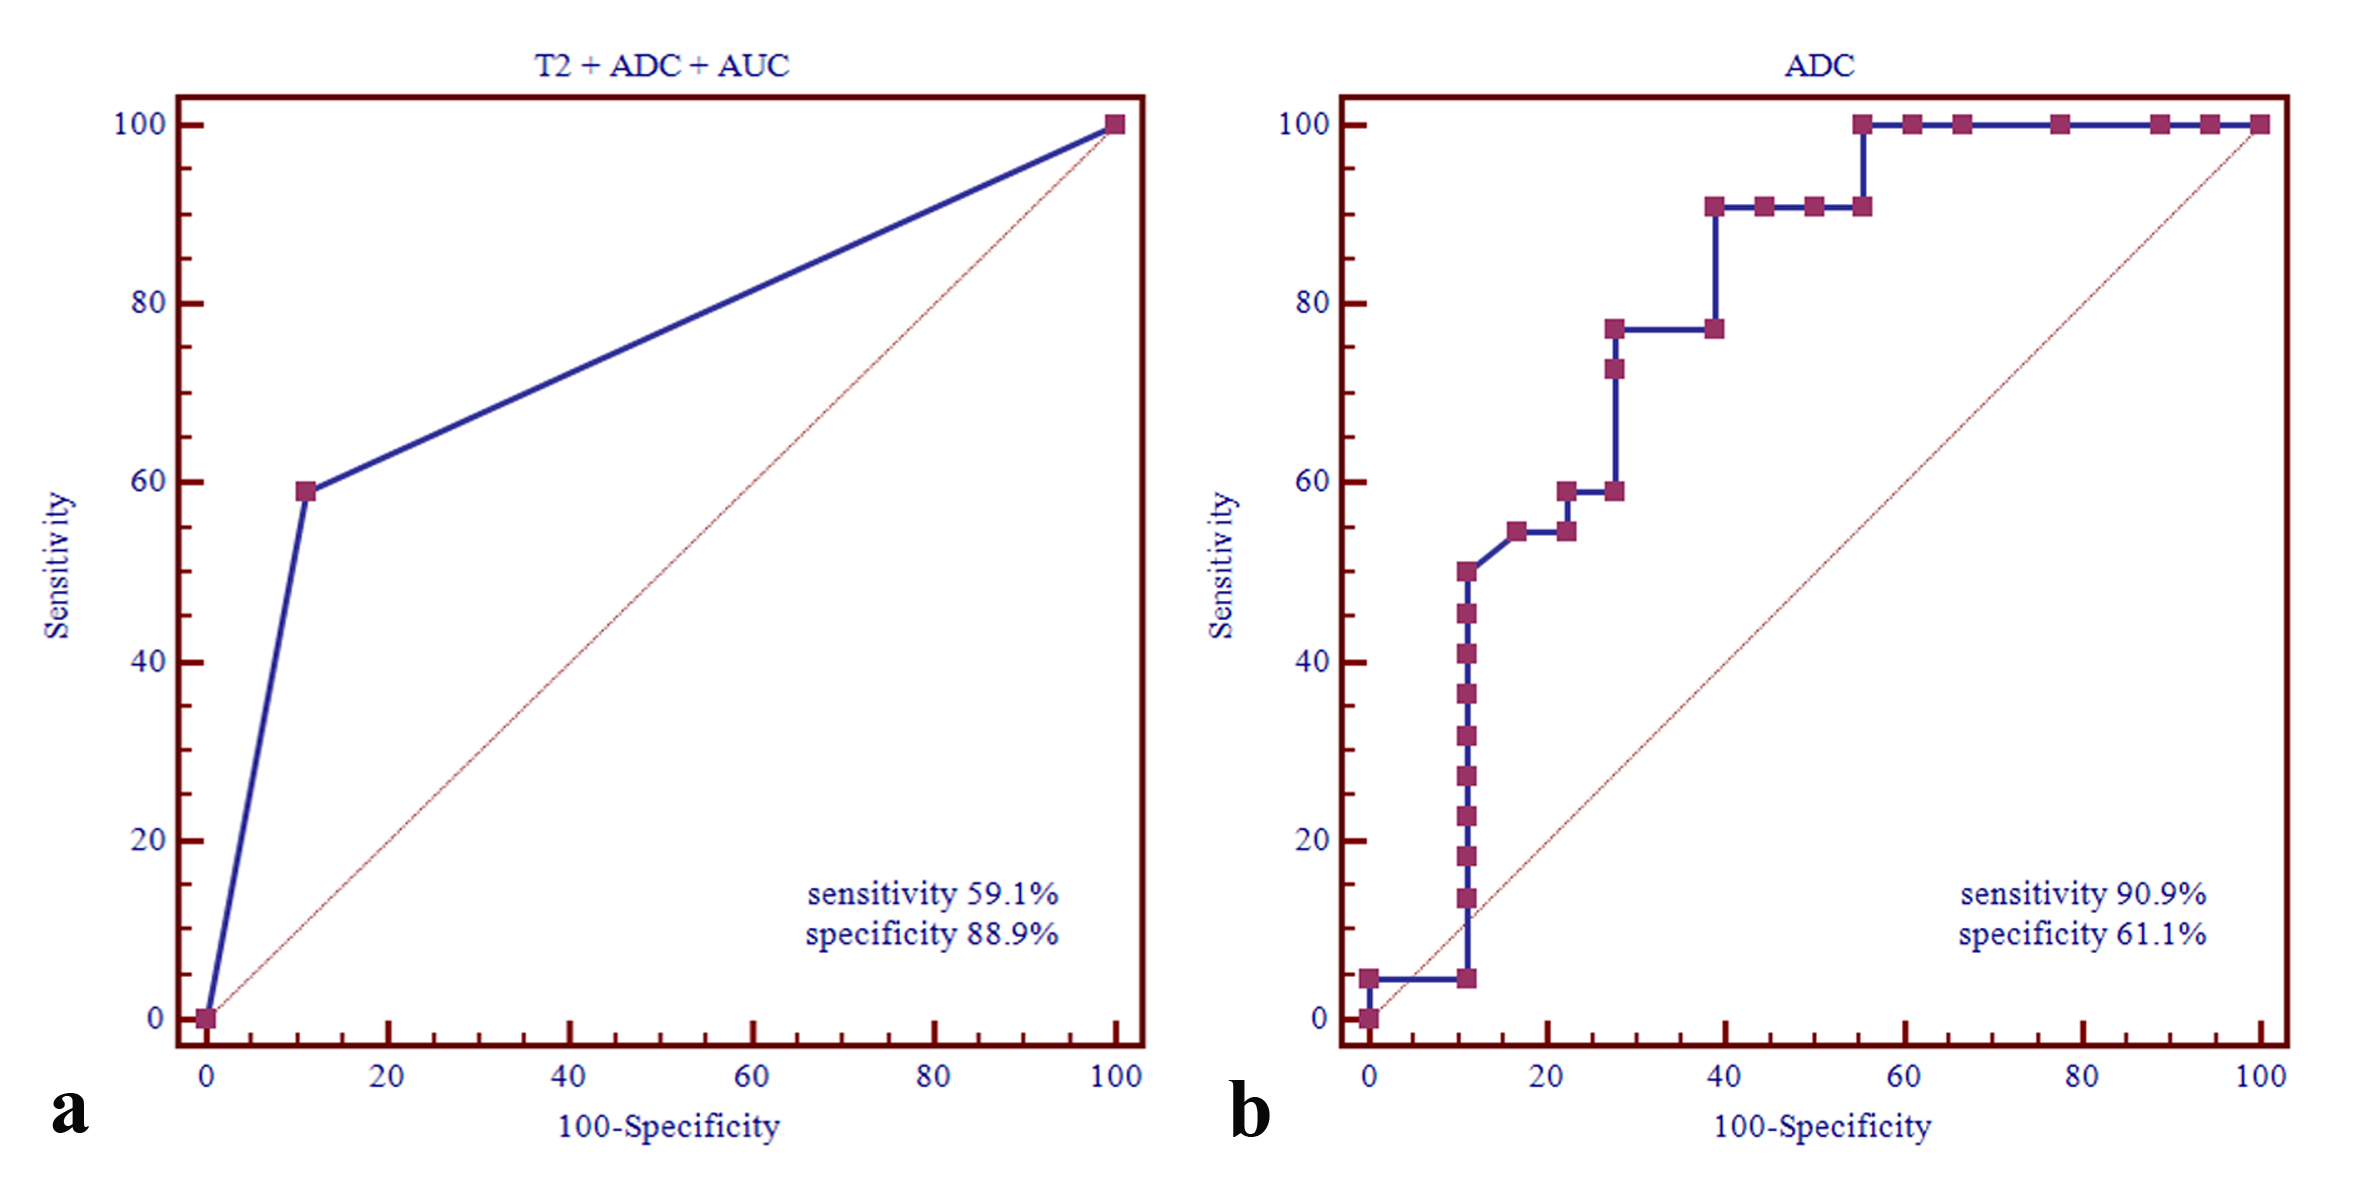
Forty patients with OLPDs (18 benign and 22 malignant) underwent conventional 3.0T MR, DW and DCE-MR imaging examination for pre-surgery evaluation. Conventional MR imaging features (including tumor laterality, shape, number of involved quadrants, signal intensity on T1WI and T2WI, flow void sign on T2WI, and findings suggestive of sinusitis) were reviewed, and multivariate logistic regression analysis was used to identify the most significant conventional MR imaging features. Apparent diffusion coefficient (ADC) and DCE-MR imaging derived parameters (area under curve, AUC; time to peak, TTP; maximum rise slope, Slopemax) were measured and compared between two groups. Receiver operating characteristic (ROC) curve analyses were used to determine the diagnostic ability of each combination that was established based on identified qualitative and quantitative parameters.Results
Multivariate logistic regression analysis showed that presence of flow void sign on T2WI significantly associated with benign OLPDs (P=0.034). Malignant OLPDs demonstrated significantly lower ADC (P=0.001) and AUC (P=0.002) than benign mimics. ROC analyses indicted that, ADC alone showed the optimal sensitivity (threshold value, 0.886×10⁻³ mm2/s; sensitivity, 90.9%), while combination of no presence of flow void sign on T2WI + ADC⩽0.886×10⁻³ mm2/s + AUC⩽7.366 showed optimal specificity (88.9%) in differentiating benign from malignant OLPDs.Conclusions
No presence of flow void sign on T2WI was the most significant conventional MR imaging feature that might help to diagnose malignant OLPDs. The specificity of differentiating work could be significantly improved by adding DW and DCE MR imaging to conventional MR imaging alone. Meanwhile, DW imaging alone demonstrated the optimal sensitivity in differentiating orbital benign and malignant OLPDs.Acknowledgements
NoReferences
1. Haradome K, Haradome H, Usui Y, et al. Orbital lymphoproliferative disorders (OLPDs): value of MR imaging for differentiating orbital lymphoma from benign OPLDs. AJNR Am J Neuroradiol 2014; 35:1976-1982.
2. Sepahdari AR, Aakalu VK, Setabutr P, Shiehmorteza M, Naheedy JH, Mafee MF. Indeterminate orbital masses: restricted diffusion at MR imaging with echo-planar diffusion-weighted imaging predicts malignancy. Radiology 2010; 256: 554-564.
3.Yuan Y, Kuai XP, Chen XS, Tao XF. Assessment of dynamic contrast-enhanced magnetic resonance imaging in the differentiation of malignant from benign orbital masses. Eur J Radiol 2013; 82:1506-1511.
Figures