2258
Gulf War Illness Patients Exhibit Impaired Connectivity in Multiple Brain Function Networks Consistent with Chronic Multi-Symptom Illness: A Resting State fMRI Study1Department of Radiology & Imaging Sciences, Emory University, Atlanta, GA, United States, 2University of Texas Southwestern Medical Center, Dallas, TX, United States, 3University of Houston Clear-Lake, Houston, TX, United States
Synopsis
Around 200,000 veterans (up to 32% of those deployed) of the 1991 Gulf War (GW) suffer from GW illness (GWI), which is characterized by multiple deficits in cognitive, emotion, somatosensory and pain domains. In this study we examined 22 GWI patients and 30 age-matched controls with resting state fMRI (rsFMRI) in order to map impairments in brain function networks in GWI with graph theory based advanced network analysis methods. Results show widespread impairments in functional connectivity of cognition, affective, somatosensory and pain processing brain function networks in GWI consistent with multi-symptom nature of the illness.
Introduction
Around 200,000 veterans (up to 32% of those deployed) of the 1991 Gulf War suffer from GW illness (GWI), which is characterized by multiple deficits in cognitive, emotion, somatosensory and pain domains 1-3. In this study we employed resting state fMRI (rsFMRI) to map impairments in brain function networks in GWI with advanced network analysis 4.Methods
22 GWI veterans (mean age 49.4 yrs.) and 30 healthy controls (NC) (mean age 49.8 yrs.), were scanned in a Siemens 3T MRI scanner using a 12-channel Rx head coil. Written informed consent was obtained from all participants in the protocol approved by the local Institutional Review Board. rsFMRI data were acquired with a 10-min whole-brain gradient echo EPI (TR/TE/FA = 2000/24ms/90°, resolution = 3mm x 3mm x 3.5mm). rsFMRI preprocessing steps included low-pass filtering (fc = 0.1Hz), detrending of fluctuations proportional to white matter and lateral ventricle signals, and censoring of volumes exhibiting > 0.2mm frame-to-frame motion 5. The rsFMRI data for each subject was then parcellated using the AAL ROI atlas 6 to construct a 116 node graph. The distance matrix of the graph was formed by the z-transformed cross-correlation coefficients (CC > 0) 5 between all nodes’ ROI-averaged grey matter voxel time-series. Network based statistics (NBS) 7 was then employed to yield significant (5000 permutations based multiple comparisons corrected p < 0.05) connected networks of edges which exhibit abnormally decreased or increased rsFC in GWI patients (t-test p < 0.025). Since AAL ROIs cover the whole extent of large cortical gyri (e.g. postcentral gyrus (PostCenGy)) or subcortical structures (e.g. thalamus), the above network analysis was repeated on a more densely parcellated 1094 node whole brain (WB1094) graph (consisting of 1024 uniformly sized cortical nodes 8, 6 striatal structures 9, 36 thalamic subunits 10 and 28 cerebellar ROIs 11) in order to examine brain networks with higher resolution.Results and Discussion
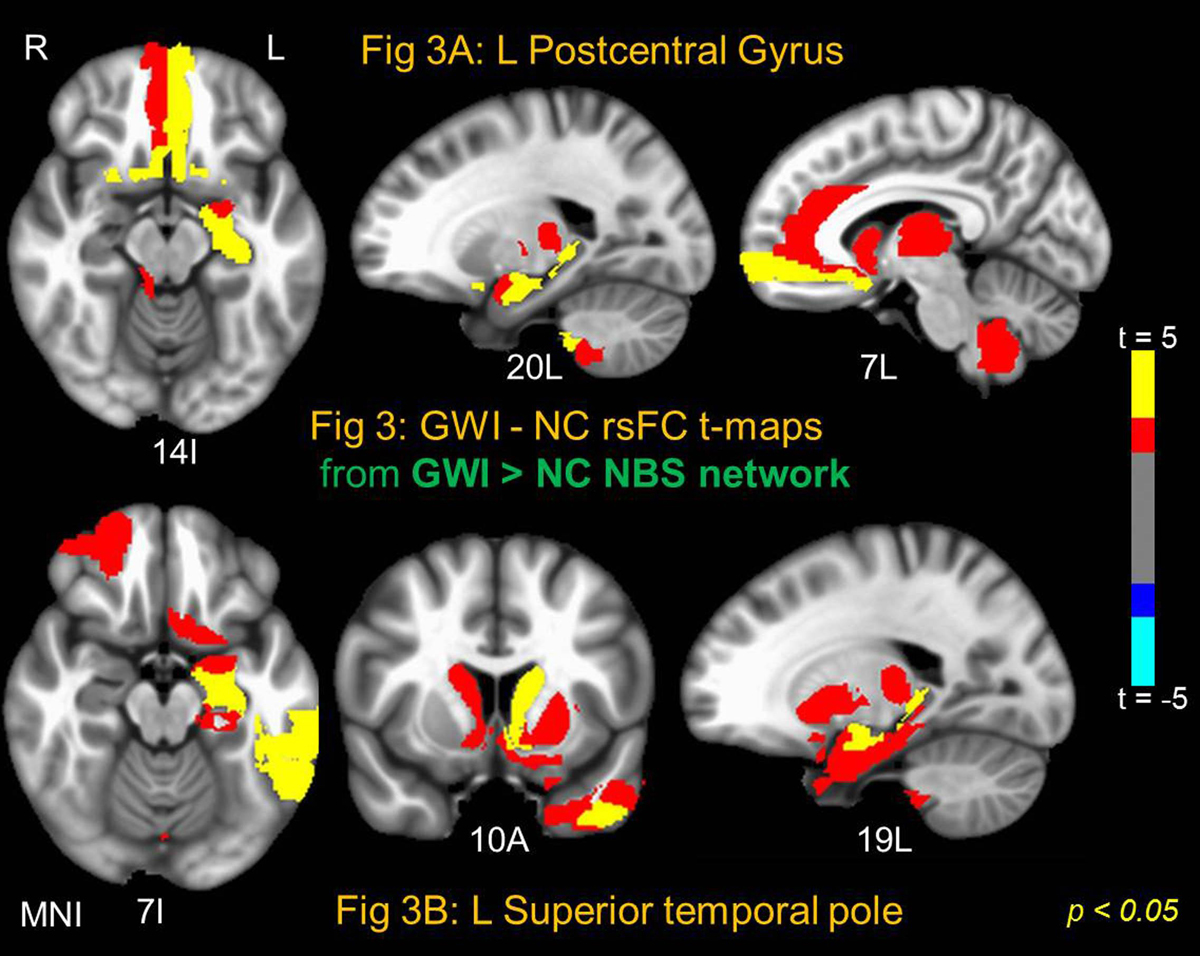
NBS yielded one significant (NBS p < 0.005) connected network comprised of 114 AAL nodes and 404 edges which exhibited abnormally increased rsFC in GWI compared to NC (GWI > NC); and one network (NBS p < 0.03) with 102 nodes and 228 edges (see Fig 1) which exhibited decreased rsFC in GWI (GWI < NC). The large extant of these networks indicate impairments consistent with the multi-symptom illness (e.g., GWI). In order to further probe the brain regions which exhibited most impaired/abnormal rsFC in GWI within these two networks, 9 different binary distance graphs were formed for each NBS network (GWI > NC and GWI < NC) by thresholding the corresponding t-statistic matrix at different p-values in the range 0.025-0.0005. The mean of the 9 DCs (DCAUC) was employed to assess the nodes with most impaired/abnormal rsFC in GWI. Fig 2 and Fig 3 show the GWI-NC t-test maps corresponding to two nodes each which possess the highest DCAUC in the GWI < NC (Fig. 2) and GWI > NC (Fig 3) NBS network graphs respectively. Right PostCenGy (Fig 2A) exhibited significantly reduced rsFC (in GWI compared to NC) with AAL nodes comprising somatosensory regions: e.g., insula, primary and secondary somatosensory cortices and superior temporal gyrus. This is consistent with somatosensory deficits seen in GWI symptoms. On the other hand left PostCenGy (Fig 3A) and left superior temporal pole (Fig 3B) exhibited abnormally increased rsFC in GWI with AAL nodes that constitute regions involved in pain perception and limbic functions: e.g., amygdala, olfactory cortex, anterior cingulate, striatum and thalamus. This is consistent with chronic pain and mood disorders seen in GWI 1-3. Finally right thalamus (Fig 2B) exhibited decreased rsFC in GWI with frontal and striatal areas involved in regulation of emotion and pain as well as in performing executive functions 12-14. This is consistent with deficits in emotion and cognition domains seen in GWI 1-3. Employment of a more densely parcellated graph (WB1094) did not yield increased specificity in the networks obtained with the NBS method. NBS yielded one network each for the GWI > NC and GWI < NC graphs, both covering almost all WB1094 nodes. The WB1094 centrality results were consistent with those obtained with AAL parcellation.Conclusion
Results show widespread impairments in brain rsFC networks in GWI consistent with multi-symptom nature of the illness. NBS may not be an optimal tool to examine impairments in brain illnesses in which multiple brain functions are impaired since simultaneous impairment in multiple brain networks can lead to the NBS algorithm aggregating them into one large connected network through brain regions (nodes) which are common to the different impaired brain networks.Acknowledgements
This work was supported by the Office of Assistant Secretary of Defense for Health Affairs, through the Gulf War Illness Research Program under Award No. W81XWH-16-1-0744. Opinions, interpretations, conclusions and recommendations are those of the author and are not necessarily endorsed by the Department of Defense.
References
1. Binns JH., et al. (2014), Report of Research Advisory Committee on Gulf War Veterans’ Illnesses’, In: Affairs DoV, editor, Boston, MA, U.S. Government Printing Office
2. Haley RH., et al. (1997), ’Is there a Gulf War Syndrome? Searching for syndromes by factor analysis of symptoms’, JAMA, vol. 277, no.3, pp 215-222.
3. Toomey R., et al., (2009), ’ Neuropsychological functioning of U.S. Gulf War veterans 10 years after the war.’ J Int Neuropsychol Soc., vol.15, no.5, pp 717-729.
4. Bullmore E., et al. (2009), ’Complex brain networks: graph theoretical analysis of structural and functional systems.’ Nat Rev Neurosci., vol.10, no.3, pp 186-198.
5. Power JD., et al. (2014), ’ Methods to detect, characterize, and remove motion artifact in resting state fMRI.’ Neuroimage, vol.84, pp 320-341.
6. Tzourio-Mazoyer N., et al. (2002), ’Automated anatomical labeling of activations in SPM using a macroscopic anatomical parcellation of the MNI MRI single-subject brain.’ Neuroimage, vol.15, no.1, pp 273-289.
7. Zalesky A., et al. (2010), ’Network-based statistic: identifying differences in brain networks.’ Neuroimage, vol.53, no.4, pp 1197-1207.
8. Zalesky A., et al. (2010), ’Whole-brain anatomical networks: Does the choice of nodes matter?’ Neuroimage, vol.50, no.4, pp 970-983.
9. Tziortzi A, et al. (2014), ’ Connectivity-Based Functional Analysis of Dopamine Release in the Striatum Using Diffusion-Weighted MRI and Positron Emission Tomography’. Cereb. Cortex, vol.24, no.5, pp 1165-1177.
10. Krauth A., et al. (2010), ’ A mean three-dimensional atlas of the human thalamus: generation from multiple histological data.’ Neuroimage. Vol.49, no.3, pp 2053-62.
11. Diedrichsen J., et al. (2009), ’ A probabilistic MR atlas of the human cerebellum.’ Neuroimage. Vol.46, no.1, pp 39-46.
12. Price, D. (2000), ’Psychological and neural mechanisms of the affective dimension of pain.’ Science, vol.288, pp 1769-1772.
13. Graham, J. (2013), ’Meta-analytic evidence for neuroimaging models of depression: state or trait?’ Journal of affective disorders, vol.151, no.2, pp 423-431.
14. Alvarez J.A. (2006), ’ Executive function and the frontal lobes: a meta-analytic review.’ Neuropsychol Rev., vol.16, no.1, 17-42.
Figures