2251
Characteristics of Cortical and Subcortical Abnormalities in Pediatric Attention Deficit Hyperactivity Disorder patients1Huaxi MR Research Center (HMRRC), Department of Radiology, West China Hospital of Sichuan University, Chengdu, People's Republic of China, 2Department of Psychiatry, West China Hospital of Sichuan University
Synopsis
The current study combine the analysis of the cortical measures and subcortical structures’ volume to evaluate the cerebral structure alterations in a relative large drug-naive ADHD sample. In addition, we also invest the anatomical–age correlation between two groups. Our findings (i) highlighted the crucial role of the frontostriatal circuits in the pathophysiology of ADHD, (ii) indicated the abnormality in neural development trajectory in ADHD.
Purpose
Attention deficit hyperactivity disorder (ADHD) is a neurodevelopmental disorder defined as age-inappropriate problems with inattention, impulsivity, and hyperactivity and affects 5% to 7% of children worldwide 1. Explore the neural mechanisms with MRI may help deepen our understanding of this disorder and uncovered neurobiological alterations associated with ADHD. However, previous studies on brain structural changes in ADHD were principally limited to volume measurements 2. Thus, in current study we aimed to examine the ADHD related alterations in cortical volume, thickness, and surface area as well as volume of 14 subcortical structures. Moreover, we also assess the correlation between cortical morphometric changes related to the age, attempting to invest whether there would be a different anatomical–age correlation between two groups.
Method
All subjects were well informed about the goal and procedures of this experiment and written informed consent was obtained from the guardians of all the subjects. A total of 53 drug-naive ADHD patients and 53 age-(ADHD=10.43±2.14; HC=10.85±2.32; t=-0.956 P=0.341), sex-(all male subjects) and handedness-(all right-handed) matched healthy controls were recruited. All participants underwent magnetic resonance (MR) imaging with a 3-T scanner. FreeSurfer software was used to provide measures of cortical thickness, volume and surface area at each vertex. Fourteen subcortical gray matter structures’ volume (thalamus, nucleus accumbens, hippocampus, caudate, putamen, pallidum, and amygdala) were also calculated using FreeSurfer’s automatic segmentation pipeline. Group differences in cortical thickness, volume, surface area and the correlation between cortical morphometric measures and the age were examined on the surface maps vertex by vertex using a least squares general linear model with the intracranial volume and age as covariates. Using a Monte Carlo null-z simulation with 10 000 iterations to correct for multiple comparisons. The statistical threshold of P < 0.05 was used to determine significance. Averaged data from the regions with different measures-age correlation between groups were extracted in each individual to examine correlations between the measures and age in each group respectively. Subcortical volumes were compared between groups using a general linear model with intracranial volume and age as covariates too.Results
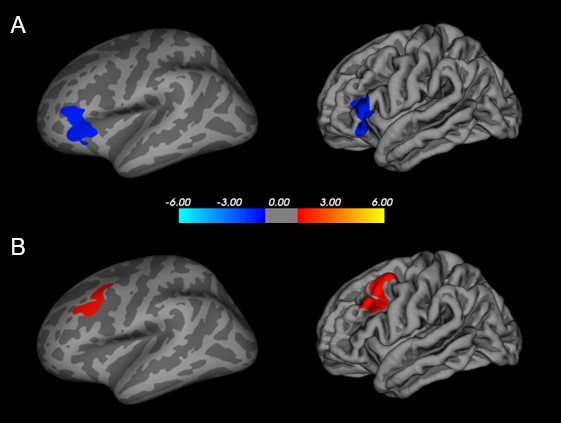
Decreased cortical surface area was found in left inferior frontal cortex(pars triangularis) and increased cortical volume was found in left middle frontal cortex(caudal middle frontal) (Table 1; Figure 1A/1B; cluster corrected p<.05) in the patients with ADHD compared to healthy controls. No significant differences were detected in cortical thickness between the two groups.
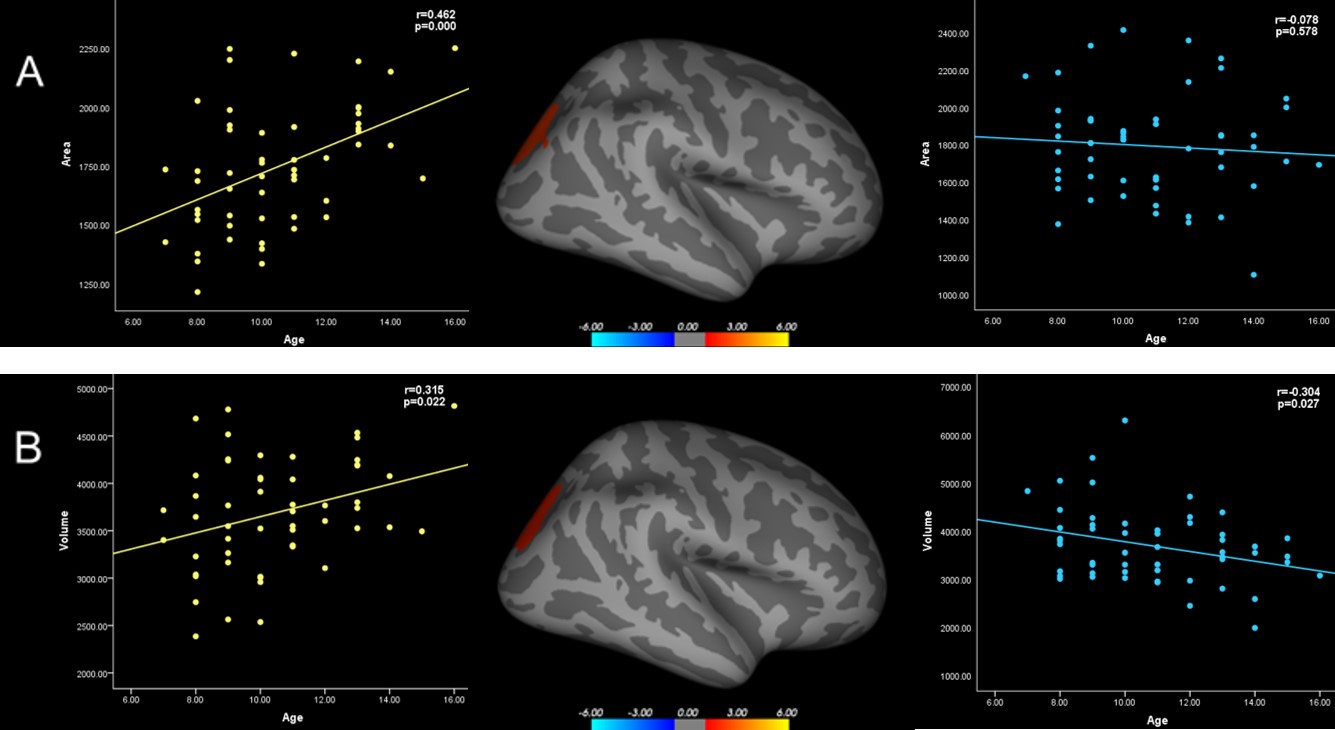
As for the correlation between cortical morphometric measures and the age, we have found different area-age correlation and volume-age correlation between the two groups in the right superior parietal cortex (Table 3; Figure 2A/2B; cluster corrected p<.05). In ADHD patients, age are positively correlated with surface area in the right superior parietal cortex (r = 0.462; P =0.000), while there is no such trend in the healthy controls. Similar, age also positively correlated with cortical volume in the right superior parietal cortex(r = 0.315; P =0.022) in ADHD, while the age of healthy controls showed a negative correlated with the same region(r = -0.304; P = .027).
When examining group differences for subcortical volumes, we found that patients with ADHD only showed reduced volume in right putamen (F=4.491, p=0.037) (Table 2). And no significant differences were detected in other nucleus between the two groups.
Discussion
In current study, we revealed characteristic changes in ADHD cortex and subcortical structures which demonstrated as decreased surface area in left inferior frontal cortex, increased cortical volume in left middle frontal cortex and reduced volume in the right putamen. All these regions are located in frontostriatal circuits which involved in attention processing, inhibition control and executive functions3.
In addition, we also found significant group difference related to age in right superior parietal cortex through both cortical surface area and volume. These findings suggested the abnormality in neural development trajectory in ADHD.
Acknowledgements
This study was supported by the National Natural Science Foundation (Grant No. 81671669 and 81171488)References
1. American Psychiatric Association, 2000.
2. Sasha M, Marin E, et al. Abnormal Cerebral Cortex Structure in Children with ADHD. Hum Brain Mapp. 2009; 30(1): 175–184.
3. Eduardo F. Moving towards causality in attention-deficit hyperactivity disorder: overview of neural and genetic mechanisms. Lancet Psychiatry. 2016; 3(6):555-67.
Figures
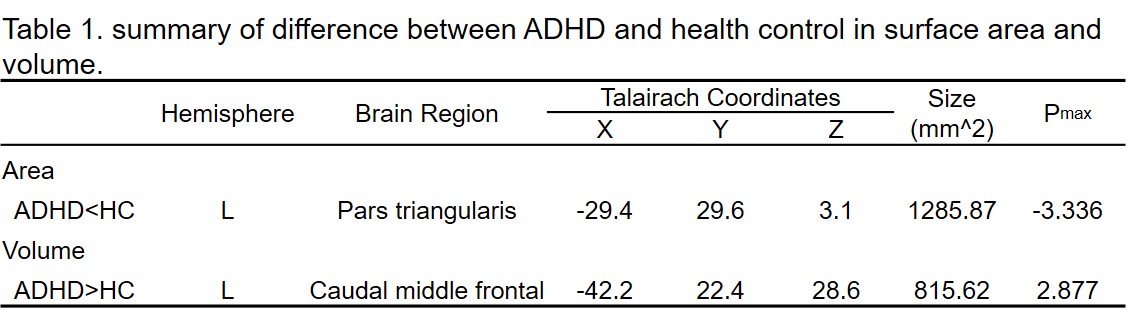
Table 1. summary of difference between ADHD and health control in surface area and volume.
Note: ADHD=attention deficit hyperactivity disorder; HC=healthy control; L=Left; R=Right.
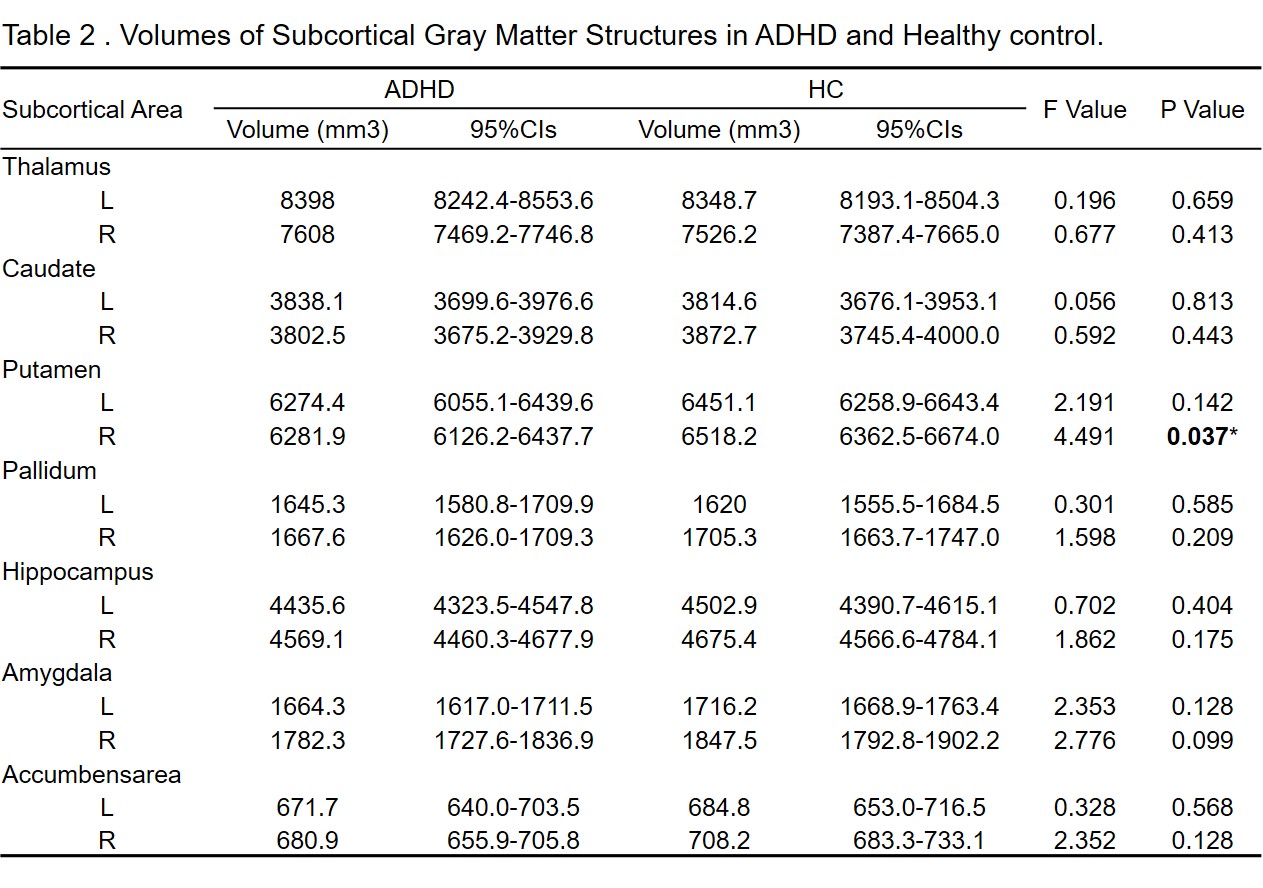
Table 2 . Volumes of Subcortical Gray Matter Structures in ADHD and Healthy control.
Note: ADHD=attention deficit hyperactivity disorder; HC=healthy control; L=Left; R=Right. 95%CIs=95% confidence intervals; Bold=p < .05, * =Remained significant with Monte Carlo correction for multiple corrections.
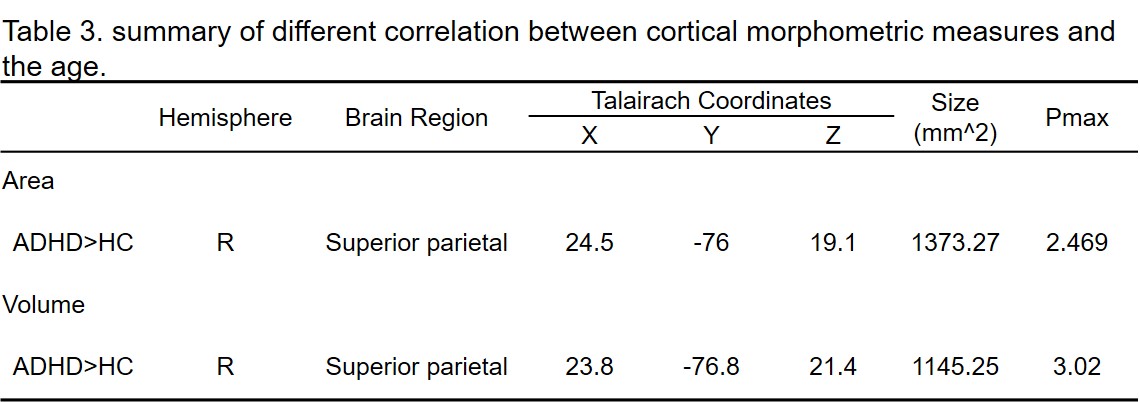
Table 3. summary of different correlation between cortical morphometric measures and the age.
Note: ADHD=attention deficit hyperactivity disorder; HC=healthy control; L=Left; R=Right.