2250
Distortions in Dynamic Functional Connectivity in Autism Spectrum Disorders1Department of Psychology, University of Alabama at Birmingham, Birmingham, AL, United States, 2AU MRI Research Center, Department of Electrical and Computer Engineering, Auburn University, Auburn, AL, United States, 3Department of Psychiatry and Biobehavioral Sciences, University of California Los Angeles, Los Angeles, CA, United States, 4Department of Psychology, Auburn University, Auburn, AL, United States, 5Alabama Advanced Imaging Consortium, Auburn University and University of Alabama Birmingham, Birmingham, AL, United States
Synopsis
Autism spectrum disorders (ASD) are neurodevelopmental disorders that have been associated with disruptions in brain connectivity. Using resting-state fMRI, we assessed the variability of whole-brain connectivity in individuals with ASD. Using a variable, sliding-window technique to calculate the variance of dynamic functional connectivity (vDFC), we show increased vDFC in ASD as compared to typically developing controls among prefrontal regions and within the salience network. Measures of vDFC were significantly correlated with measures of social functioning among all subjects. This work is significant as it suggests increased neural noise and disorganization in ASD.
Introduction
Disruption in neural connectivity has been an emerging theme in the neurobiology of ASD1,2. Nevertheless, limited attention has been given to examining how brain connectivity varies across time, a measure known as dynamic functional connectivity (DFC), which provides the variation in connectivity across time3. Traditional connectivity measures provide a single connectivity value for the correlation between a pair of brain regions for an experimental condition or for the entire scan. In fact, functional connectivity varies according to task demands, and across time3. DFC can provide a measure of underlying neural variability in ASD, which could explain behavioral variability and cognitive flexibility4. Objective: To examine the variations in DFC across time in a relatively large sample of ASD and typically developing (TD) individuals.Methods
Results and Discussion
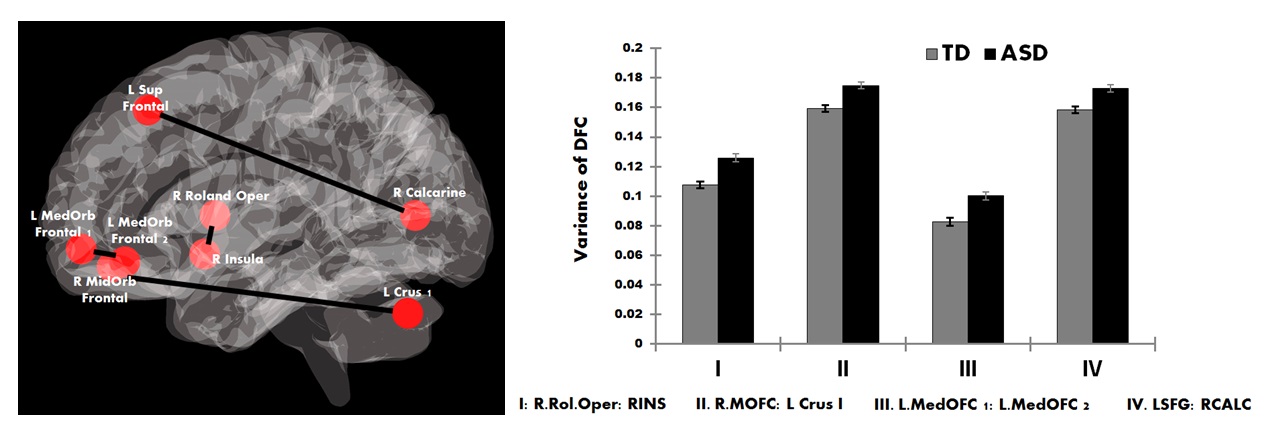
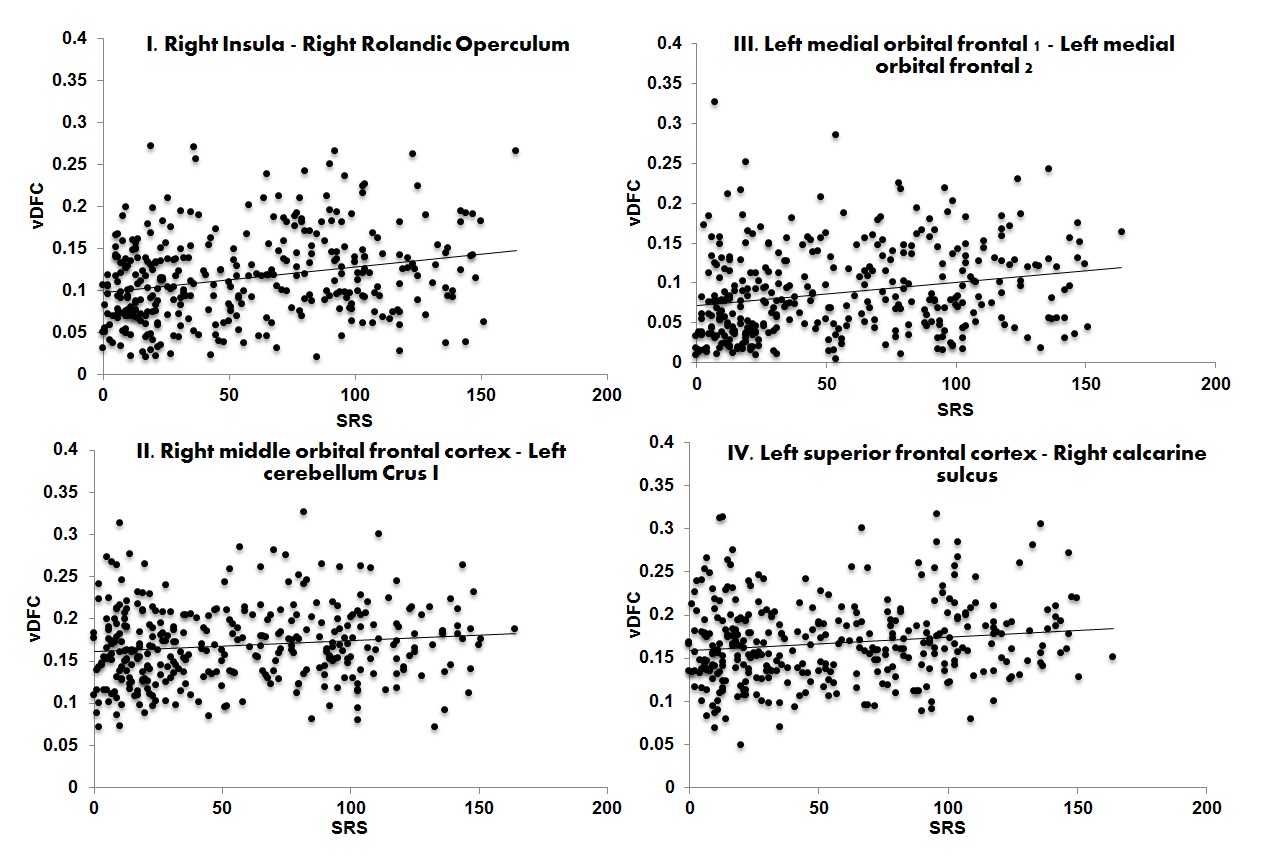
Participants with ASD showed increased variability in DFC (higher vDFC) compared to controls in four connections (alpha = 0.05, Bonferroni corrected): 1) Right insula ↔ Right rolandic operculum; 2) Right middle orbital frontal cortex ↔ Left cerebellum crus I; 3) Left medial orbital frontal cortex 1 ↔ Left medial orbital frontal cortex 2; 4) Left superior frontal cortex ↔ Right calcarine sulcus (see Figure 1). FSIQ or VIQ were not significantly correlated with vDFC of the significant connections. SRS scores (available only for a subset of the sites: ASD = 260; TD = 381) were positively correlated with all significant vDFC connections: 1) Right insula ↔ Right rolandic operculum (r(345)=.25, p<.001); 2) Right middle orbital frontal cortex ↔ Left cerebellum crus I (r(344)=.12, p<.05); 3) Left medial orbital frontal cortex 1 ↔ Left medial orbital frontal cortex 2 (r(344)=.23, p<.001); 4) Left superior frontal cortex ↔ Right calcarine sulcus (r(345)=.15, p<.01) (see Figure 2). Three of the four significant connections involved prefrontal regions, while the fourth was the anterior insula. It has been suggested that frontal lobe local connectivity in ASD is “excessive, disorganized, and inadequately connected”, and long-distance connectivity is poorly synchronized10. The insula is a key node of the salience network (SN). The SN is altered in ASD and plays an important role in paying attention to relevant stimuli; SN also controls switching between the default mode and executive networks11. The disorganization of frontal and SN connectivity may importantly impact executive functions and filtering of relevant social environmental stimuli in ASD. More generally, the findings of this study contribute to the evidence of increased noise and intra-subject neural variability in ASD. Increased neural noise could create an unpredictable perceptual environment, resulting in abnormal social responses characteristic of autism12. This is significant, as the magnitude of vDFC was positively correlated with social functioning among all subjects. Previous findings of ASD connectivity differences may be better explained by impairments in connectivity across time4.Acknowledgements
No acknowledgement found.References
1. Maximo et al. (2014). The Implications of Brain Connectivity in the Neuropsychology of Autism. Neuropsychology Review,24, 1, 16–31. doi:10.1007/s11065-014-9250-0
2. Just et al. (2012). Autism as a neural systems disorder: A theory of frontal-posterior underconnectivity. Neuroscience & Biobehavioral Reviews, 36, 4, 1292–1313. doi:10.1016/j.neubiorev.2012.02.007
3. Hutchison et al. (2013). Dynamic functional connectivity: Promise, issues, and interpretations. NeuroImage, 80, 360–378. http://doi.org/10.1016/j.neuroimage.2013.05.079
4. Jia et al. (2014). Behavioral Relevance of the Dynamics of the Functional Brain Connectome. Brain Connectivity, 4(9), 741– 759. http://doi.org/10.1089/brain.2014.0300
5. DiMartino et al. (2014). The autism brain imaging data exchange: towards a large-scale evaluation of the intrinsic brain architecture in autism. Molecular Psychiatry, 19, 6, 659–667. doi:10.1038/mp.2013.78
6. Yan et al. (2010). DPARSF: a MATLAB toolbox for “pipeline” data analysis of resting-state fMRI. Frontiers in Systems Neuroscience, 4, 13. doi:10.3389/fnsys.2010.00013
7. Wu G.R. et al. (2013). A blind deconvolution approach to recover effective connectivity brain networks from resting state fMRI data. Medical Image Analysis, 17 (3): 365-374. doi: 10.1016/j.media.2013.01.003
8. Craddock et al. (2012). A whole brain fMRI atlas generated via spatially constrained spectral clustering. Human Brain Mapping, 33, 8, 1914–1928. doi:10.1002/hbm.21333
9. Rangaprakash et al. "Static and Dynamic Functional Connectivity Impairments in Concussed Soldiers with and without PTSD," Proceedings of the Annual Meeting of the International Society for Magnetic Resonance in Medicine, vol. 23, p. 4402, 2015.
10. Courchesne et al. (2005). Why the frontal cortex in autism might be talking only to itself: local over-connectivity but long-distance disconnection, 225–230. http://doi.org/10.1016/j.conb.2005.03.001
11. Menon. (2011). Large-scale brain networks and psychopathology: A unifying triple network model. Trends in Cognitive Sciences, 15(10), 483–506. http://doi.org/10.1016/j.tics.2011.08.003
12. Dinstein et al. (2015). Neural variability: friend or foe? Trends in cognitive sciences,19, 6, 322–8. doi:10.1016/j.tics. 2015.04.005
Figures