2248
Eigenvector centrality mapping evaluating disease progression in Parkinson disease :a longitudinal study12nd Affiliated Hospital, Zhejiang University School of Medicine, hangzhou, People's Republic of China
Synopsis
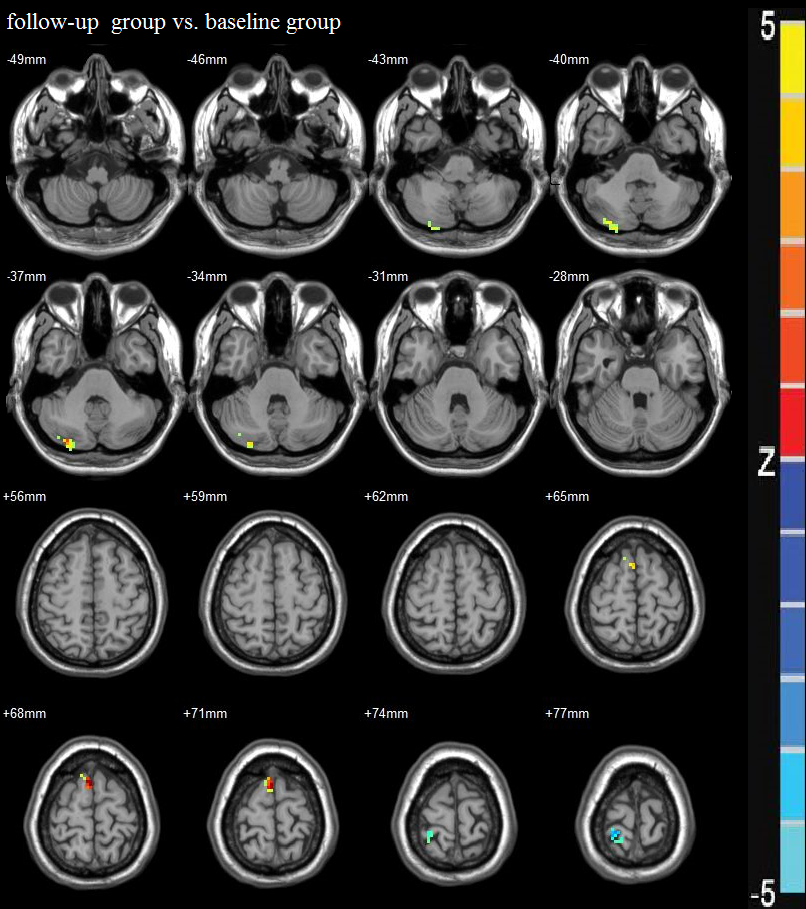
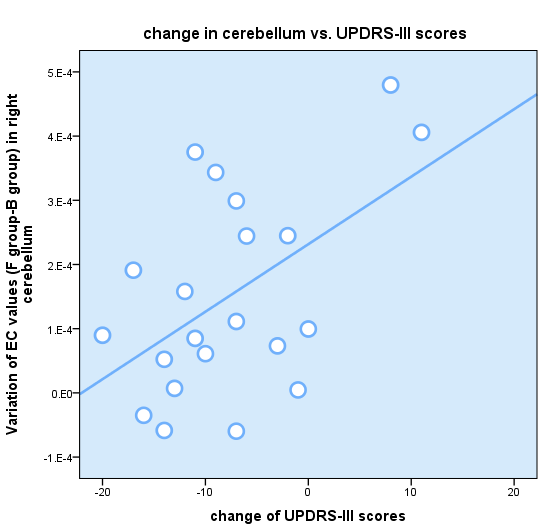
Studied longitudinally 21 PD patients using Eigenvector centrality mapping,discovered significantly decreased EC values in right postcentral gyrus, and increased EC values in right cerebellum, right supplementary motor area (right SMA) as compared to B group. right postcentral gyrus in F group is negativelycorrelatedwithhoehn and yahr staging( HY) stage (r =-0.48, p < 0.05). Variation of EC values (F group-B group) in right cerebellum is positively correlated with changeofUPDRS-III scores. The current study demonstrated that deterioration and compensation exists through different circuit along with PD progression.
INTRODUCTION, METHODS, RESULTS, DISCUSSION, CONCLUSIONS
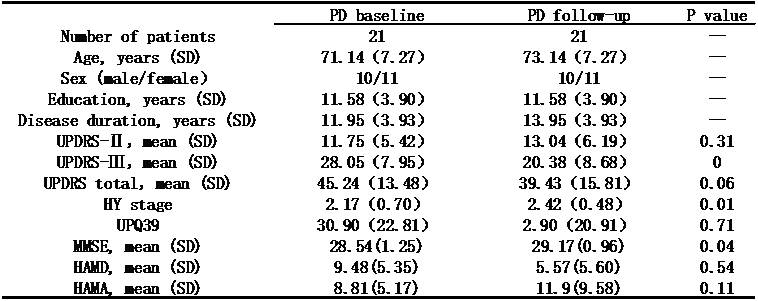
INTRODUCTION:Parkinson’s disease (PD) is a progressiveneurodegeneration, which owns a complex pathogenesis around the brain. Though many cross-sectional studies tried to explain its progression, longitudinal studies are still necessary to observe the dynamical cerebral alterations. In the present study, we aimed to investigate the longitudinalalterations of functional connectivity within whole brain in a cohort of follow-up PD patients. METHODS:A total of 106 individuals were scanned 3D T1 structural imaging and resting functional MRIfor baseline visit and finally 21 PD patients were accepted longitudinal evaluation after 2 years. Eigenvector centrality mapping (ECM) was used to identify brain network hub organization between follow-up PD group (F group) and baseline group (B group);. In addition, grey matter volume (GV) was extracted from the regions showing significantalterations in ECM to detect the underlying structural substrates of cerebral dysfunction. Pared t-tests were performed in IBM SPSS 19.0. RESULTS: Clinical and demographic data about 21 patients were listed at table 1. In Particular,most PD patient show significantlydecreased in UPDRS-III scores after 2 years.Fgroupshowed significantly decreased EC value in right postcentral gyrus, and increased in right cerebellum, right supplementary motor area(right SMA) as compared to B group(p=0.005, cluster=17,uncorrected)(figure1). No significant GV alterations were observed between two groups. Correlation analysis revealed that right postcentral in F group is negativelycorrelatedwith HY stage (r =-0.48, p < 0.05). Variation of EC values (F group-B group) in right cerebellum is positively correlated withchange ofUPDRS-III scores(r =539, p < 0.05) (figure 2 ). There were no correlations between other areas. DISCUSSION:The present study mainlyfind that PD patients show significantlydecreased EC valuein right postcentral and increased functional connectivity in right cerebellum and right SMA over time, EC value and right postcentral gyrus in F group and change of EC value in right cerebellumwere correlate with disease severity. The cerebellum is knownforits role in coordinating motion1. Our study foundF group show hyper-connectivity in right cerebellumcompared to B group, which was interpreted as compensatory for the reduced motor output stemming over time. Cerebellumalterations have been discovered in many studies from a cross-sectional perspective2.Moreover, our correlation analysis also confirms a direct cerebellar involvement in PD progression. Beside,the present study discovered increasedfunctional connectivityin right SMA when F group vs. B group. Consistent with our findings, Delong Zhang3 has found SMA increased functional connectivity in the PD group compared with the NC,performing a seed-based functional connectivity analysis.In generally,our research expanded previous findings by demonstrating longitudinally that compensationexists through cerebellum-cortex -circuit along with PD progressionwithout a priority assumption. In current study, F group show to alleviate the symptoms of PD motion (UPDRS-III scores) may be due to compensation enhancements of cerebellum and SMA for motorimpairment. The right postcentral gyrus plays a role in information processing, because thatits functional connectivity and structural is related to other brain areas.It has been reported to be associated with the default mode network (DMN), whichmaybe highly integrated with depression in recent years4. The present study discovered functional connectivity decreased in right postcentral gyrus over time, and correlation analysis revealed that right postcentral gyrus in F group is negatively correlated with HY stage. We speculate that decreased ECM value of the right postcentral gyrus is a contributing factor for pathophysiological destroy in PD patients. We did not observe structural alteration in our patients. Studies5demonstrated that cerebral functional changes before structure. Therefore, functional connectivity could be sensitive to detect brain dysfunction of PD. We should clarify that present researchdidn’t included healthy controls, because thatwe focus on longitudinal changesof brain activity in PD patients. Studies with longitudinal data from normal aging would be helpful to deepen the difference of PD progression from normal aging process. CONCLUSIONS:We provide evidence using Eigenvector centrality mapping for deterioration in right postcentral gyrus and compensation in right cerebellum, right SMA in PD over a 2-year period of time.ECM may be a good tool to Identify the nature of early progression in PD.Acknowledgements
No acknowledgement found.References
1. Vervoort, G., et al., Dual-task-related neural connectivity changes in patients with Parkinson' disease. (1873-7544 (Electronic)).
2. Zhang, J.R., et al., Functional Connectivity of Vim Nucleus in Tremor- and Akinetic-/Rigid-Dominant Parkinson's Disease. (1755-5949 (Electronic)).
3. Zhang, D., et al., Widespread increase of functional connectivity in Parkinson's disease with tremor: a resting-state FMRI study. (1663-4365 (Linking)).
4. Lou, Y., et al., Altered brain network centrality in depressed Parkinson's disease patients. (1531-8257 (Electronic)).
5. Sun, H., P. Seres, and A.H. Wilman, Structural and functional quantitative susceptibility mapping from standard fMRI studies. LID - 10.1002/nbm.3619 [doi]. (1099-1492 (Electronic)).
Figures