2247
Repeated Binge Alcohol Intoxication Leads to Lower Choline-Containing Compound Signals in Rat Brain: An In Vivo Marker of Alcohol-Induced Neurobiological Abnormalities1Brain and Mind Centre, University of Sydney, Sydney, Australia, 2Department of Radiological Science, Yonsei University, Wonju, Korea, Republic of, 3Ewha Brain Institute, Ewha Womans University, Seoul, Korea, Republic of, 4Department of Biomedical Engineering, The Catholic University of Korea College of Medicine, Seoul, Korea, Republic of, 5Research Institute of Biomedical Engineering, The Catholic University of Korea, Seoul, Korea, Republic of, 6Department of Radiation Oncology, University of Florida, Gainesville, FL, United States, 7Department of Radiation Oncology, Ajou University School of Medicine, Suwon, Korea, Republic of, 8MR Core Laboratory, Asan Institute for Life Sciences, Asan Medical Center, Seoul, Korea, Republic of
Synopsis
Alcohol is the most commonly abused intoxicating substance among young and middle-aged adults, and ranks highly as a cause of disability and mortality. A pattern of heavy consumption, called binge drinking, leads to various psychiatric disorders. We used in vivo proton magnetic resonance spectroscopy (1H MRS) to quantitatively assess neurochemical responses in hippocampus in a rat model of repeated-binge alcohol (RBA) intoxication. We determined that choline-containing compound, gamma-aminobutyric acid, and total N-acetyl-aspartate (tNAA: N-acetyl-aspartate + N-acetyl-aspartyl-glutamate) signals were highly sensitive to binge alcohol intoxication, which provides insights into neurochemical alterations associated with alcohol abuse.
BACKGROUND
Alcohol is an intoxicating substance most commonly abused by young and middle-aged adults, and ranks highly as a cause of disability and mortality.1 A pattern of heavy consumption, called binge drinking, leads to various psychiatric disorders.2PURPOSE
The aim of present study was to use in vivo 1H magnetic resonance spectroscopy (MRS) to quantitatively assess neurochemical responses in the hippocampal region of a rat model of repeated-binge alcohol (RBA) intoxication.EXPERIMENTAL METHODS
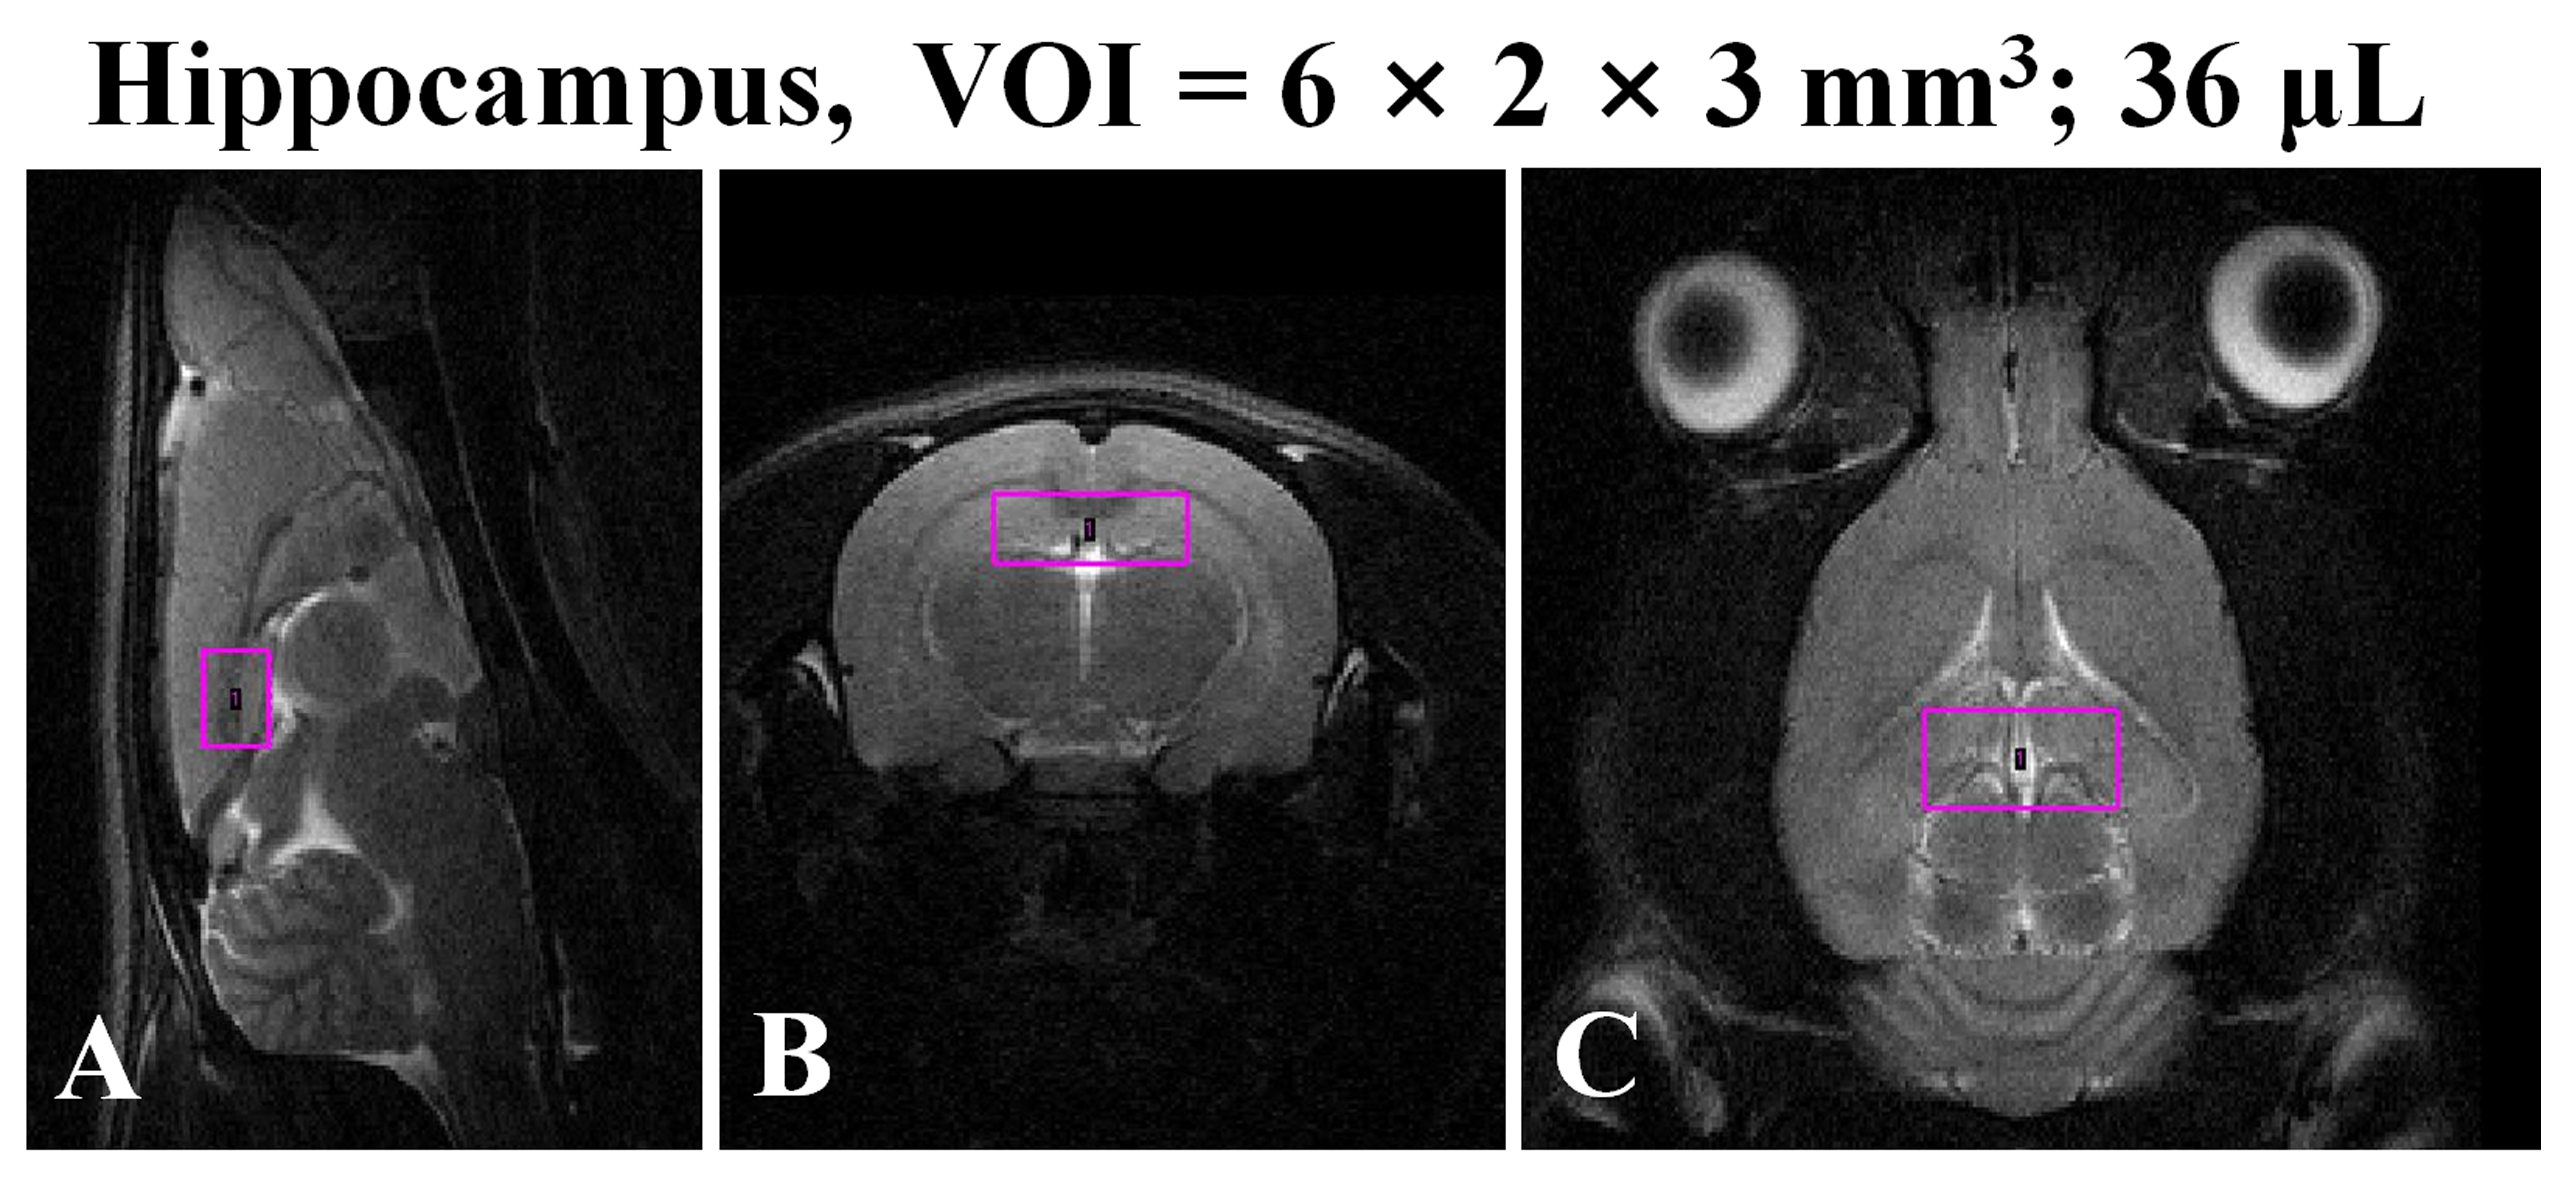
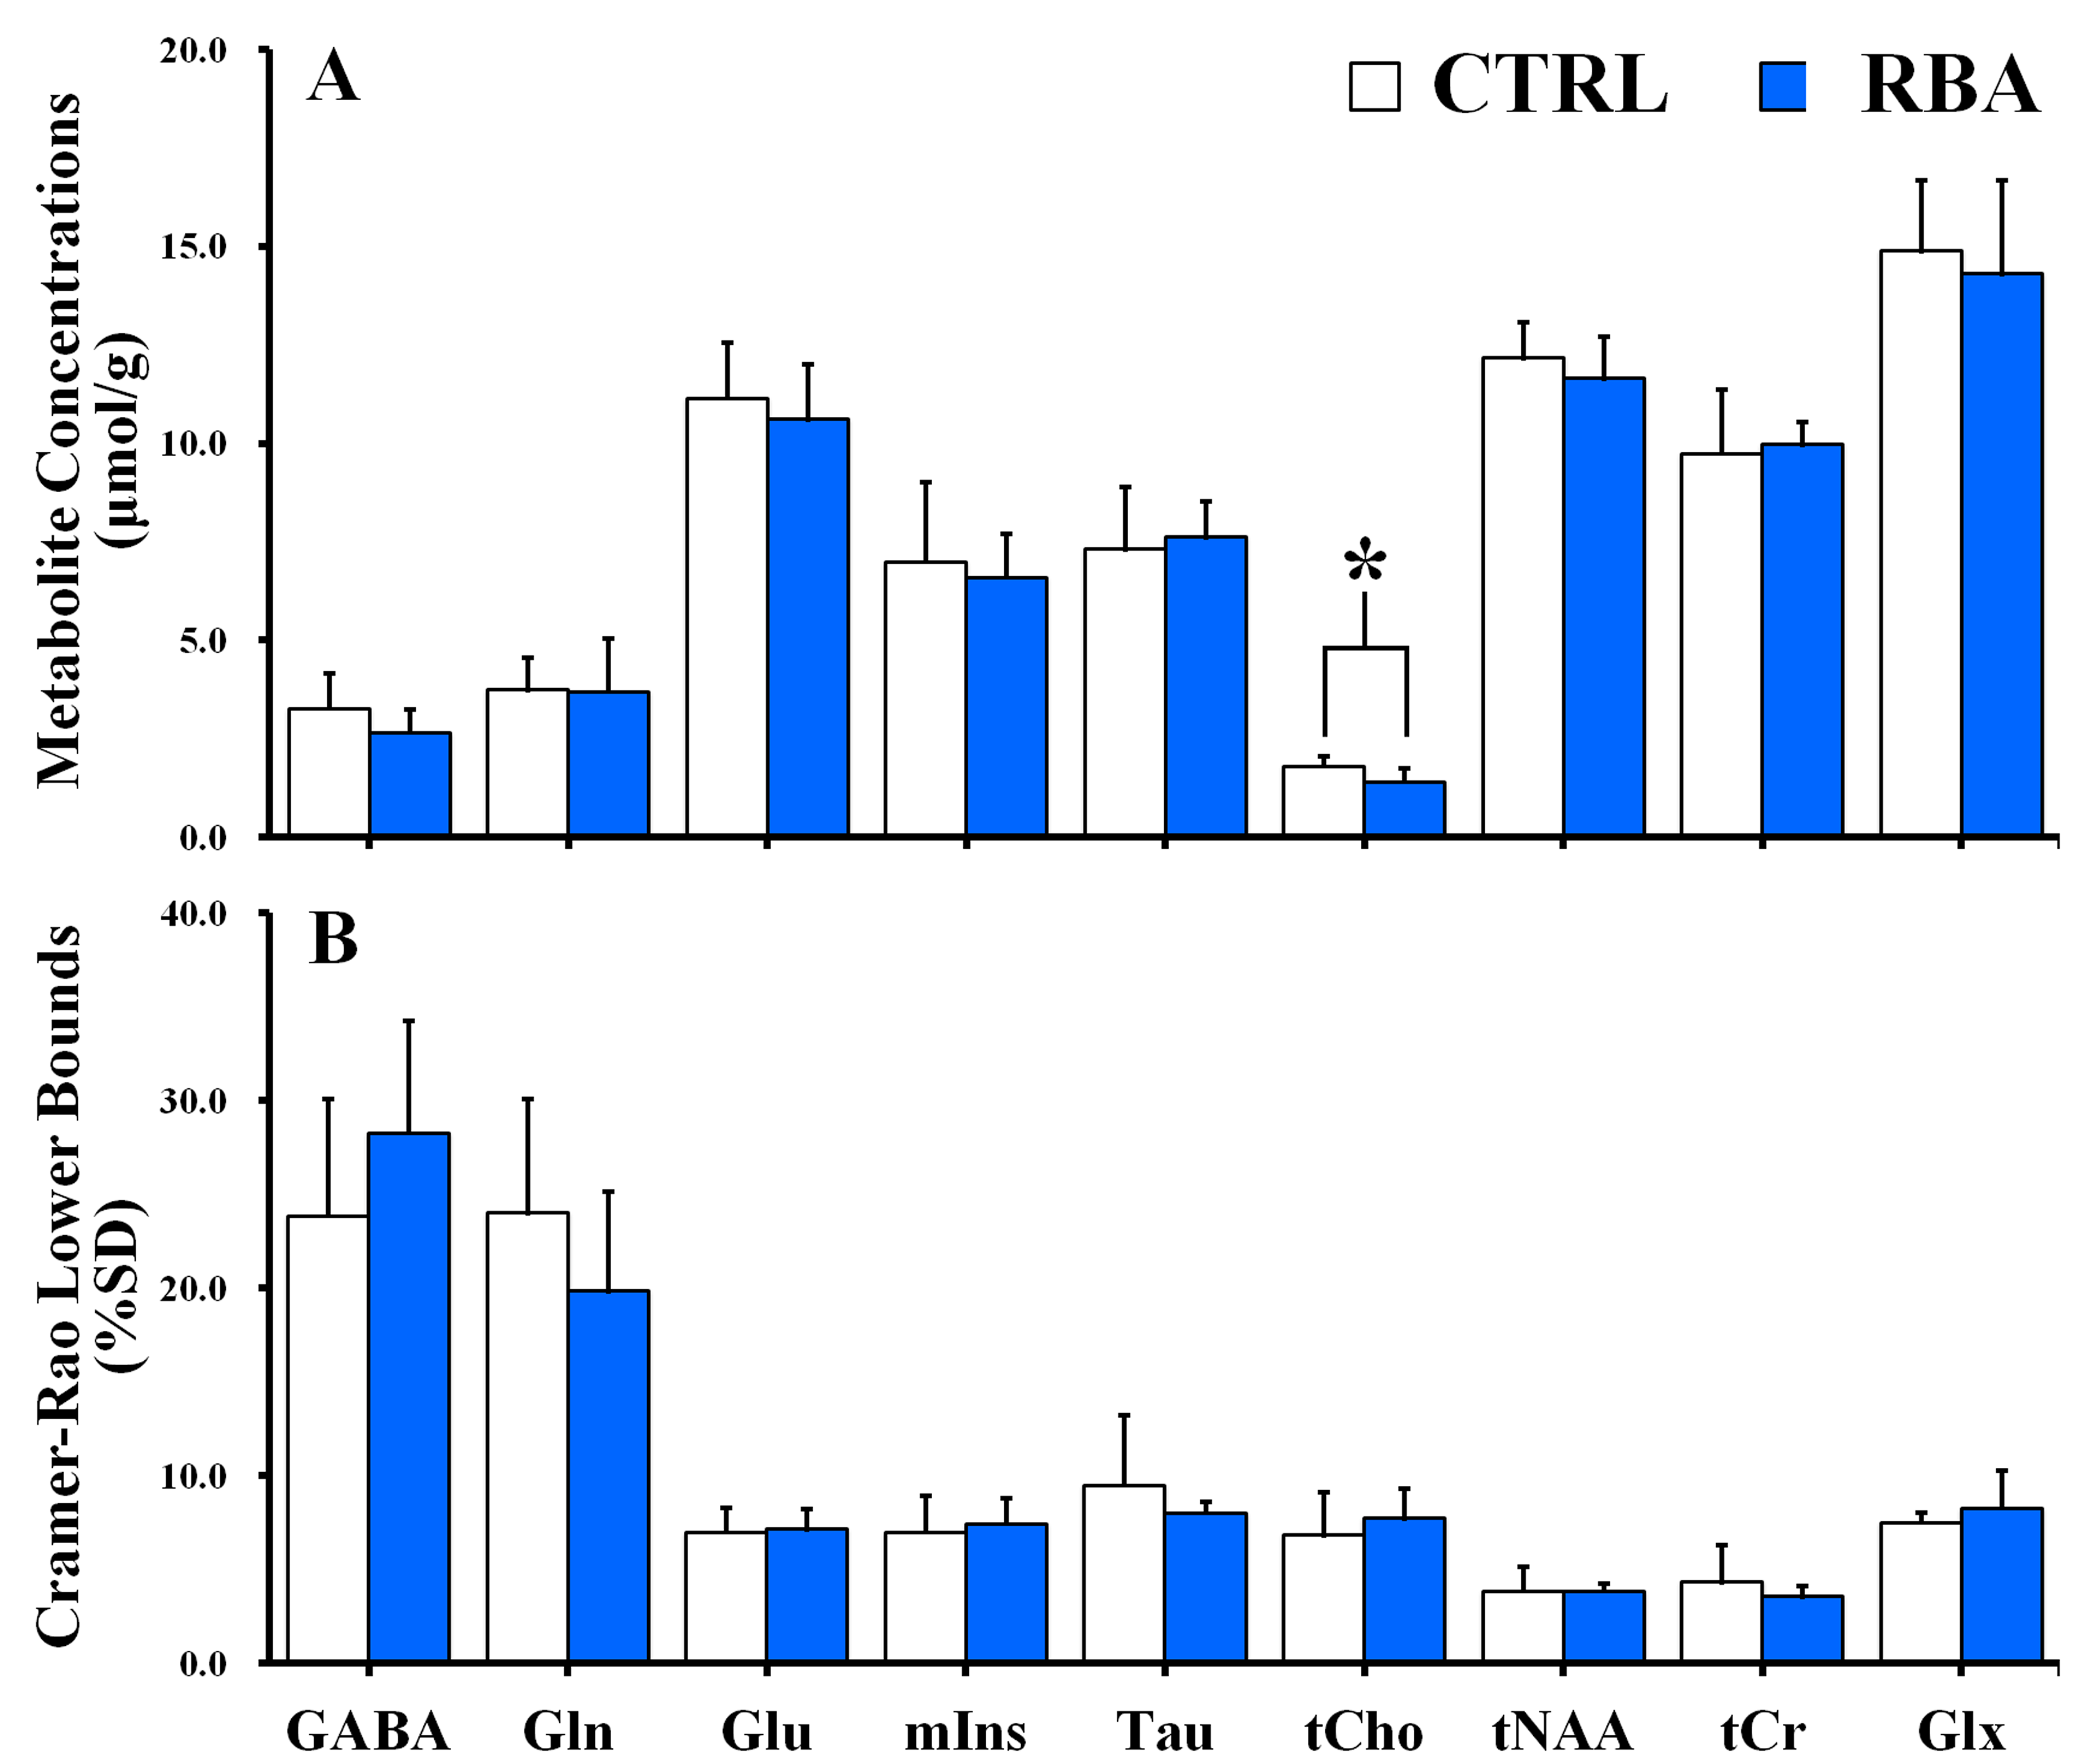
Eight-week-old male Sprague–Dawley rats (n=13, mean body weight: 312.6±7.1g, range: 300.0–327.0g) were divided into two groups. Seven rats in the RBA-exposed group received an initial dose of 5.0g/kg through gavage, and then received additional doses of 2.0g/kg every 8-h (06:00, 14:00, and 22:00-h) for 4 days. Six rats in the sham control (CTRL) group received an equivalent volume (about 3.1-mL) of distilled water at comparable times (07:00, 15:00, and 23:00-h). Sixty minutes after the last gavage session, in vivo MRS scanning was performed on all animals using a 4.7 T Bruker MR system. We selected the delay time of 60-min after the last intermittent alcohol exposure to minimize the potentially confounding effects of alcohol detoxification. The volume of interest (VOI, Fig.1A to C) was selected based on multi-slice axial T2-weighted MR images. The VOI position was targeted to the dorsal hippocampal region, as indicated by the following coordinates: ±3.0 mm to the right and left of midline; ±1.0 mm dorsal and ventral at interaural 7 mm; and ±1.5 mm anterior and posterior at -4 mm bregma. We carefully chose and adjusted the VOI position and size to minimize the inclusion of other anatomical regions and to avoid intracranial lipid contamination. Water suppressed 1H spectra were acquired using a pointresolved spectroscopy pulse sequence (TR/TE=4,000/20 ms, number of acquisitions=384, number of data points=2,048, scan-time=25 min 36 s). Raw data were analyzed using a fully automated process, with Linear Combination Model (LCModel) and a simulated basis set of 17 metabolite spectra. We used a range of acceptable reliability values (Glu, mIns, Tau, tCho, tNAA, tCr, and Glx: less than 20%SD; GABA and Gln: less than 40%SD) based on calculated CRLBs (% standard deviation). Independent t-tests were used to compare mean values of metabolite concentrations, based on internal water references, between CTRL and RBA-exposed rats.RESULTS
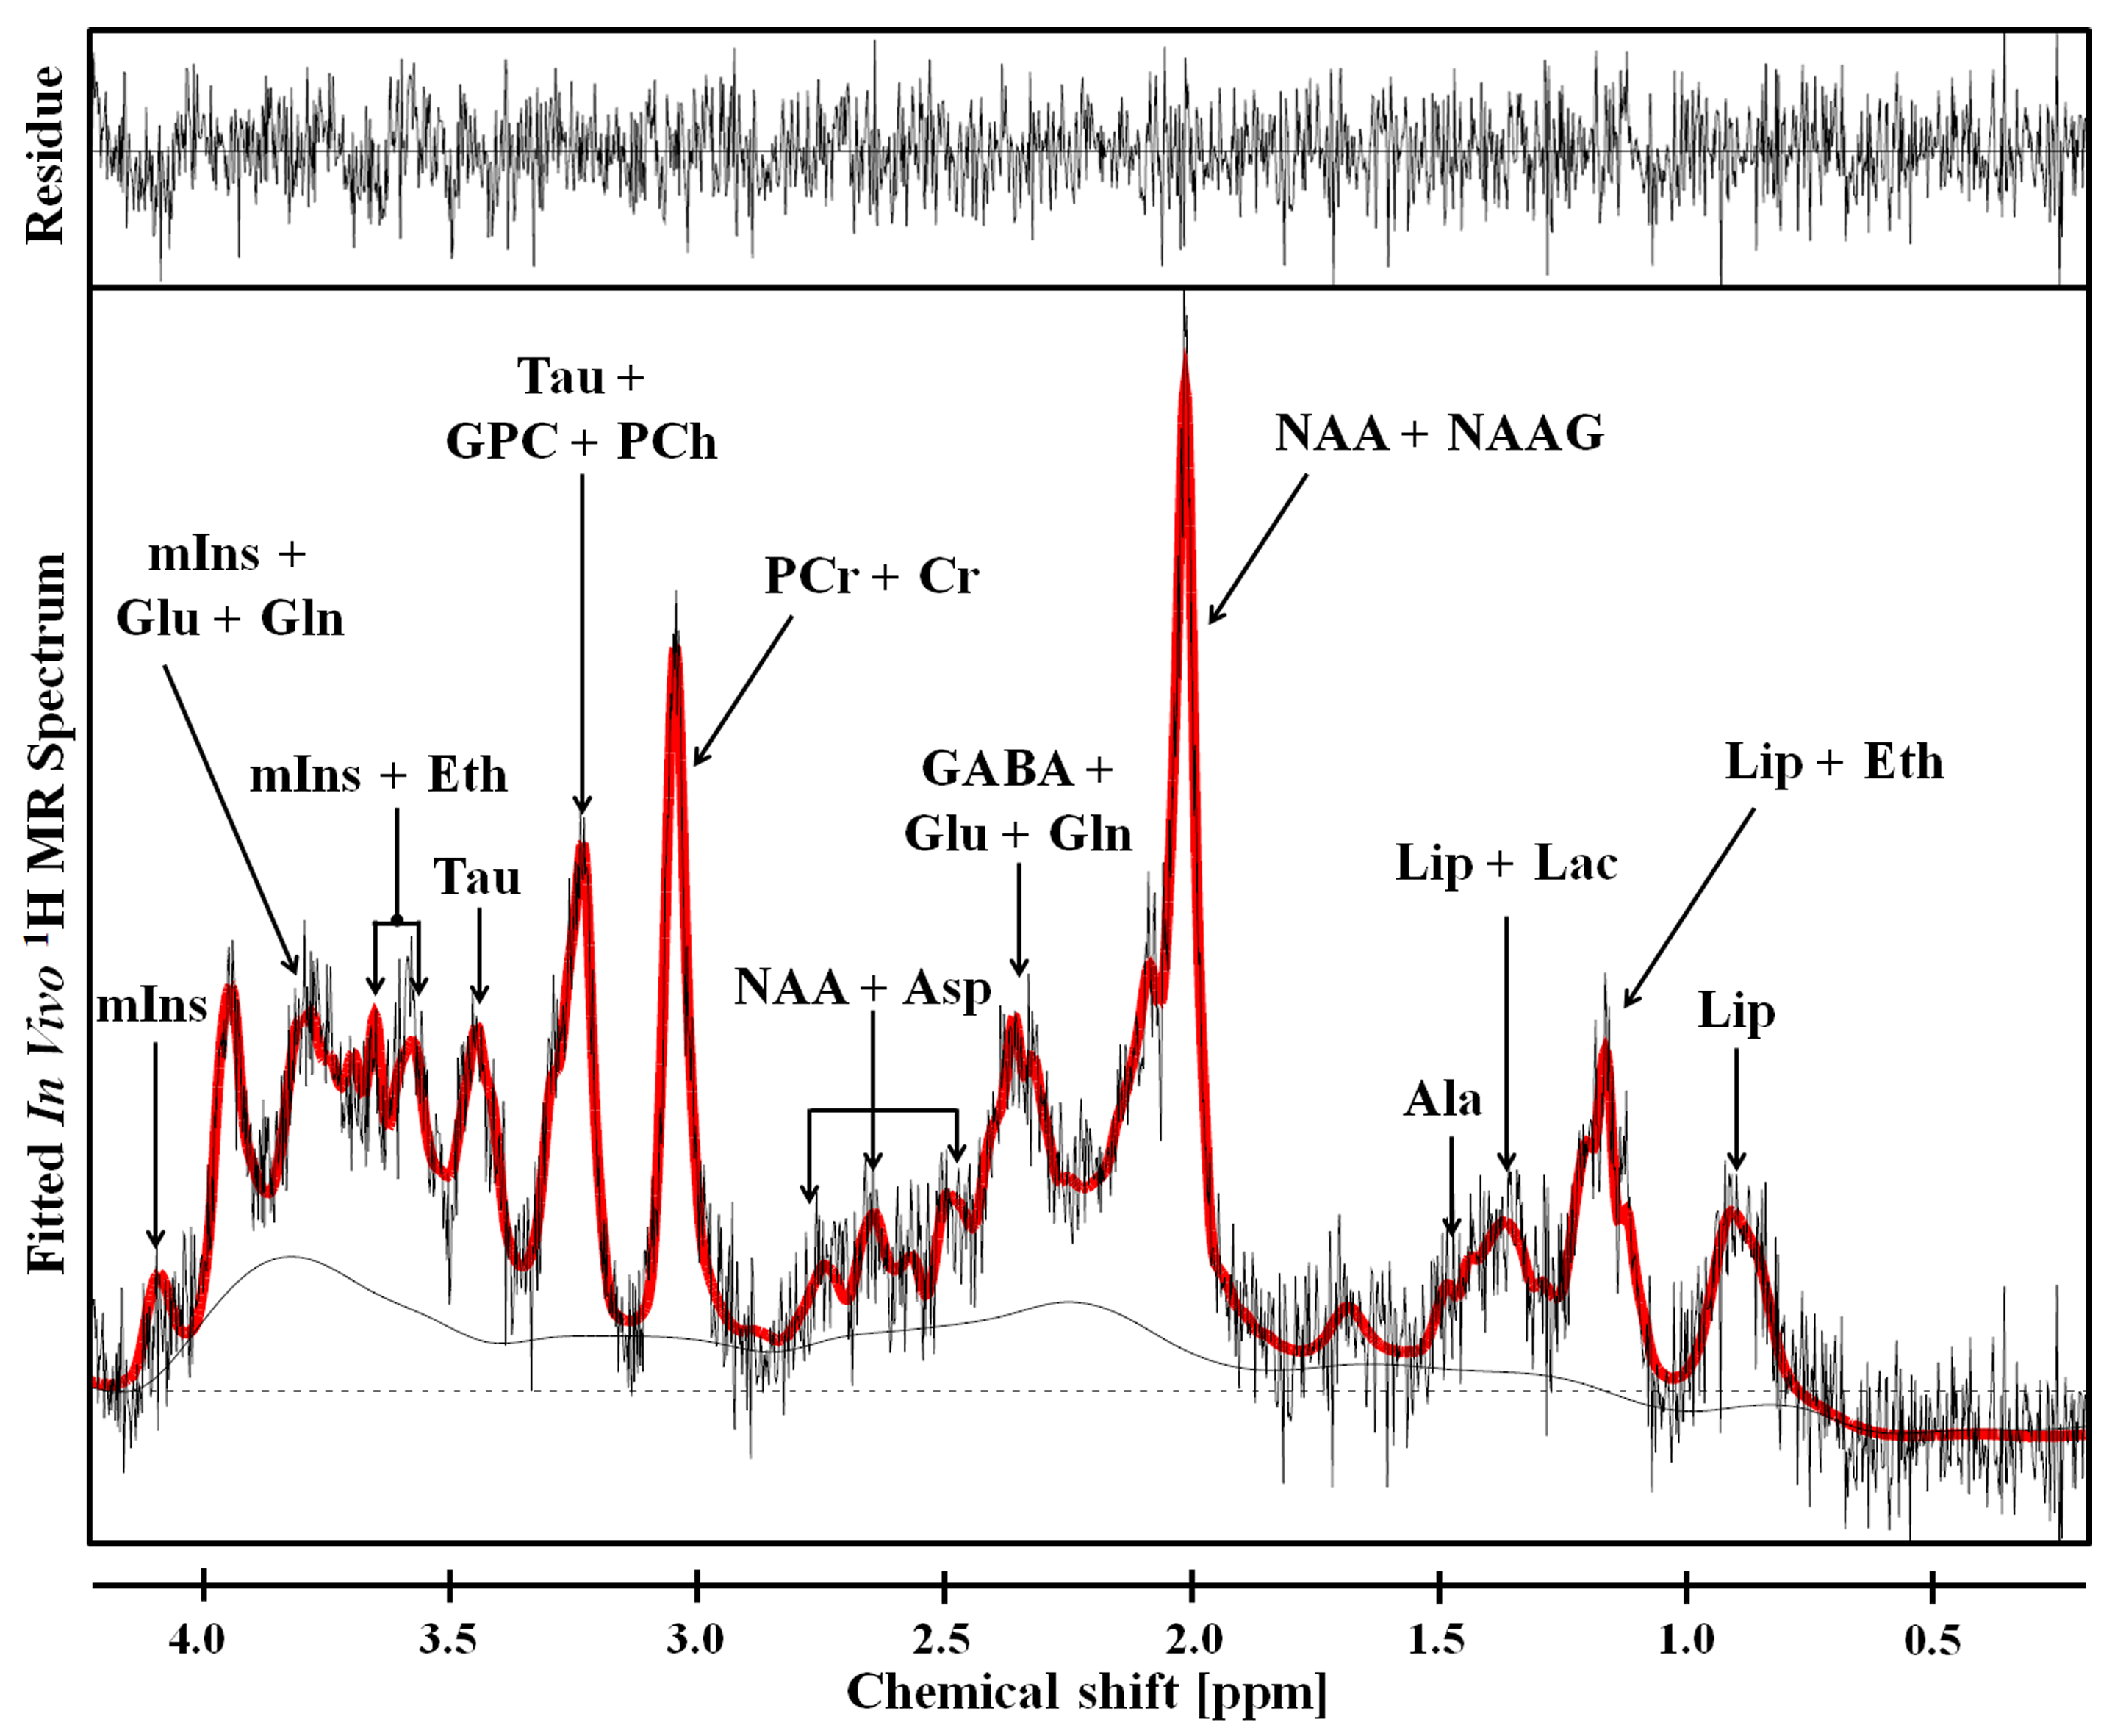
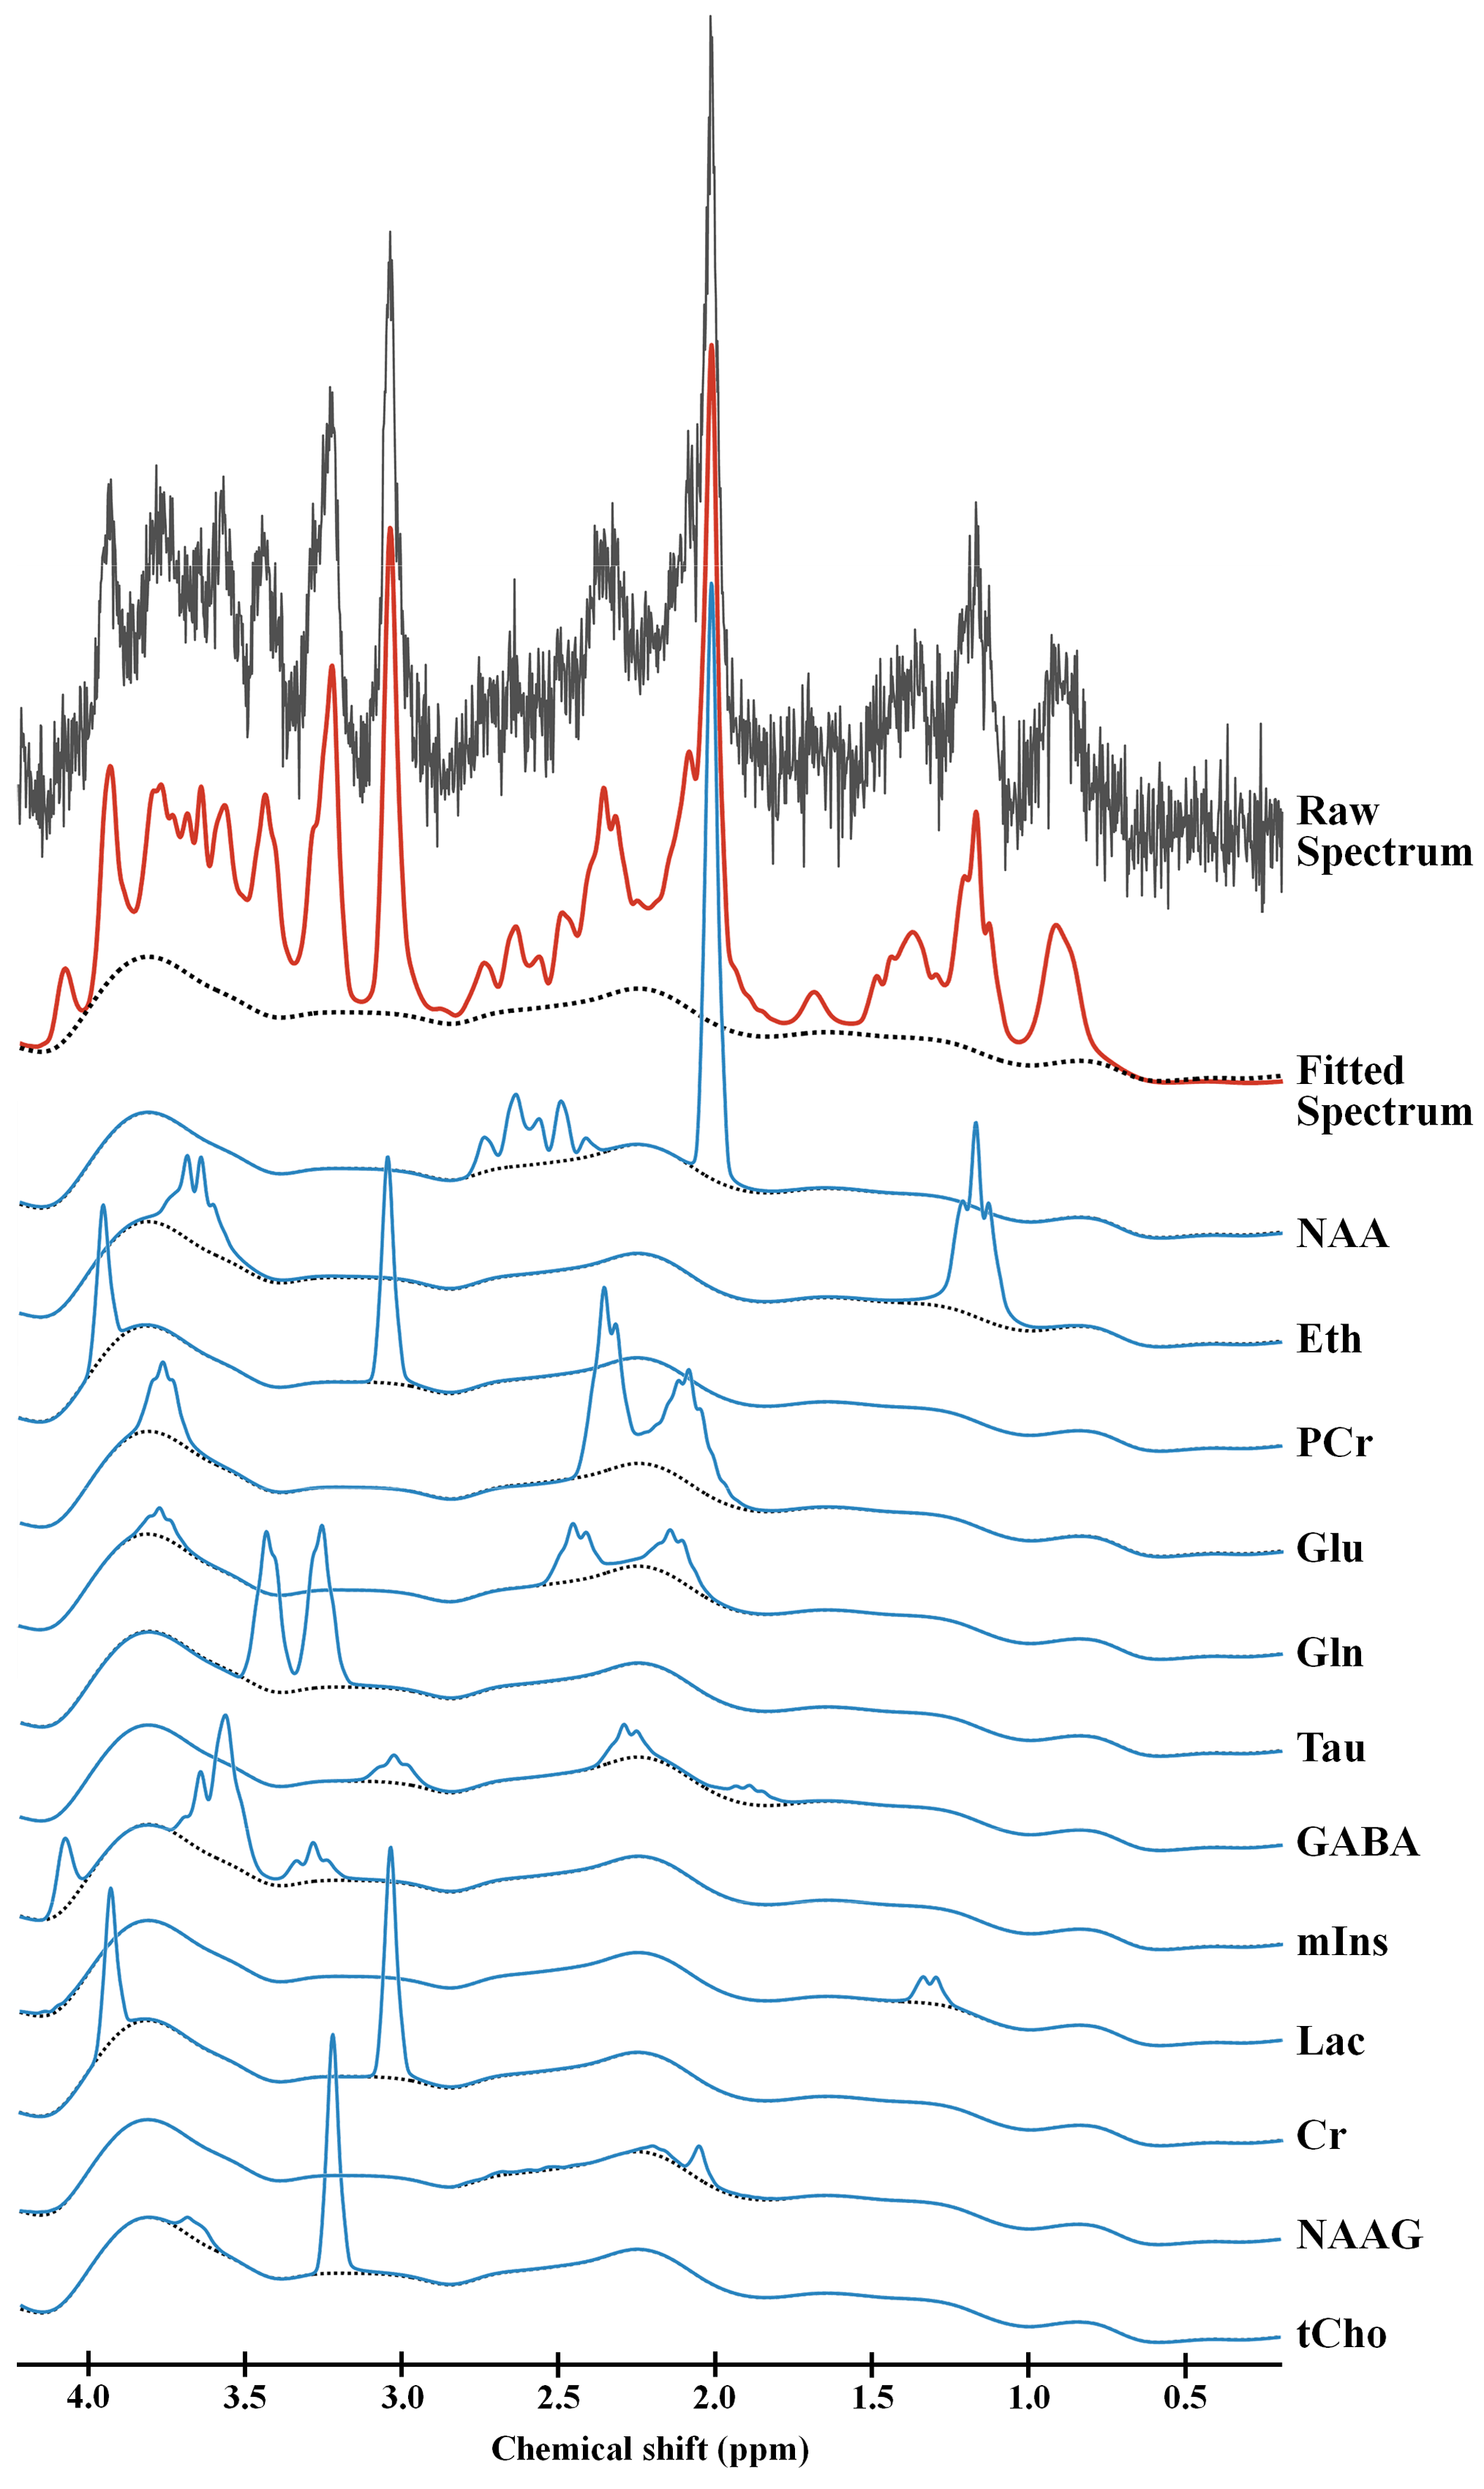
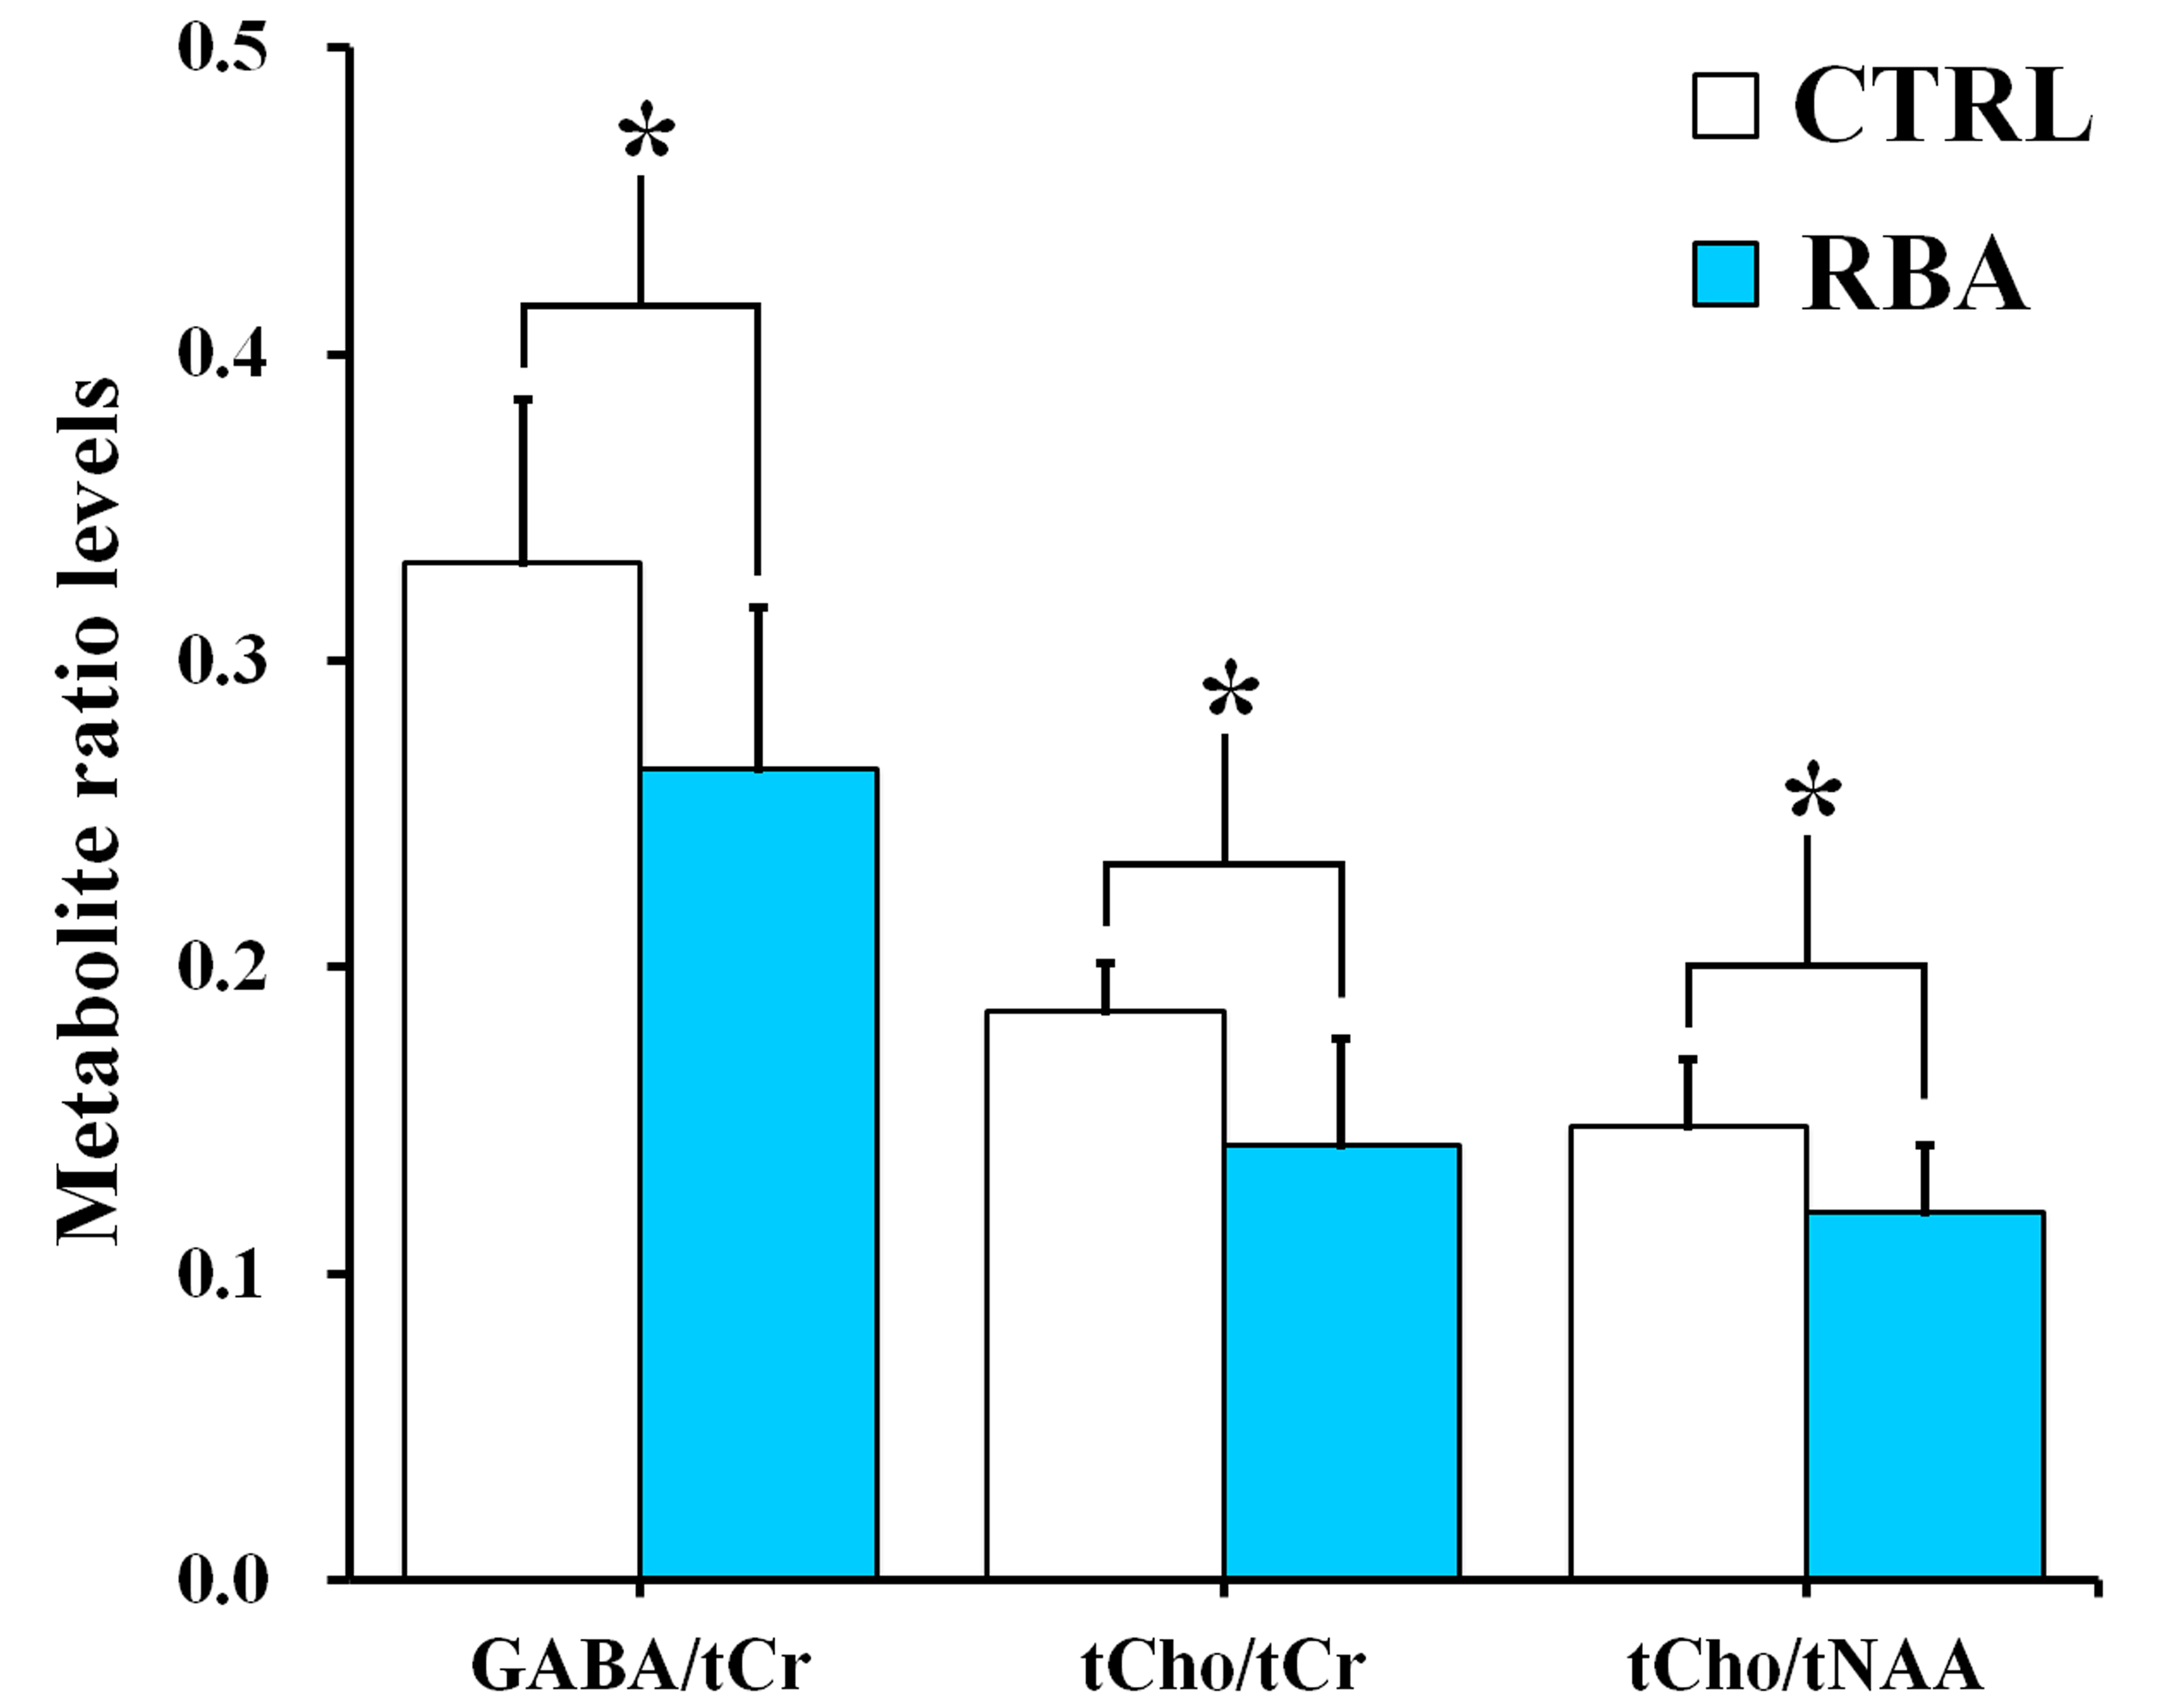
Figure 2 shows the representative 4.7 T 1H MR spectrum acquired from the hippocampal region of 13 rats (CTRL: n=6; RBA: n=7). Figure 3 details our quantitative assessment of 13 fitted in vivo signals in spectra from the hippocampal region of RBA-exposed rats. Figure 3 shows that segments of each metabolite signal were visible in the crowded chemical shift region between 2.0–2.5, and 3.0–3.6 ppm. Independent t-tests confirmed that tCho concentrations in the hippocampal region were significantly lower in RBA-exposed rats than in CTRL rats (p=0.038, Fig.4A). Although not statistically significant, a visual inspection of the findings suggests that tNAA concentrations may be slightly lower in RBA-exposed rats compared to CTRL rats. Figure 4B indicates the average CRLB level for each metabolite, which was used as an estimate of the fitting error and statistical uncertainty. In both CTRL and RBA-exposed rats, most of our analyzed metabolite signals had CRLB levels below 20%SD (except for GABA and Gln, which were below 40%SD; Fig.4B). Moreover, Figure 5 shows that GABA/tCr (p=0.043), tCho/tCr (p=0.016), and tCho/tNAA (p=0.043) metabolite ratios were significantly lower in RBA-exposed rats than in CTRL rats.DISCUSSION
The present study provided several new findings: first, the concentration of choline-containing compounds was significantly lower in RBA-exposed rats than in CTRL rats; and second, GABA/tCr, tCho/tCr, and tCho/tNAA ratios differed significantly between RBA-intoxicated and CTRL rats. Compared to CTRL rats, there was a significant reduction in choline-containing compound signals in RBA-exposed rats, which may indicate alterations in turnover of phosphatidylcholine and other phospholipids, representing an adaptive mechanism in the hippocampal region.3-6CONCLUSION
In summary, to the best of our knowledge, assessments of the influence of RBA intoxication on cerebral metabolite changes in rat models are scarce. The present study demonstrated that in vivo 1H MRS spectra provide valuable information to interpret cerebral neurochemical changes in RBA-exposed rats. We suggested that the tCho, GABA, and tNAA signals were highly sensitive to RBA intoxication, which provides insights into neurochemical alterations associated with alcohol abuse.Acknowledgements
This study was supported by grants (2012-007883) from the Mid-career Researcher Program through the National Research Foundation (NRF) funded by the Ministry of Science, ICT & Future Planning (MSIP) of Korea.References
1. S. Geibprasert, M. Gallucci, T. Krings. Alcohol-induced changes in the brain as assessed by MRI and CT. Eur Radiol. 2010;20:1492–1501.
2. M. Teesson, W. Hall, T. Slade, et al. Prevalence and correlates of DSM-IV alcohol abuse and dependence in Australia: findings of the 2007 National Survey of Mental Health and Wellbeing. Addiction. 2010;105:2085–2094.
3. N.M. Zahr, D. Mayer, T. Rohlfing, et al. Brain Injury and Recovery Following Binge Ethanol: Evidence from In Vivo Magnetic Resonance Spectroscopy. Biol Psychiat. 2010;67:846–854.
4. N.M. Zahr, D. Mayer, T. Rohlfing, et al. Rat strain differences in brain structure and neurochemistry in response to binge alcohol. Psychopharmacology. 2014;231:429–445.
5. G. Ende, S. Walter, H. Welzel, et al. Alcohol consumption significantly influences the MR signal of frontal choline-containing compounds. NeuroImage. 2006;32:740–746.
6. H. Lee, G.H. Holburn, R.R. Price. Proton MR spectroscopic studies of chronic alcohol exposure on the rat brain J Magn Reson Imaging. 2003;18:147–151.
Figures