2240
Machine-learning classification of ADHD with biomarkers of cerebral cortical thickness: parcellation schemes, gender effects and feature selection1National Taiwan University of Science and Technology, Taipei, Taiwan, 2National Sun Yat-sen University, Kaohsiung, Taiwan
Synopsis
In this study, we attempt to use machine-learning algorithms for ADHD classification with cerebral cortical thickness. We compared three cortical parcellation schemes and three different sets of features. The results supported the usage of Aparc and A2009s of FreeSurfer and suggested that recursive feature elimination effectively increased the predication accuracies. In addition, gender is an influential feature for the classification.
Purpose
Cerebral cortical thickness (CT) has been shown significantly different between normal subjects and attention deficit/hyperactivity disorder (ADHD) patients1. In this study, we aim to develop a machine learning method based on CT measurements for classifications of ADHD patients and derive reliable CT biomarkers from cortical parcellation schemes.Materials and Methods
We used the publicly available ADHD-200 data set (647 T1-weighted volumes, 399 males and 259 females, age: 48.40 ± 16.48 yr, age range: 7~21 yr, typically developing individuals: 486, ADHD-combined: 161). The high resolution 3D T1 volumes were processed using FreeSurfer in the cloud computing environment2. The regional CT values were extracted from three cortical parcellation schemes provided in FreeSurfer: the 62 DKT labels3, 68 Aparc labels4 and 148 A2009s labels5. The analysis and machine learning were performed in the Python environment.
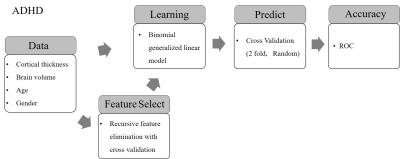
Figure 1 displays the block diagram of the analysis flow. We used the binomial generalized linear model (bGLM) with the model formula: $$ADHD \sim VOLUME + GENDER + AGE + \sum_i T(labels_{i})$$ , where T(labelsi) is the average thickness value of brain in each labels, and VOLUME is intracranial volume. We used two-fold cross-validation with 1000 times of permutations. A half of the data sets were randomly selected into the training data sets and the other half of the data sets were used to test the accuracy of the trained bGLM model. We compared the predicted diagnosis (i.e., normal or ADHD-combined) with the true diagnosis and varied the threshold for the output of bGLM to produce classifications and plot the the receiver operation curve (ROC). The average of the area under curve (AUC) of the 1000 permutations was calculated to assess the performance of the classifications. gender classification to calculate the average area under curve (AUC) of the receiver operation curve (ROC) of the 1000 cross-validations. In addition, we used the recursive feature elimination with cross-validation6 (RFECV) for selections of structure feature (CT plus intracranial volume). We compared the classification results obtained with and without the feature selection procedure.
Result
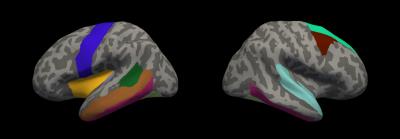
The performance of three types of feature sets were evaluated: (1) all structure features, denoted as ALL (2) all structure features plus gender, denoted as ALL+Gender (3) structure features selected by RFECV plus gender, denoted as RFECV+Gender. We then have results from 9 combinations (3 feature sets x 3 parcellation schemes). Figure 2 shows the ROC curves of the classification results and Table 1 listed the corresponding average AUC values. Notice that adding gender into the feature sets and using RFECV prominently increased the mean AUCs. The classification accuracies of REFCV+Gender outperformed those of ALL and ALL+Gender. The Aparc scheme ranked stable in three types of feature sets. The A2009s scheme combined with the REFCV+Gender feature set produced the highest mean AUC. However, the mean AUC of A2009s with all structure features (i.e., ALL) was the lowest amount the three schemes. Figure 3 displays the Aparc labels selected by RFECV on inflated brain surfaces.Discussion and Conclusion
In this study, we aimed to develop a machine-learning method to classify ADHD subjects according to the regional CT values. The results suggested that using all CT features produced AUCs from 0.61- 0.66. The AUCs increased to 0.63-0.70 while we included gender in the feature sets. The results support that the gender feature plays an important role of ADHD classification. Using REFCV for feature selection, the AUCs increased to 0.75-0.80. The results suggest the selected features could be associated with ADHD. For example, the right frontal cortical thickness has been shown to correlate with ADHD1. Using these features as biomarkers increased the performance of the machine learning algorithm. Amount the three parcellation schemes, the mean AUCs of Aparc generally ranked amount the top. Using the refined 148 labels of A2009s without REFCV, the classification results are the worst. Nonetheless, the REFCV feature selection highly improved the classification results with A2009s. In summary, the results suggested that, for the ADHD classification application, Aparc is generally a “suitable” selection and A2009s could be the best scheme if we correctly selected the dominant features. Gender should be included in feature sets to improve classification accuracy.Acknowledgements
Supported by the Ministry of Science and Technology under grants 104-2221-E-011 -064 -MY3References
[1] Almeida LG et al., Reduced right frontal cortical thickness in children, adolescents and adults with ADHD and its correlation to clinical variables: a cross-sectional study. J Psychiatr Res. 2010 Dec;44(16):1214-23
[2] Yang SY et al., "A General Cloud Computing Framework for Medical Image Analysis, Part 1: Implementing the System", #3545, Annual Meeting of OHBM 2015, June 14-18, 2015, Honolulu, Hawaii
[3] Klein, A. et al., 101 labeled brain images and a consistent human cortical la-beling protocol. Front. Neurosci. 6, 171.
[4] Desikan, RS et al., An automated labeling system for subdividing the human cerebral cortex on MRI scans into gyral based regions of interest. Neuroimage. 2006; 3, 968–980.
[5] Destrieux, C et al., Automatic parcellation of human cortical gyri and sulci using standard anatomical nomenclature. Neuroimage. 2010;53, 1–15.
[6] Guyon, I et al., “Gene selection for cancer classification using support vector machines”, Mach. Learn., 2002;46(1-3), 389–422.
Figures


