2230
Longitudinal opto-pharmaco-fMRI of Selective Serotonin Reuptake Inhibition1Institute for Biomedical Engineering, ETH and University of Zurich, Zürich, Switzerland, 2Preclinical Laboratory for Translational Research into Affective Disorders, DPPP, Psychiatric Hospital, University of Zurich, Zürich, Switzerland
Synopsis
The serotonergic system is a high-centrality node in the brain network implicated in affective disorders and their treatment. We use optogenetics, fMRI, and pharmacology to image serotonergic effects of antidepressant treatment in mice at the whole-brain level. We stimulate the ascending serotonergic system and perform functional imaging at multiple time points over the course of antidepressant (fluoxetine) treatment. We establish the feasibility of this paradigm, and report two trends in serotonergic kinetics: (a) increased serotonergic system signal transmission upon acute, but not chronic fluoxetine administration, (b) decreased serotonergic system excitability during the first phase of chronic fluoxetine administration.
Background
The serotonergic system is of great clinical interest due to its implication in affective disorders and their treatment. It represents a node with high degree centrality in the brain, and it is evolutionarily well conserved. As such it is interesting to both applied and basic research, and excellently suited for translational study.
Selective Serotonin Reuptake Inhibitors (SSRIs) are the foremost drug class for treating depression,and also find significant use in treating anxiety, phobia, panic, and obsessive-compulsive disorders1. Given this prominent role of SSRIs, there have been substantial efforts in trying to understand their modulatory effects on the serotonergic system. Yet current explanations remain tentative, in part due to the lack of means to longitudinally study serotonergic neurotransmission at the whole-brain-level.
We present a study protocol and data analysis concept determining how serotonergic nucleus excitability and projection-region-contingent serotonergic neurotransmission are affected over the course of chronic SSRI treatment.
Methods
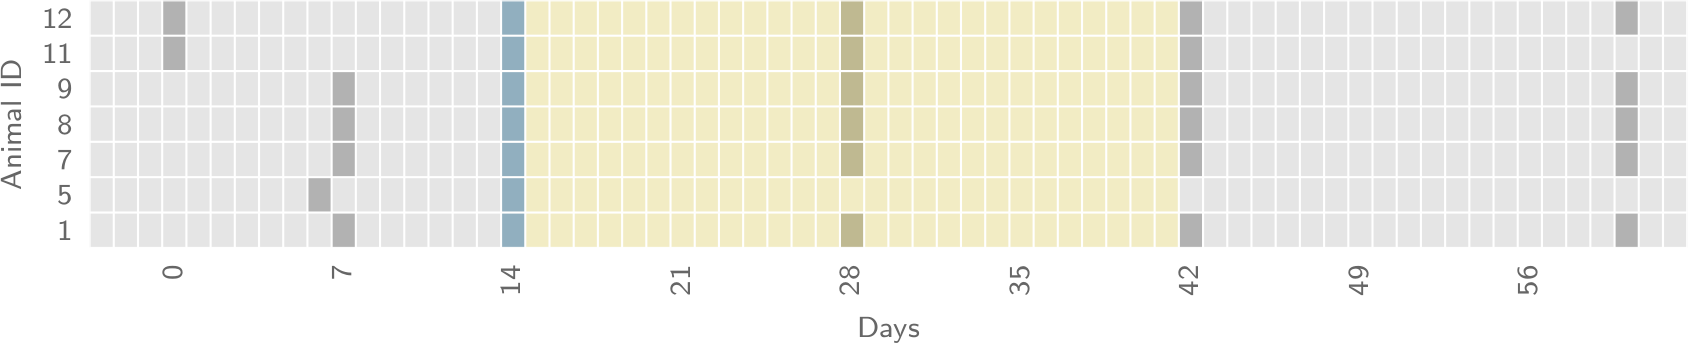
Serotonergic cells in the Dorsal Raphe (DR) were targeted for optogenetic stimulation by injection of a Cre-conditional channelrhodopsin-expressing adeno-associated virus into mice expressing Cre under the ePet promoter2. An optic fiber was chronically implanted to allow for stimulation of channelrhodopsin-expressing cells. Mice were imaged and stimulated according to the same protocol on 5 sessions: before, during acute, chronic (2x), and after treatment with an SSRI (fluoxetine). Mice were injected with an iron oxide based contrast agent (Endorem, Laboratoire Guebet SA, France) in order to enable short echo-time imaging and minimize artifacts. Functional EPI measurements were thus contingent on cerebral blood volume (CBV).
A forced swim test was carried out (on a distinct cohort from the fMRI measurements) at week 4 post-treatment as behavioral readout of fluoxetine efficacy.
Data were preprocessed and analyzed with SAMRI, an in-house toolkit using Nipype2 to construct high-level pipelines which access functions from AFNI4, ANTs5, FSL6, nilearn7 and many more data analysis packages. Preprocessing involved image registration, smoothing, and bandpass filtering. Stimulus effects were estimated via a general linear model (GLM) using a convoluted laser stimulation regressor, and an orthogonalized habituation confound regressor. Due to our reduced sample size we threshold significance at p ≤ 0.1.
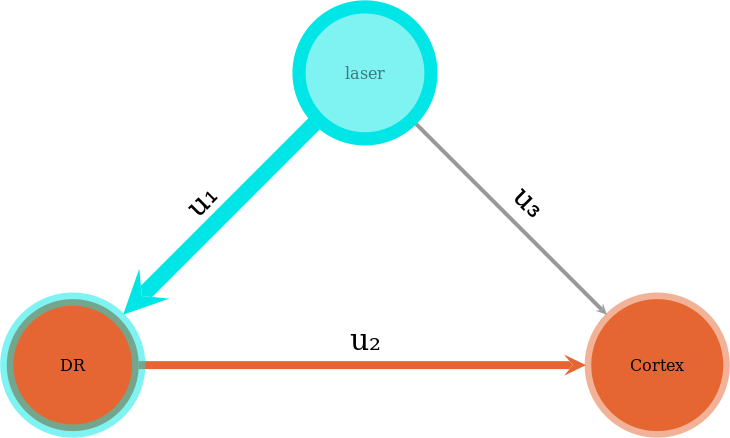
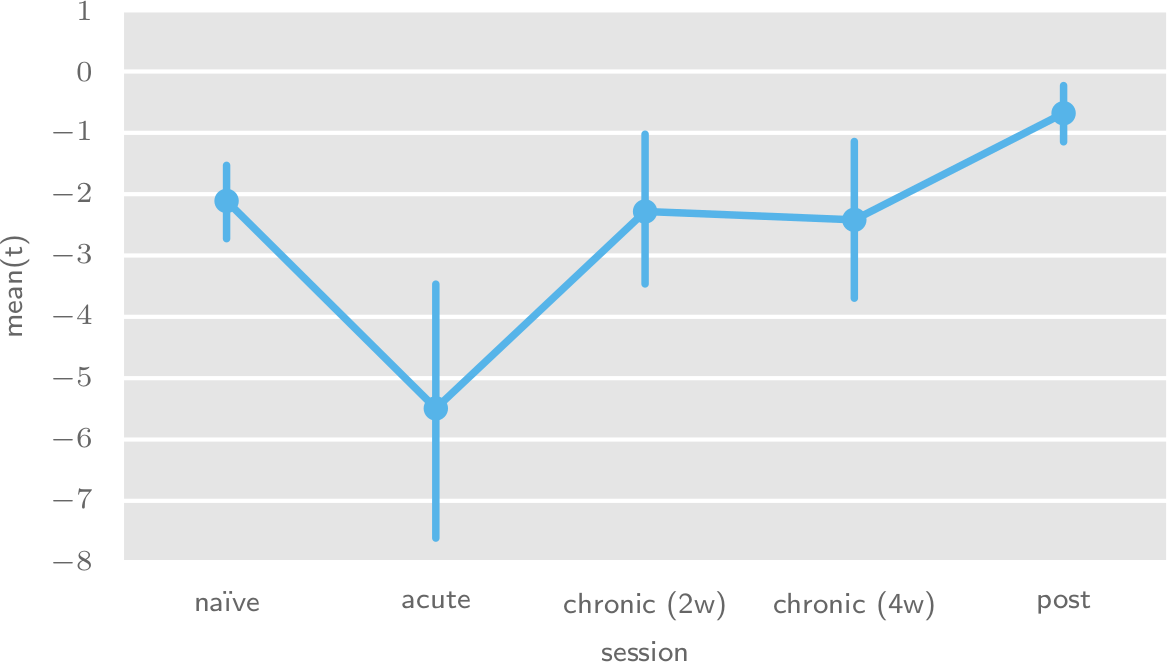
To assess treatment effects on the bimodal response, we use a minimal network representation of serotonergic function (figure 2). We estimate the u1 weighting via the mean t-statistic of a DR region of interest (ROI), and the u3 weighting via the mean t-statistic of a whole-cortex region of interest. We use t-statistic maps sourced from whole-brain per-subject GLM fits.
Results
The forced swim test, performed on distinct cohorts, yielded a significant increase in struggling behavior for the fluoxetine group, with p ≈ 0.045 for the canonical last 4 minutes, and p ≈ 0.03 for the middle two minutes shown to be more sensitive to SSRIs8.
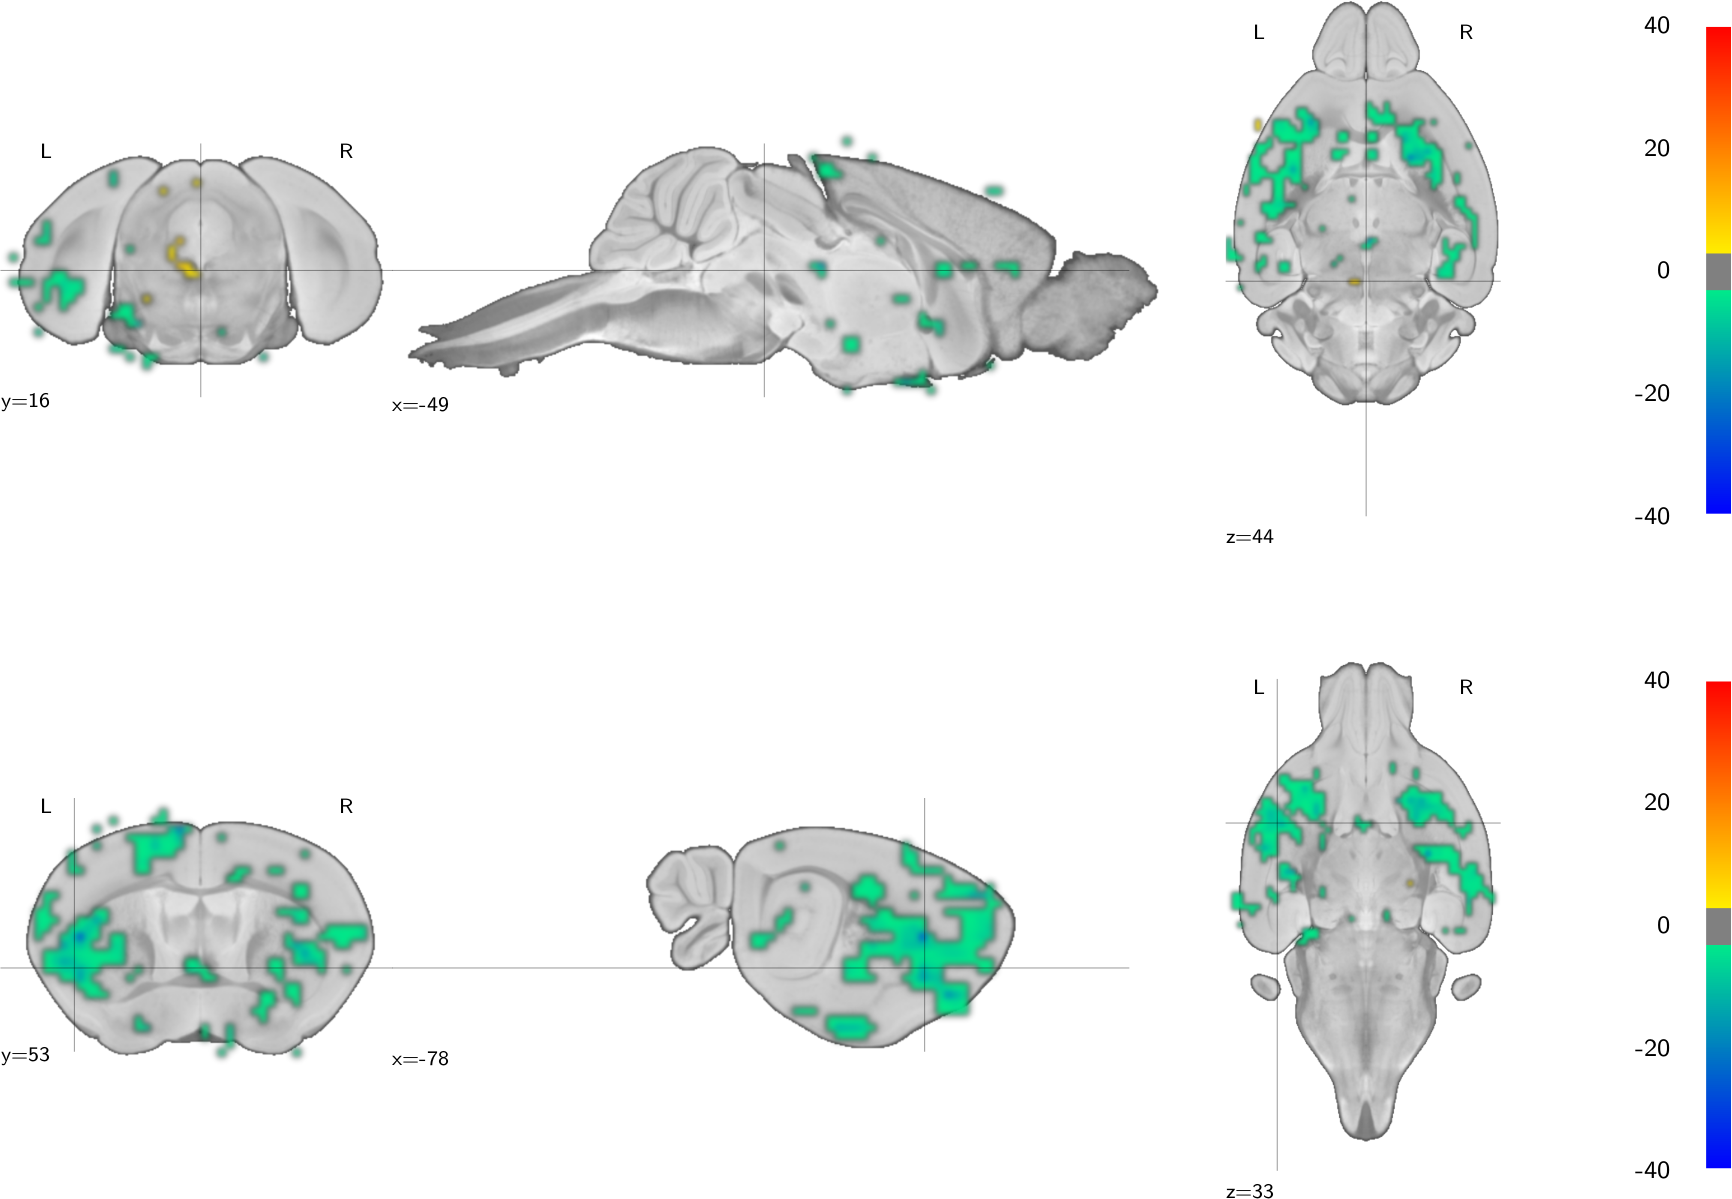
Across sessions, optogenetic stimulation elicited a regionally segregated bimodal response: a weak CBV increase in the DR, and a strong CBV decrease predominantly in cortical areas and most strongly in the prefrontal cortex. This is most evident after 4 weeks of chronic fluoxetine administration - as seen in the whole-brain population statistical map (figure 3).
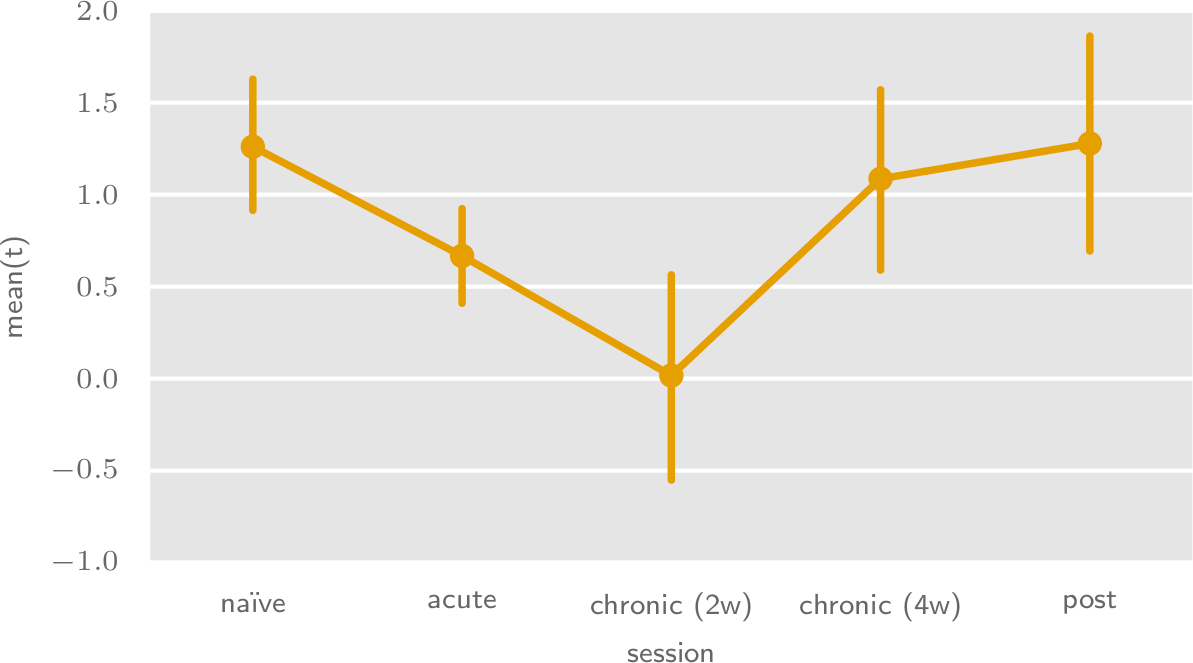
To determine serotonergic system excitability and transmission strength changes during the treatment time course, we have performed population-level analyses of the per-animal t-statistic means (figures 4 and 5, respectively).
Discussion
We have developed a longitudinal opto-fMRI protocol which performs satisfactory in many key aspects, including longitudinal implant and animal preparation viability, virus expression stability, and sensitivity to well-documented psychopharmacologic effects.
We observe two trends in the serotonergic system excitability time course, consistent with commonly hypothesized SSRI therapeutic action mechanisms. Firstly, we notice a decrease in excitability at two weeks of fluoxetine treatment. This is indicative of autoreceptor-mediated inhibition triggered by extracellular accumulation of serotonin. Secondly, we see a subsequent excitability increase, which also persists after fluoxetine treatment cessation. We suggest that this may be related to a sustained down-regulaton of the serotonergic autoreceptor system in response to prolonged hyperactivation.
We also observe a trend in the serotonergic system tansmission strength time course, by which cortical inhibition increases during acute fluoxetine administration, consistent with the short-term effects of extracellular serotonin accumulation.
Though we acknowledge the limited statistical power of this first data set, we found the observations detailed herein substantial for the design of current follow-up experiments. We believe our results are suited to inform the scientific community of the feasibility of longitudinal opto-pharmaco-fMRI studies, and their capacity to image complex pharmacologic effects at the whole-brain level.
Acknowledgements
We would like to thank Joanes Grandjean for his ground-laying opto-fMRI work in our lab.References
1. D. S. Baldwin. Evidence-based guidelines for the pharmacological treatment of anxiety disorders: recommendationsfrom the british association for psychopharmacology. Journal of Psychopharmacology, 19(6):567–596, nov 2005. doi:10.1177/0269881105059253. URL http://dx.doi.org/10.1177/0269881105059253.
2. M. M. Scott, C. J. Wylie, J. K. Lerch, R. Murphy, K. Lobur, S. Herlitze, W. Jiang, R. A. Conlon, B. W. Strowbridge,and E. S. Deneris. A genetic approach to access serotonin neurons for in vivo and in vitro studies. Proceedings ofthe National Academy of Sciences, 102(45):16472–16477, oct 2005. doi: 10.1073/pnas.0504510102. URL http://dx.doi.org/10.1073/pnas.0504510102.
3. Satrajit Ghosh, Chris Filo Gorgolewski, Oscar Esteban, Erik Ziegler, David Ellis, cindeem, Michael Waskom, DavClark, Michael, Fred Loney, Alexandre M. S., Michael Notter, Hans Johnson, Anisha Keshavan, Yaroslav Halchenko,Carlo Hamalainen, Blake Dewey, Ben Cipollini, Daniel Clark, Julia Huntenburg, Drew Erickson, Michael Hanke,moloney, Jason W, Demian Wassermann, cdla, Nolan Nichols, Chris Markiewicz, Jarrod Millman, and Arman Es-haghi. nipype: Release candidate 1 for version 0.12.0, 2016. URL https://doi.org/10.5281/zenodo.50186.
4. S. Gold, B. Christian, S. Arndt, G. Zeien, T. Cizadlo, D. L. Johnson, M. Flaum, and N. C. Andreasen. FunctionalMRI statistical software packages: a comparative analysis. Hum Brain Mapp, 6(2):73–84, 1998.
5. Brian B. Avants, Nicholas J. Tustison, Gang Song, Philip A. Cook, Arno Klein, and James C. Gee. A reproducibleevaluation of ANTs similarity metric performance in brain image registration. NeuroImage, 54(3):2033–2044, feb2011. doi: 10.1016/j.neuroimage.2010.09.025. URL http://dx.doi.org/10.1016/j.neuroimage.2010.09.025.
6. Mark Jenkinson, Christian F. Beckmann, Timothy E.J. Behrens, Mark W. Woolrich, and Stephen M. Smith. FSL.NeuroImage, 62(2):782–790, aug 2012. doi: 10.1016/j.neuroimage.2011.09.015. URL http://dx.doi.org/10.1016/j.neuroimage.2011.09.015.
7. Alexandre Abraham, Fabian Pedregosa, Michael Eickenberg, Philippe Gervais, Andreas Mueller, Jean Kossaifi,Alexandre Gramfort, Bertrand Thirion, and Gaël Varoquaux. Machine learning for neuroimaging with scikit-learn.Front. Neuroinform., 8, 2014. doi: 10.3389/fninf.2014.00014. URL http://dx.doi.org/10.3389/fninf.2014.00014.
8. Ana Paula Ramos Costa, Cintia Vieira, Lauren O.L. Bohner, Cristiane Felisbino Silva, Evelyn Cristina da Silva San-tos, Thereza Christina Monteiro De Lima, and Cilene Lino de Oliveira. A proposal for refining the forced swimtest in swiss mice. Progress in Neuro-Psychopharmacology and Biological Psychiatry, 45:150–155, aug 2013. doi:10.1016/j.pnpbp.2013.05.002. URL http://dx.doi.org/10.1016/j.pnpbp.2013.05.002.
Figures