2229
Assessment of therapeutic response in glioma with spillover-, MT- and T1-corrected amide proton transfer MR imaging1Paul C. Lauterbur Research Centre for Biomedical Imaging, Shenzhen Institutes of Advanced Technology, Chinese Academy of Sciences, Shenzhen, People's Republic of China, 2Department of Neurosurgery, Cancer Center, Sun Yat-Sen University, Guangzhou, People's Republic of China
Synopsis
Amide proton transfer (APT) MR imaging has proved to be capable of detecting/grading brain tumors as well as assessing treatment response. Routinely used magnetization transfer (MT) asymmetry is contaminated with MT, nuclear overhauser effect (NOE) and T1 relaxation time of water. In this study, the dominant contributors of direct water saturation and MT to Z-spectrum were estimated from a sum of two Lorentzian functions, and APT was corrected with T1 scale and inverse Z-spectrum analysis. Results showed that the corrected APT can reliably depict glioma heterogeneity post-treatment, in accordance with H & E histological observations.
Purpose
Amide proton transfer (APT) MR imaging has proved to be capable of detecting/grading brain tumors as well as assessing treatment response.1, 2 Routinely used magnetization transfer (MT) asymmetry is contaminated with MT, nuclear overhauser effect (NOE) and T1 relaxation time of water.3 The aim of this study was to investigate the corrected APT effect with the aforementioned factors removal in the evaluation of glioma therapeutic response in a rat model at 3 T.Methods
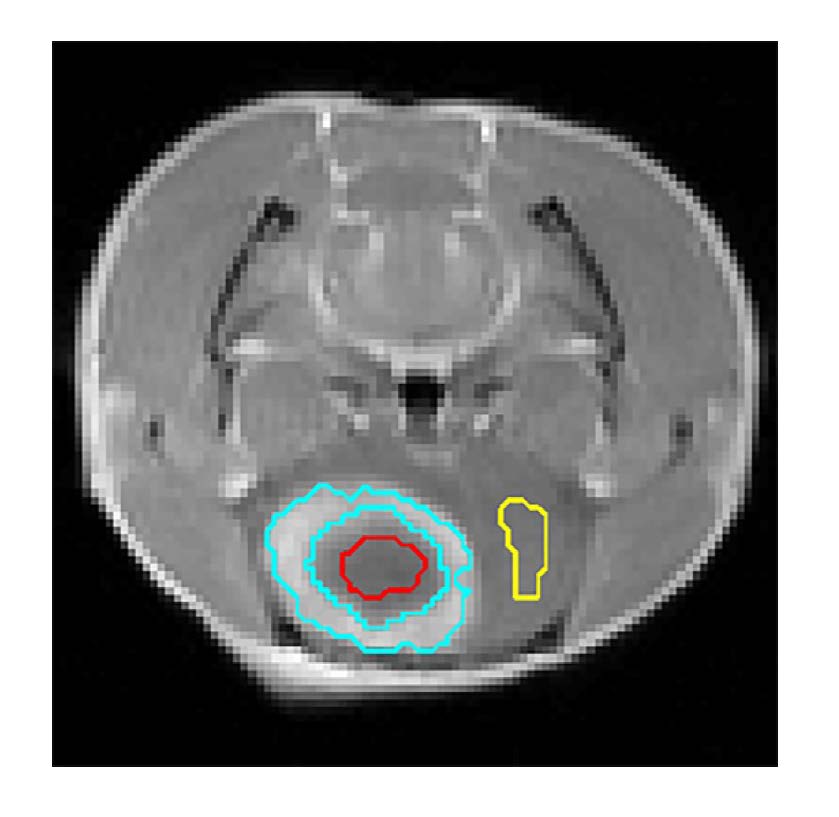
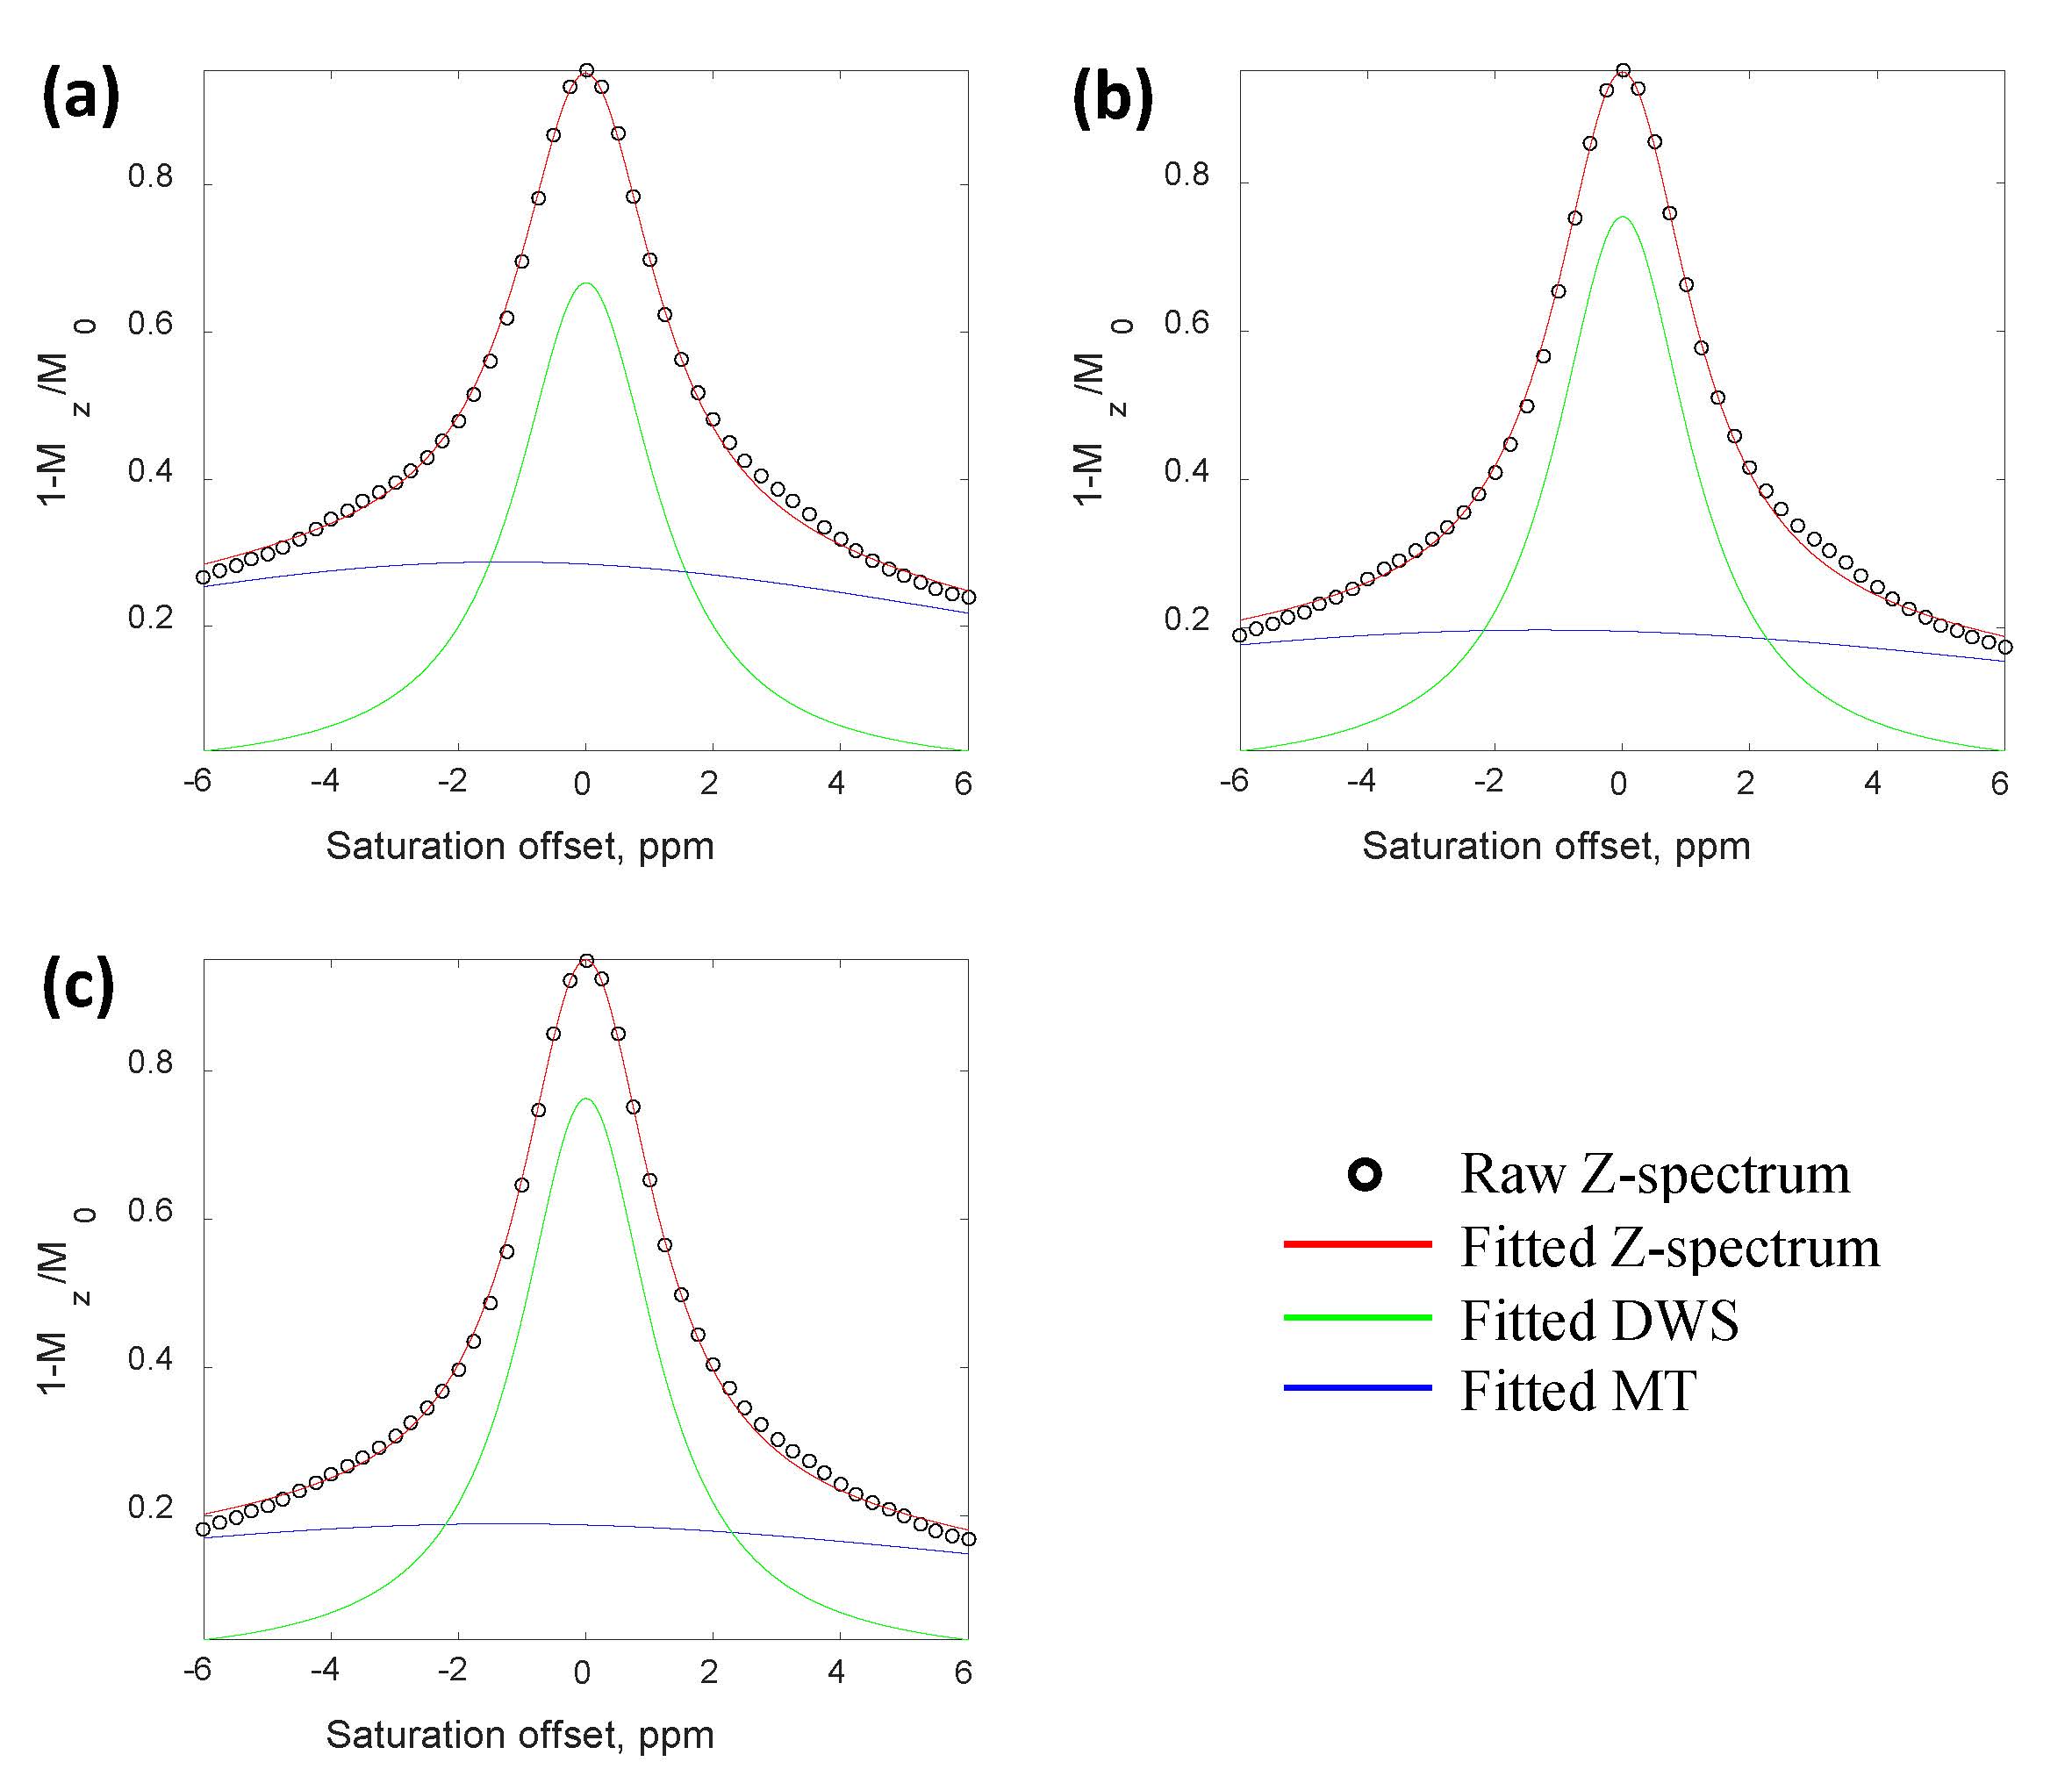
Adult SD rats (n=8) were implanted with C6 glioma cells in the right forebrain, and were irradiated using a small-animal radiation research platform with a dose of 24 Gy at 13 days post-implantation. Four rats were randomly selected and received additional one course of treatment of TMZ (50mg/kg, i.p. for 5 consecutive days and rest for 3 days).4 Then, all the animals underwent multi-parametric MR experiments on a 3 T MRI scanner, including T1 mapping imaging (repetition time (TR) = 8 s, echo time (TE) = 6.5 ms, inversion recovery times (TI) = 0.2, 0.5, 0.8, 1.1 and 1.4 s, number of average (NA) = 1, field of view (FOV) = 64×32 mm2, matrix size = 128×64, thickness = 2 mm), APT imaging (TR = 8 ms, TE = 3.8 ms, NA = 1, FOV = 64×64 mm2, matrix size = 64×64, thickness = 2 mm, RF duration = 15 ms, duty cycle = 0.5, saturation time = 2.4 s, saturation power = 1 μT, frequency range = ±6 ppm with intervals of 0.25 ppm) and Gd-enhanced T1-weighted imaging (TR = 0.35 s, TE = 3.47 ms, NA = 2, FOV = 64×64 mm2, matrix size = 192×192, thickness = 2 mm). Z-spectrum was flipped as 1-Mz/M0 and fitted with a sum of two Lorentzian functions to determine the two dominant contributors of direct water saturation (DWS) and MT.5 The acquired and fitted signals at 3.5 ppm were denoted as Zref and Zlab, respectively. Corrected APT was calculated as (1/Zlab-1/Zref)/T1 to remove the influence of MT, NOE and water longitudinal relaxation.3 Tumor core (hypointense), tumor rim (hyperintense) and contralateral normal regions were manually defined on the Gd-enhanced T1-weighted image (Fig. 1). One-way ANOVA with Bonferroni correction was conducted and P<0.05 was considered statistically significant. H & E stained histological analysis was performed after MR study.Results
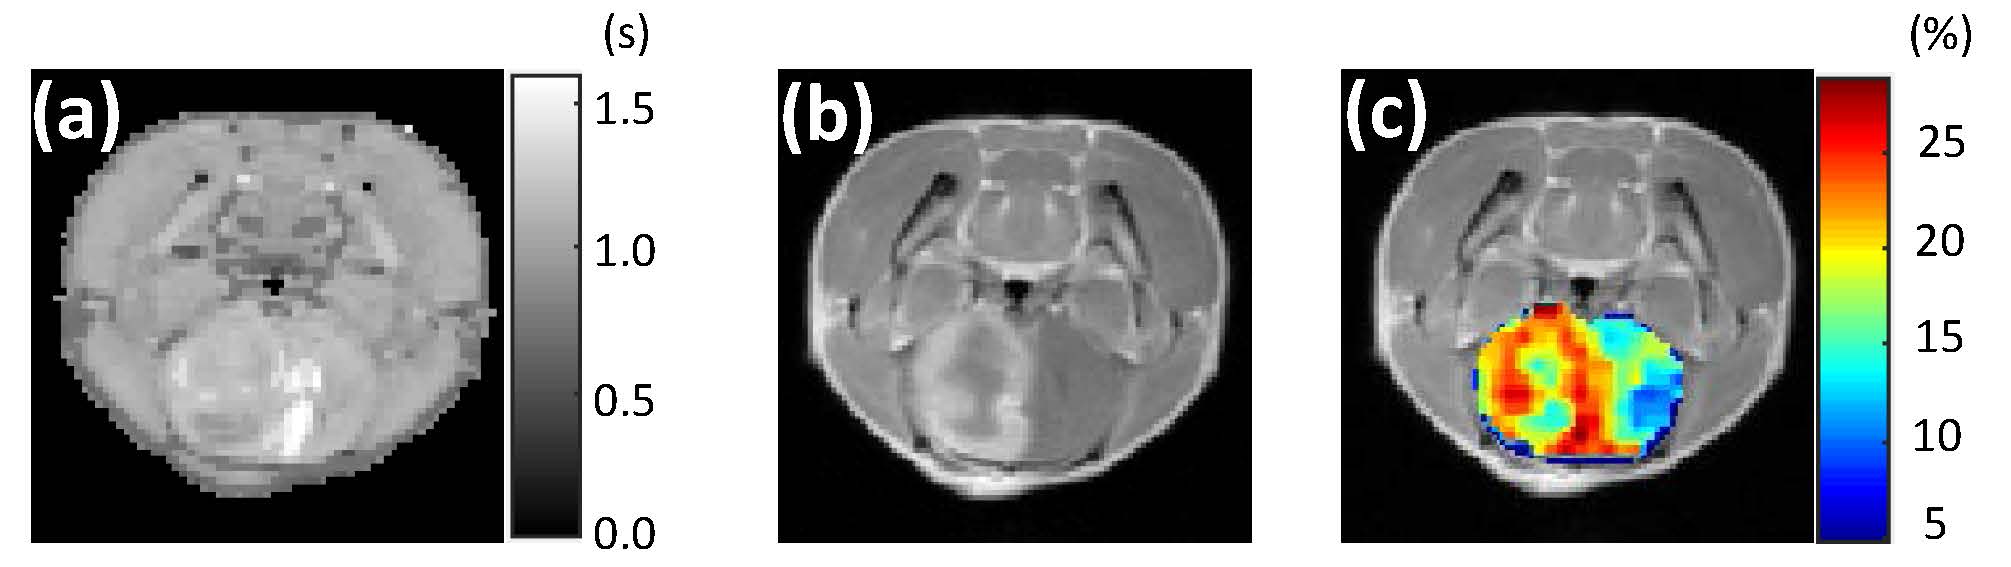
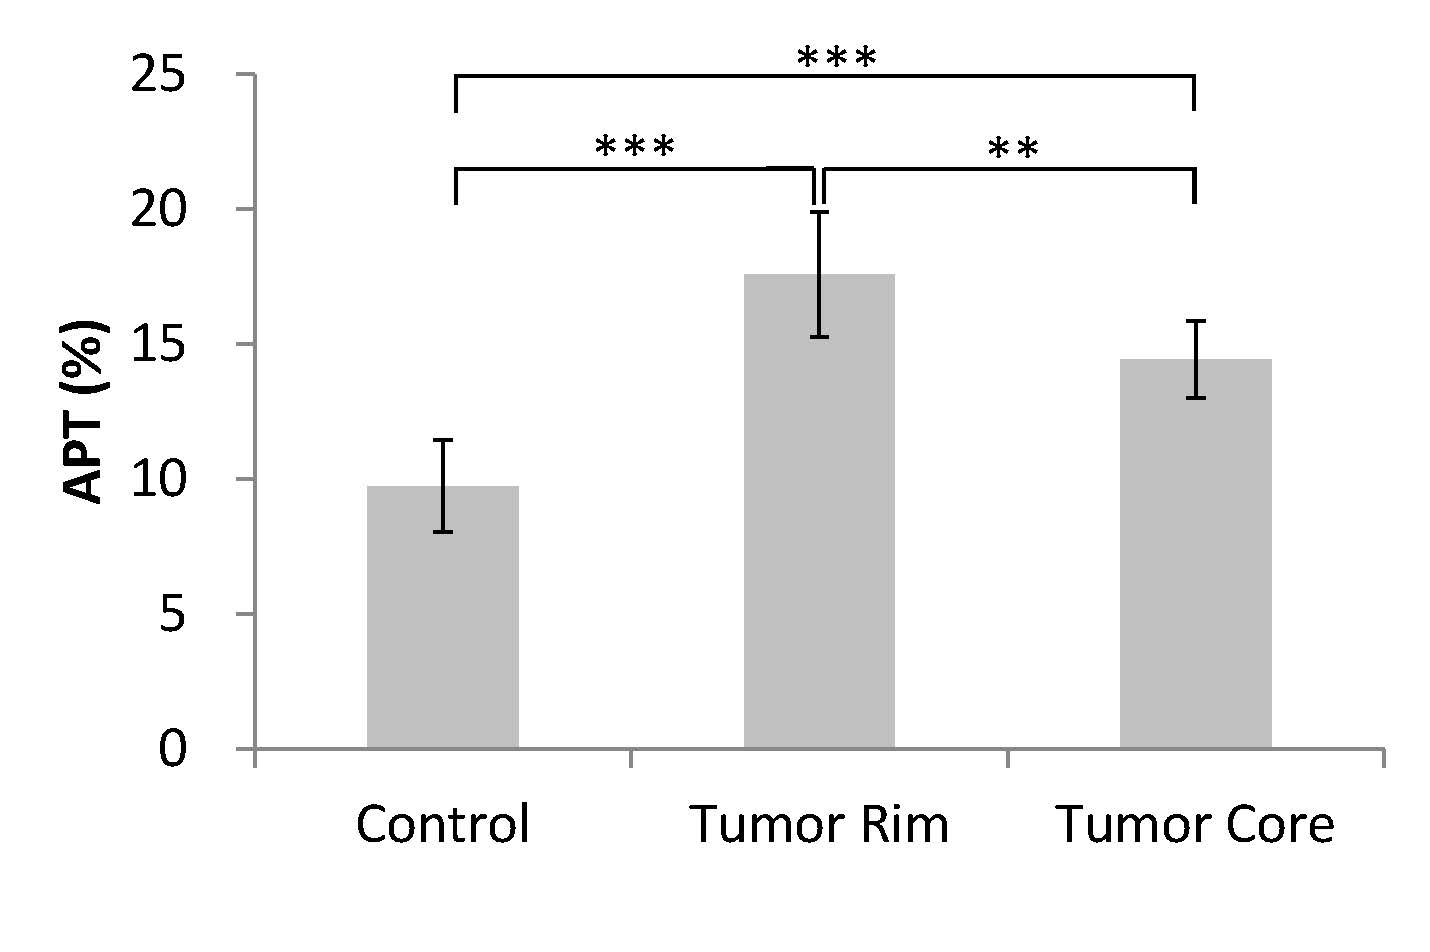
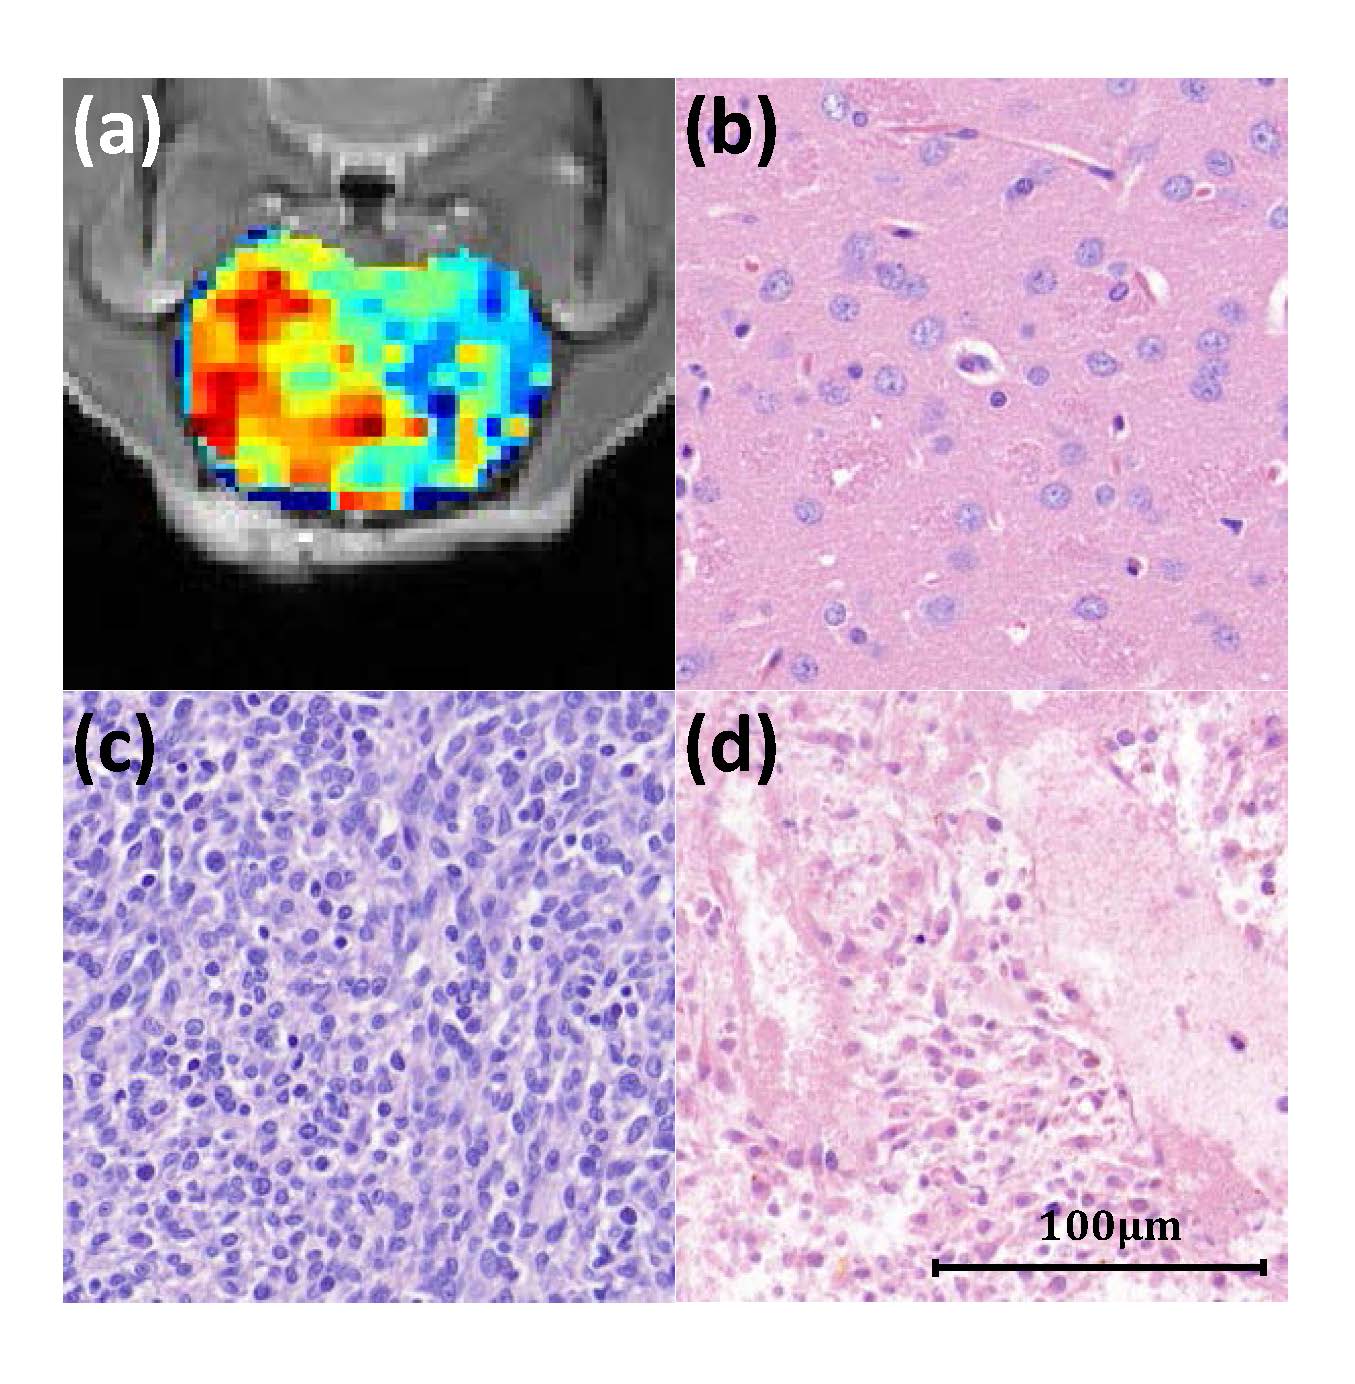
Flipped Z-spectra from tumor core and rim regions as well as respective control area were fitted with a sum of two Lorentzian functions, from which the dominant contributors (i.e. MT and DWS) were determined (Fig. 2). T1 map, Gd-enhanced T1-weighted image and corrected APT map were illustrated in Fig. 3. Glioma tumors post-treatment were observed to present heterogeneous Gd enhancement and APT effects in all animals. Quantitatively, significant difference of APT effect was found across the three regions (P<0.01). Specially, the average APT values in tumor rim (17.6±2.3%) were significantly higher than that in tumor core (14.4±1.4%), both of which were significantly greater than that in the control area (9.7±1.7%) (Fig. 4). The H & E-stained histological sections showed high cellularity and nuclear atypia in the rim of tumor. Relatively greater cellularity and apparent nuclear shrinkage were exhibited in the tumor core compared to normal region, suggesting the existence of both variable tumor cells and radiation necrosis after therapy. The histological results were in good agreement with APT observations (Fig. 5).Discussion
APT has demonstrated to be a novel molecular MRI technique for the detection and characterization of tumors at protein level. We quantified APT effect with removal of the influences of spillover, MT, and T1 effects in the evaluation of therapeutic response in glioma. Validated with histological analysis, the corrected APT is shown to be able to reliably depict tumor heterogeneity post-treatment.Acknowledgements
Financial support from National Basic Research Program of China (2015CB755500), NSFC (81571668), SSTP (GJHZ20160229200622417)References
[1] JY Zhou, E Tryggestad, Z Wen, B lai, T Zhou, R Grossman, S Wang, K Yan, DX Fu, E Ford, B Tyler, J Blakeley, J Laterra, PCM van Zijl. Differentiation between glioma and radiation using molecular magnetic resonance imaging of endogenous proteins and peptides. Nature Medicine 2011;17(1):130-134
[2] K Sagiyama, T Mashimo, O Togao, V Vemireddy, KJ Hatanpaa, EA Maher, BE Mickey, E Pan, AD Sherry, RM Bachoo, M Takahashi. In vivo chemical exchange saturation transfer imaging allows early detection of a therapeutic response in glioblastoma. PNAS 2014;111(12):4542-4547
[3] M Zaiss, J Xu, S Goerke, IS Khan, RJ Singer, JC Gore, DF Gochberg, P Bachert. Inverse Z-spectrum analysis for spillover-, MT-, and T1 -corrected steady-state pulsed CEST-MRI--application to pH-weighted MRI of acute stroke. NMR Biomed. 2014;27(3):240-52.
[4] AK Vellimana, VR Recinos, L Hwang, KD Fowers, KW Li, Y Zhang, et al. Combination of paclitaxel thermal gel depot with temozolomide and radiotherapy significantly prolongs survival in an experimental rodent glioma model. J Neurooncol. 2013;111(3):229-36.
[5] M Zaiss, B Schmitt, P Bachert. Quantitative separation of CEST effect from magnetization transfer and spillover effects by Lorentzian-line-fit analysis of z-spectra. J Magn Reson. 2011;211(2):149-55.
Figures