2228
Metabolic and functional MR imaging probe early response in glioblastoma patients treated with combination antiangiogenic-chemoradiation therapy1Radiology, Massachusetts General Hospital, Boston, MA, United States
Synopsis
Precise assessment of treatment response in glioblastoma during combined antiangiogenic and chemoradiation remains a challenge. In particular, early detection of treatment response by standard anatomical imaging is confounded by pseudo-response or pseudo-progression. Metabolic changes probed by MRSI are more specific for tumor physiology and less confounded by changes in blood-brain barrier permeability.
INTRODUCTION
Assessing treatment response in glioblastoma during combination of antiangiogenic (AA)1 and chemoradiation therapy is challenging due to complex pharmacodynamics of combined treatment. In particular, early detection of treatment response by standard anatomical imaging is confounded by pseudo-response or pseudo-progression2-5. Metabolic changes are more specific for tumor’s true fate and less confounded by changes in blood-brain barrier permeability. We hypothesize that metabolic changes probed by magnetic resonance spectroscopy imaging (MRSI) can stratify patient response early during combination therapy. In addition, combining functional and metabolic imaging can provide comprehensive assessment of patient response to combination treatment.METHODS
A prospective longitudinal imaging study was performed in newly diagnosed glioblastoma patients enrolled in a phase II clinical trial of pan-VEGF blocker cediranib combined to standard chemoradiation. Forty patients were imaged weekly at 3T during six weeks of chemoradiation followed by monthly scans thereafter with an imaging protocol that included MRSI (LASER, TE=45ms)6, dynamic susceptibility contrast MRI, and anatomical MRI. Across serial scans radiological response to therapy was assessed based on changes relative to baseline. Demographics (age), clinical (KPS) and molecular markers (MGMT) were included in the analysis. Overall survival (OS) was used as clinical endpoint, and patients were classified as responders (long OS > 18.2 months) and non-responders (short OS < 18.2 months). LCModel7 and NordicIce8 were used to quantify spectral and perfusion data, respectively. Statistical analysis was performed using receiver operator characteristic (ROC), Cox proportional hazards model and Kaplan-Meier survival plots.RESULTS
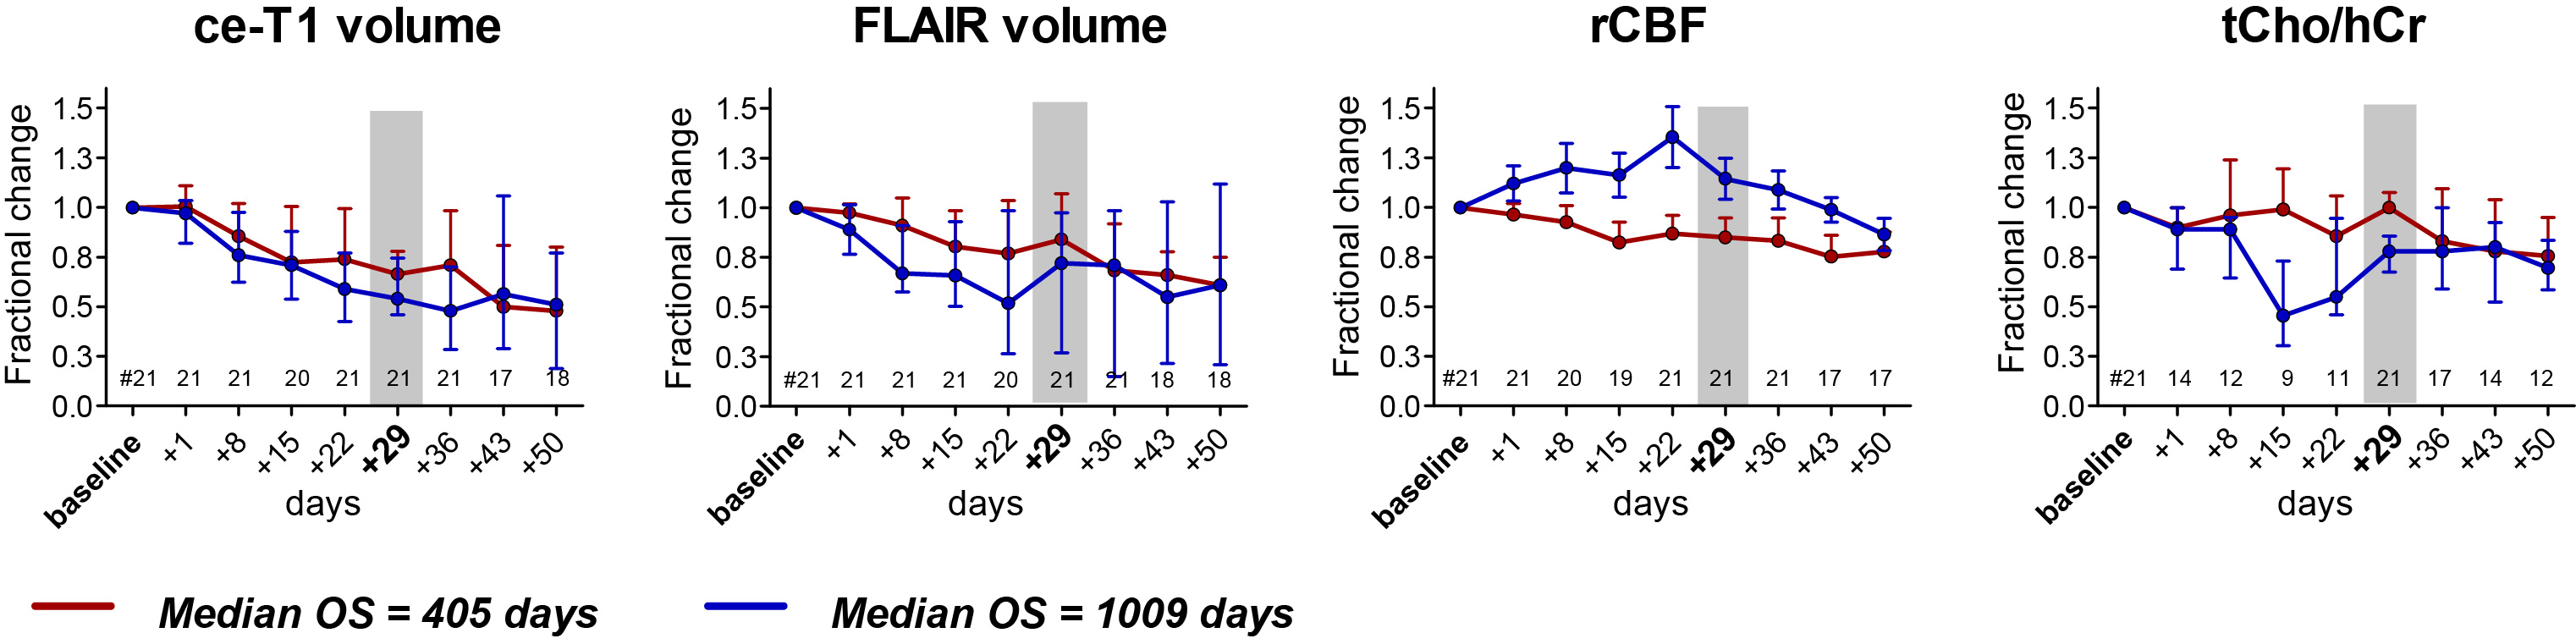
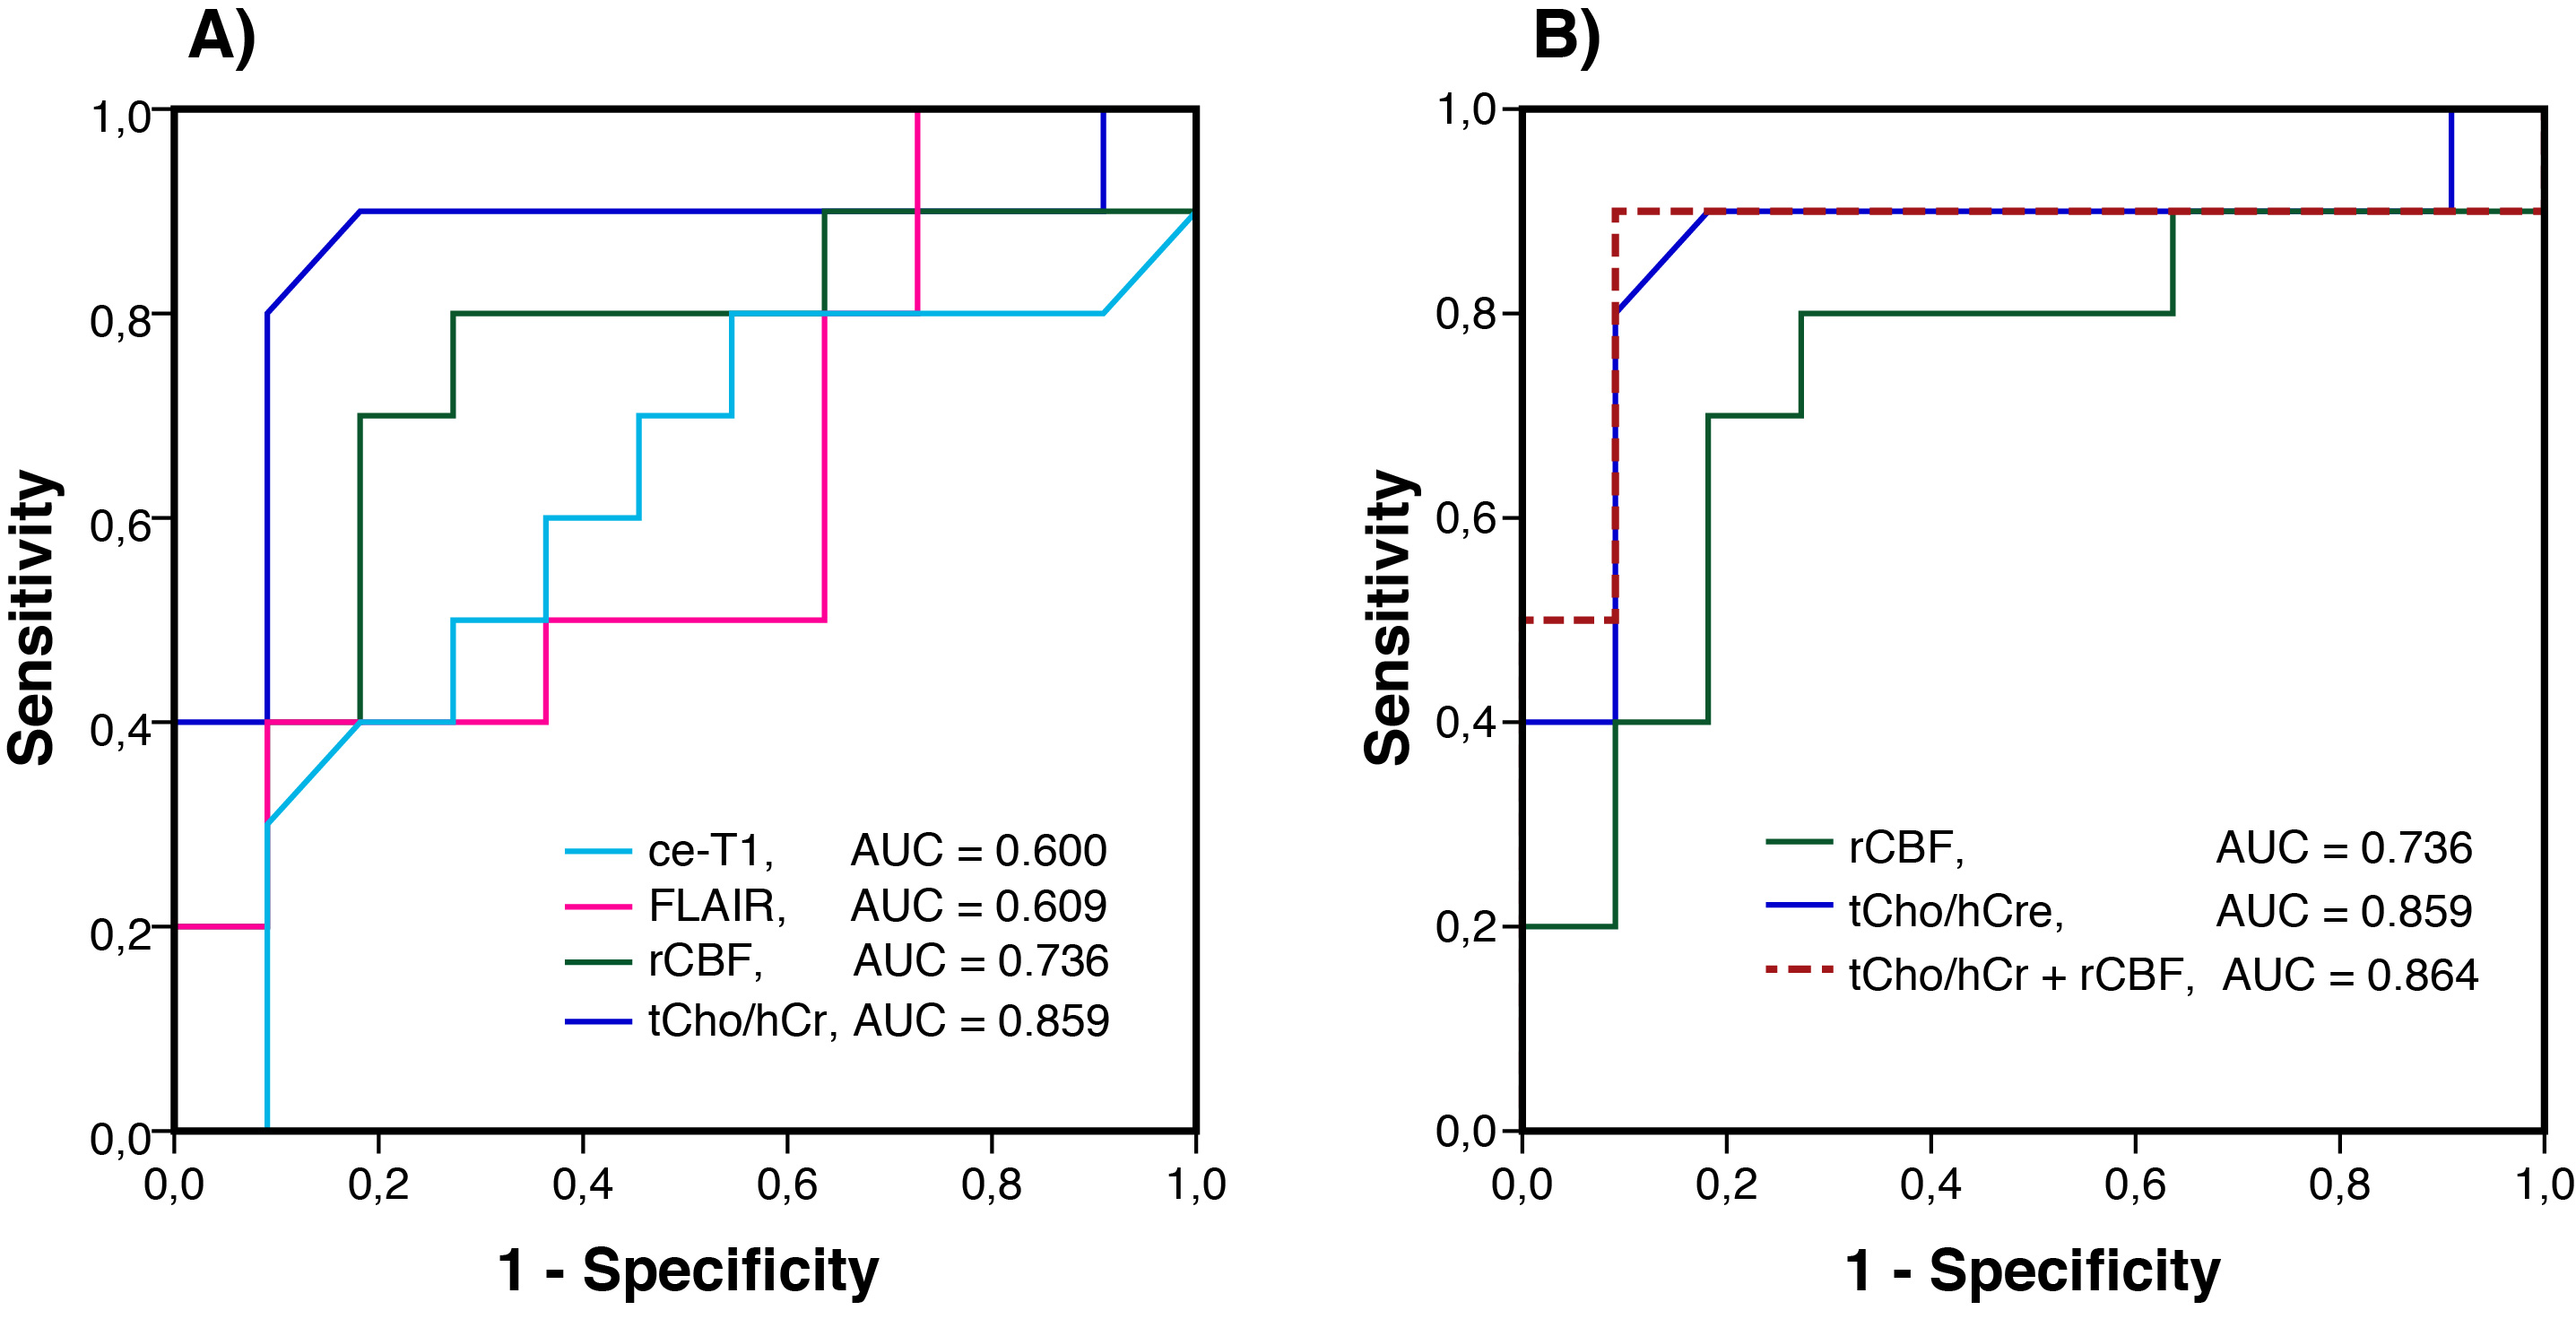
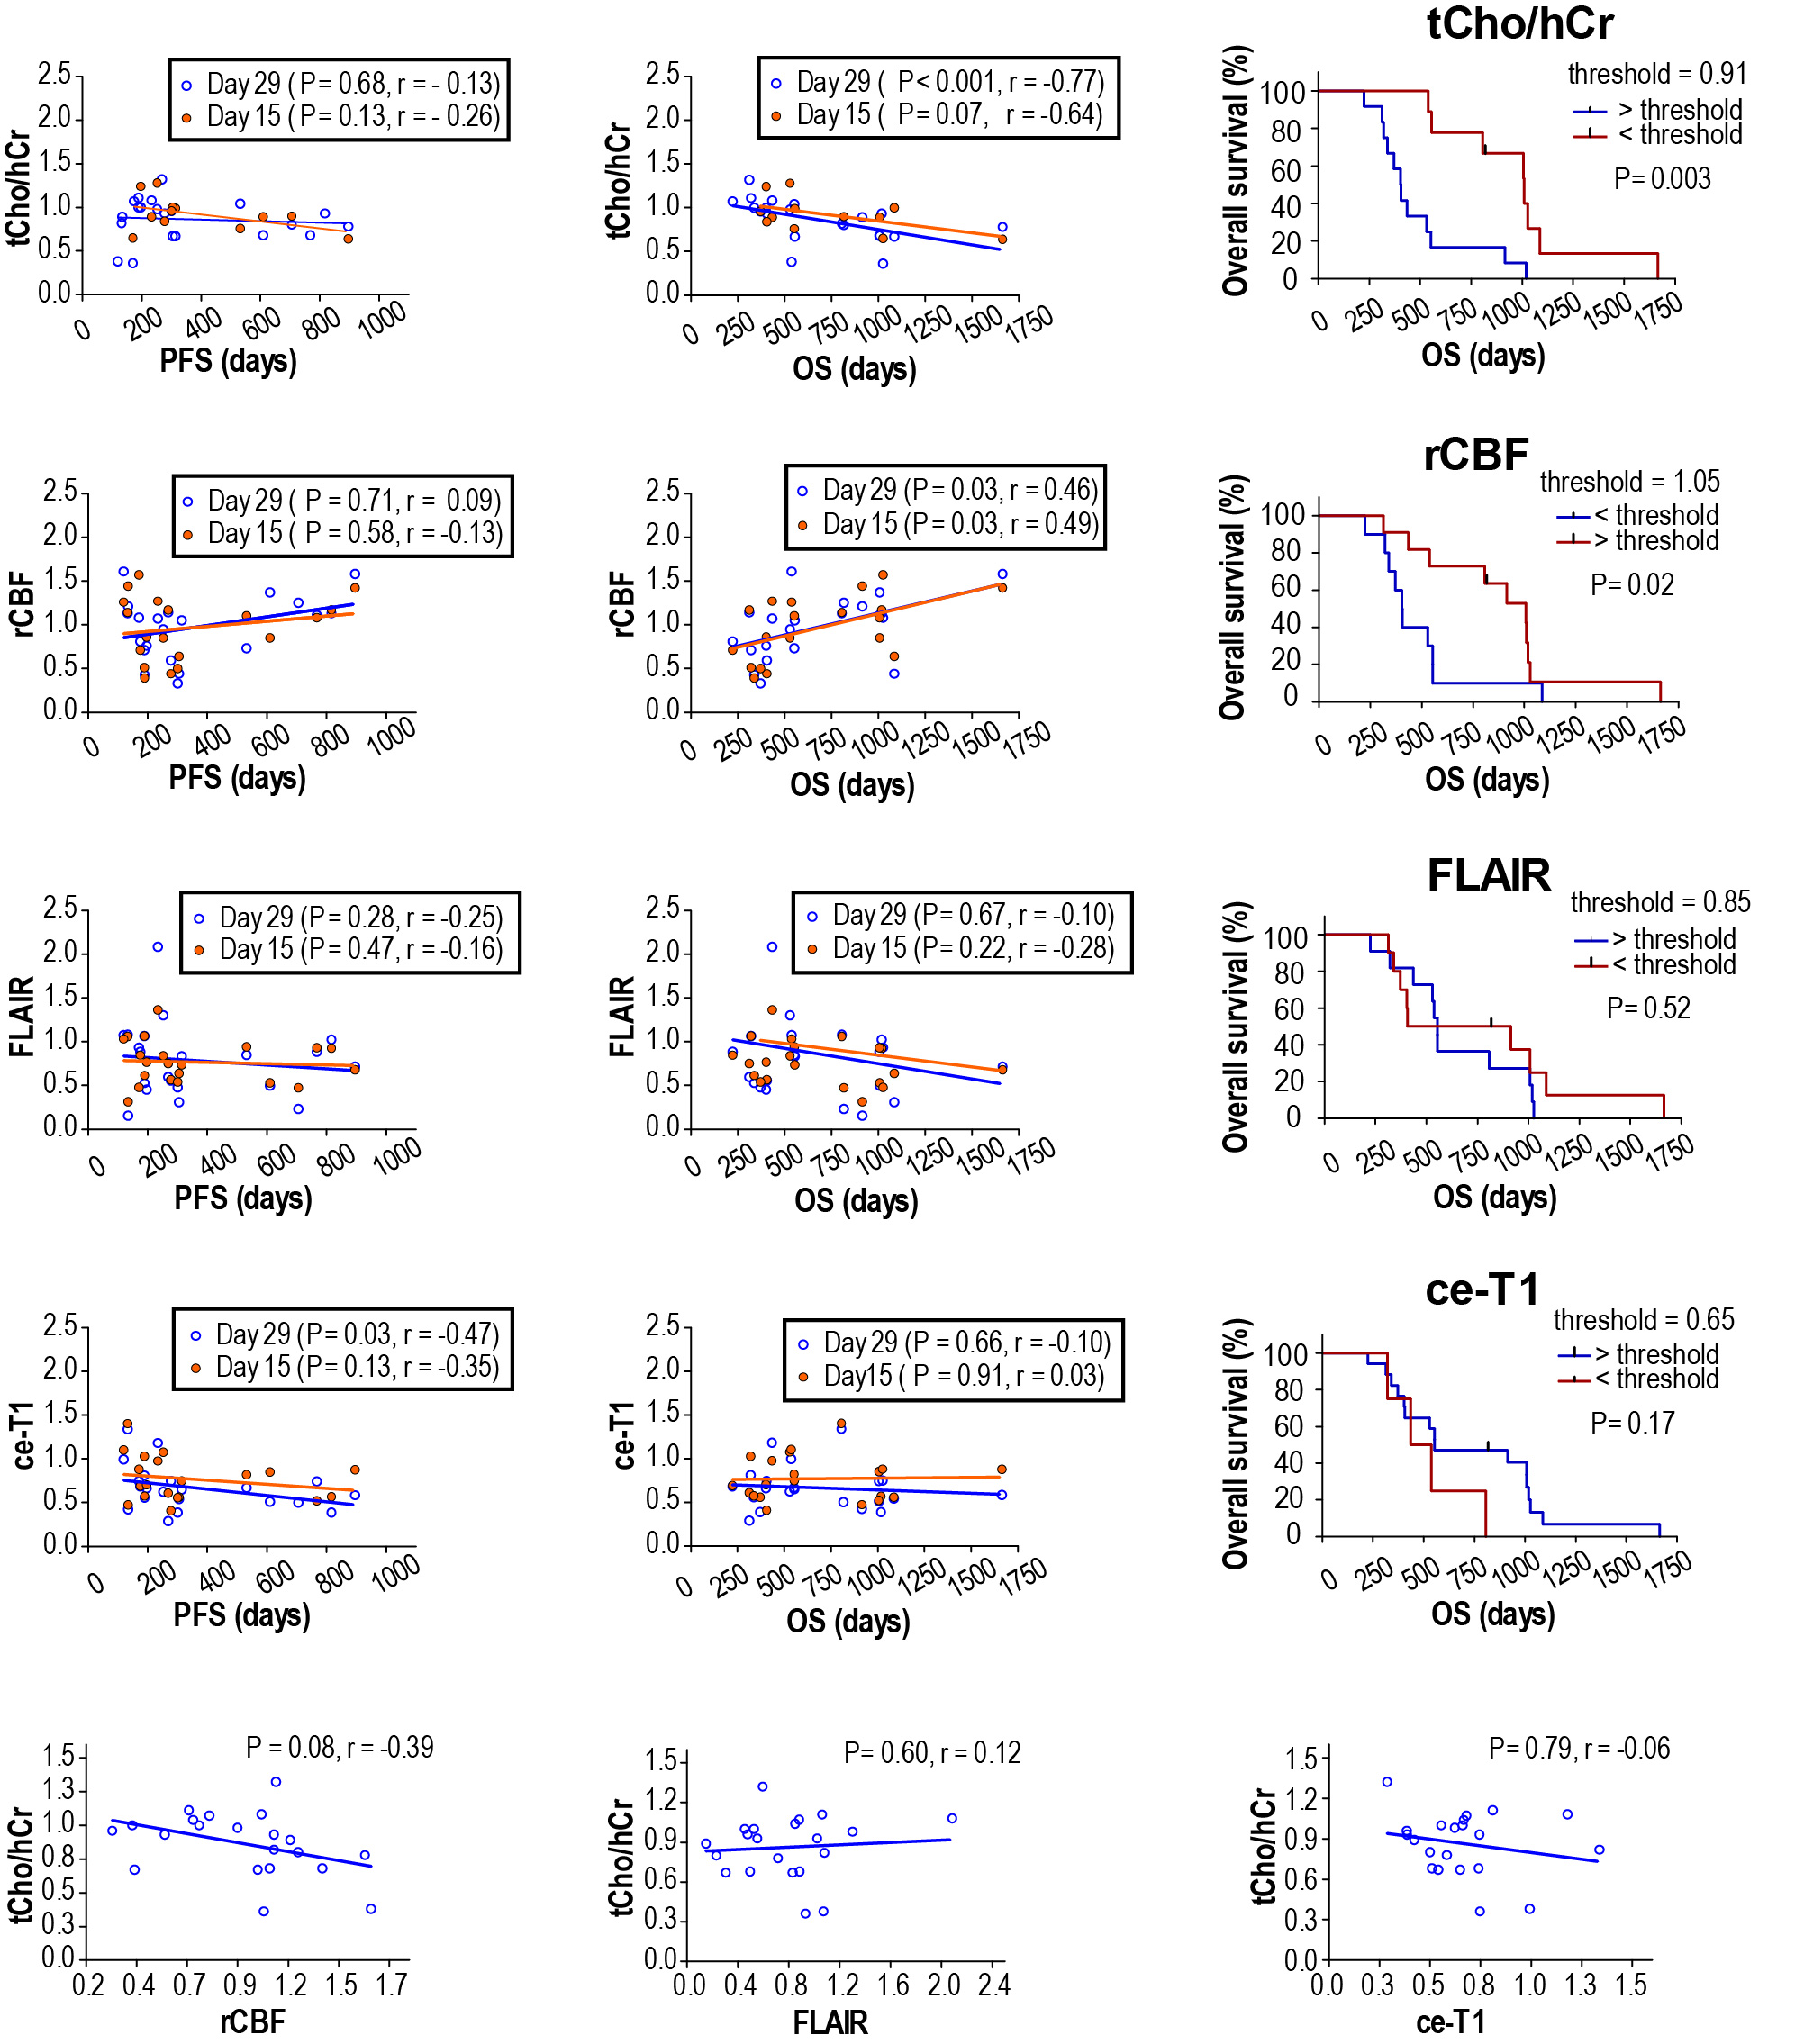
Our imaging study followed the dynamics of tumor response with unprecedented temporal resolution. We found the ratio of total choline to healthy creatine (tCho/hCr) at four weeks relative to baseline best stratified patients in terms of OS, providing: 1) the largest area under curve (0.859) in ROC, 2) the highest hazard ratio (HR = 85.85, P = 0.006) in Cox proportional hazards model, and 3) the most significant separation (P= 0.004) in Kaplan-Meier plots. Inverse relationship was observed between tCho/hCr and cerebral blood flow. There was no statistical significant association between OS and tumor volumetrics derived from contrast enhanced T1 (ce-T1) weighted and FLAIR (Fluid Attenuated Inversion Recovery) anatomical imaging. Multiparametric analysis combining metabolic (tCho/hCr) and functional (rCBF) imaging biomarkers provided the highest sensitivity (0.9) and specificity (0.91) in ROC.DISCUSSIONS
Glioblastoma patients have a dismal prognosis and interventions that improve survival and quality of life are desperately needed. Radiographic endpoints that correlate with clinical endpoints are valuable to provide early prediction of treatment response to maximize patient benefit, reduce toxicity, reduce time and costs of clinical trials. Assessing response of glioblastoma patients is challenging based on ce-T1 and FLAIR anatomical imaging (RANO criteria)9,10, confounded by pseudo-response (antiangiogenic therapy) and pseudo-progression (chemoradiation). In particular, antiangiogenic therapy restores rapidly the leakiness of blood-brain barrier (BBB) reducing contrast leakage and edema probed by ce-T1 and FLAIR, hence these imaging modalities may become decoupled from the evolution of tumor behind restored BBB. MRSI, which probes tumor metabolic profile irrespective of the BBB status, can provide a window into such an “invisible” tumor during early stages of antiangiogenic therapy. Such information may be valuable in understanding the mechanisms of AA therapy, and how it interacts with concomitant standard radiochemotherapy. One hypothesis is that AA drugs act synergistically with standard radiochemotherapy in glioblastoma patients by promoting a functional blood perfusion in the tumor, hence a more efficient delivery of cytotoxic therapy (temozolomide) and oxygen to enhance radiation effects that kill the tumor 8,11,12. Data from our study showing that a decrease of tumor metabolic activity (tCho/hCr) correlates with increased blood perfusion (rCBF) in responsive patients support this synergistic mechanism early during treatment. However, prolonged AA or at high doses may lead to excessive pruning of tumor blood vessels during the late stages of the treatment, which may explain the late decrease of rCBF (Fig. 2). The combined multiparametric index (tCho/hCr + rCBF) is superior to any individual biomarker alone in predicting OS. The combined metabolic-functional index captures the full effect of combined therapy: 1) metabolic biomarker (tCho/hCr) being sensitive to effects of radiochemotherapy, while 2) functional biomarker (rCBF) probes mostly the effects of AA treatment on tumor perfusion.CONCLUSIONS
MRSI metabolic biomarkers can stratify patients early according to their overall survival and provide valuable information to understand the mechanisms of action for combination therapy. In addition, our results raise the possibility that by using metabolic and functional MR imaging to monitor treatment the dosing regimens can be adjusted during the course of treatment to balance the effects of AA and cytotoxic therapy.Acknowledgements
No acknowledgement found.References
1 Sitohy, B., Nagy, J. A. & Dvorak, H. F. Anti-VEGF/VEGFR therapy for cancer: reassessing the target. Cancer Res 72, 1909-1914, (2012).
2 Brandsma, D. et al. Pseudoprogression and pseudoresponse in the management of high-grade glioma : optimal decision timing according to the response assessment of the neuro-oncology working group. Curr Opin Neurol. 22, 633-638. (2009).
3 Clarke, J. L., Chang, S., O'Brien, B. J. & Colen, R. R. Pseudoprogression and pseudoresponse: challenges in brain tumor imaging. Post-treatment imaging changes in primary brain tumors. Curr Neurol Neurosci Rep. 9, 241-246. (2009).
4 O'Brien, B. J., Colen, R. R., Brandsma, D. & van den Bent, M. J. Post-treatment imaging changes in primary brain tumors. Pseudoprogression and pseudoresponse in the treatment of gliomas. Curr Oncol Rep. 16, 397. (2014).
5 Sorensen, A. G., Batchelor, T. T., Wen, P., Zhang, W. T. & Jain, R. K. Response criteria for glioma. Nature Clinical Practice Oncology 5, 634-644 (2008).
6 Andronesi, O. C. et al. Spectroscopic imaging with improved gradient modulated constant adiabaticity pulses on high-field clinical scanners. J Magn Reson 203, 283-293, (2010).
7 Provencher, S. W. Automatic quantitation of localized in vivo 1H spectra with LCModel. NMR Biomed 14, 260-264 (2001).
8 Batchelor, T. T. et al. Improved tumor oxygenation and survival in glioblastoma patients who show increased blood perfusion after cediranib and chemoradiation. Proc Natl Acad Sci U S A. 110, 19059-19064. (2013).
9 Wen, P. Y. et al. Updated response assessment criteria for high-grade gliomas: response assessment in neuro-oncology working group. J Clin Oncol. 28, 1963-1972 (2010).
10 van den Bent, M. J. et al. Response assessment in neuro-oncology (a report of the RANO group): assessment of outcome in trials of diffuse low-grade gliomas. Lancet Oncol. 12, 583-593 (2011).
11 Jain, R. K. Normalization of tumor vasculature: An emerging concept in antiangiogenic therapy. Science 307, 58-62 (2005).
12 Sorensen, A. G. et al. A "Vascular Normalization Index" as Potential Mechanistic Biomarker to Predict Survival after a Single Dose of Cediranib in Recurrent Glioblastoma Patients. Cancer Research 69, 5296-5300 (2009).
Figures