2227
Comparison of native longitudinal relaxation rate, apparent diffusion coefficient, and extravascular extracellular volume fraction in vestibular schwannoma in type 2 neurofibromatosis before and after antiangiogenic therapy1Division of Informatics, Imaging and Data Sciences, The University of Manchester, Manchester, United Kingdom
Synopsis
The relationship between three functional parameters related to cell density, ADC, R1N, and ve, were examined in 12 patients with vestibular schwannomas pre- and post- anti-angiogenic therapy. 3D maps of R1N obtained with variable flip angle images, and ve derived from DCE-MRI were compared to 3D maps of ADC. The tumor mean values of ADC, R1N and ve showed correlation to each other before bevacizumab treatment. This correlation was lost after three-months of treatment. Both R1N and ADC displayed power in prediction of treatment. R1N showed more sensitive to anti-angiogenic therapy induced changes in VS than ADC or ve.
Purpose
The apparent diffusion coefficient (ADC), the native longitudinal relaxation rate (R1N), and the extravascular extracellular volume fraction (ve) are three related parameters, which are affected by tumor cell density and water content in the tissue.1,2 Investigating their relationship and treatment-induced changes in their relationship will lead to better understanding the three parameters as imaging biomarkers for cancer treatment response. In this study, we compare the three parameters for patients with vestibular schwannomas (VS) treated with bevacizumab.Methods
12 patients with type 2 neurofibromatosis (NF2) related VS were imaged on a 1.5-T Philips Achieva scanner. Patients were treated with the anti-vascular endothelial growth factor antibody, bevacizumab, 5 mg/kg every 2 weeks. The patients received scans before and three-month after treatment. Dynamic contrast-enhanced (DCE) MRI was performed using a low dose (0.02 mmol/kg) high temporal resolution (LDHT) technique.3 Data were analyzed with the extended Tofts model to allow measurement of contrast transfer coefficient (Ktrans), blood plasma fraction (vp), and extravascular extracellular space fraction (ve). R1N was measured using a variable flip angle technique. ADC was calculated from diffusion-weighted imaging. Longitudinal co-registration was performed for all scans for each participant. The ADC volume maps, 3D-VFA series and images from the LDHT-DCE 4D dynamic series from each visit were co-registered to one pre-contrast high spatial resolution DCE 3D data set acquired on day zero. VSs were segmented using a semiautomatic segmentation program (SX plugin for Osirix, Segmentix, Fr). The results of segmentation were reviewed and, where necessary, edited by an experienced neuroradiologist (A.J.). Average values were then derived from the 3D region of interest (ROI). The changes in the tumor mean values in ADC, R1N, and ve over the course of bevacizumab treatment were compared. The 20 VSs were divided into two groups: responders (Res.) and nonresponders (Non.). Response was defined as a volume reduction exceeding 0.125 cm3 or a relative volume decrease exceeding 5%.Results
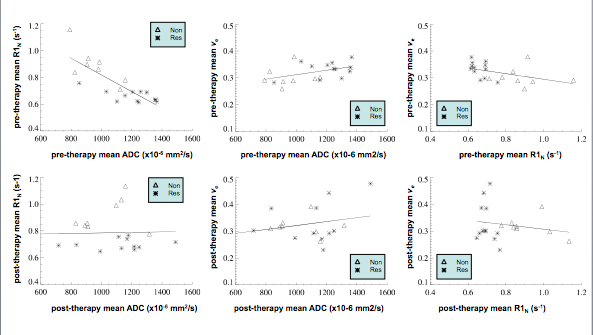
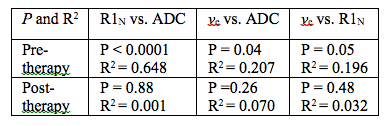
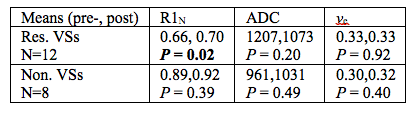
20 VSs from the 12 patients were analyzed. Fig. 1 demonstrates linear regression analysis of the relationship between each pair of the ADC, R1N and ve mean tumor values pre- and post-therapy. The results from the linear regression analysis (R2 and P-value) are listed in Table 1. Pre-treatment mean ADC and R1N showed a strong correlation (R2 = 0.648, P < 0.0001) between the 2 parameters. ADC and ve, and R1N and ve showed a weak correlation respectively. However, these correlations were lost following bevacizumab therapy. The difference in mean parameter values pre- and three month post-therapy was tested with the paired t-test (Table 2). Only R1N showed significant difference pre- and post-therapy in the responder group.Discussion
The tumor mean values of ADC, R1N and ve showed correlation to each other before bevacizumab treatment. The correlation lost three-month after treatment. Both R1N and ADC displayed power in prediction of treatment.3 R1N showed more sensitive to anti-angiogenic therapy induced changes in VS than ADC and ve.Conclusion
This study may provide useful information for better understanding of R1N, ve and ADC as imaging biomarkers for cancer treatment response in vestibular schwannomas over the course of bevacizumab treatment.Acknowledgements
No acknowledgement found.References
1. Anderson A, Xie J, Pizzonia J, et al. Effects of cell volume fraction changes on apparent diffusion in human cells. MRI. 2000; 18:689-695.
2. Fung B. Correlation of relaxation time with water content in muscle and brain tissues. Biochim Biophys Acta.1977; 497:317-322.
3. Li K, Djoukhadar I, Zhu X, et al. Vascular biomarkers derived from dynamic contrast-enhanced MRI predict response of vestibular schwannoma to antiangiogenic therapy in type 2 neurofibromatosis. Neuro Oncol. 2015; 0:1-8.
Figures