2225
Tumor progression prediction in high grade glioma using multimodal image analysis and random forest machine learning1German Cancer Consortium (DKTK), Heidelberg, Germany, 2Translational Radiation Oncology, National Center for Tumor Diseases (NCT), German Cancer Research Center (DKFZ), Heidelberg, Germany, 3Heidelberg Institute of Radiation Oncology (HIRO), National Center for Radiation Research in Oncology (NCRO), Heidelberg, Germany, 4Heidelberg Ion-Beam Therapy Center (HIT), Department of Radiation Oncology, Heidelberg University Hospital, Heidelberg, Germany
Synopsis
Tumor delineation in radiotherapy planning of high grade glioma is challenging due to infiltrative growth patterns and physiological tumor heterogeneity. We used random forest machine learning to classify tissue types and predict tumor progression based on parameters derived from multi-modal functional and metabolic imaging. In an integrative approach, eight patients with recurrent high grade glioma were investigated retrospectively, and the resulting predicted tumor volumes were compared to standard T1 weighted contrast-enhanced MRI based segmentations. Predictions of tumor tissue could identify original tumor volumes well and yielded promising results with respect to tumor progression in terms of sensitivity and specificity.
Purpose
Therapy failure with subsequent tumor progression is a common problem in radiotherapy of high grade glioma (HGG)1, as these tumors present with rapid growth, physiological heterogeneity and strong infiltration into the surrounding healthy brain tissue. Current standard definition of radiotherapy target volumes is based on CT and contrast enhanced T1 weighted MRI. However, this approach is limited with respect to uncertainties concerning tumor outlines. The goal of the presented work was to improve target delineation by assessment of tumor physiology and prediction of tumor progression with multimodal image analysis. In an integrative approach we used random forest machine learning2 to associate each image voxel with a tissue type, based on a set of feature parameters derived from functional and metabolic imaging.Methods
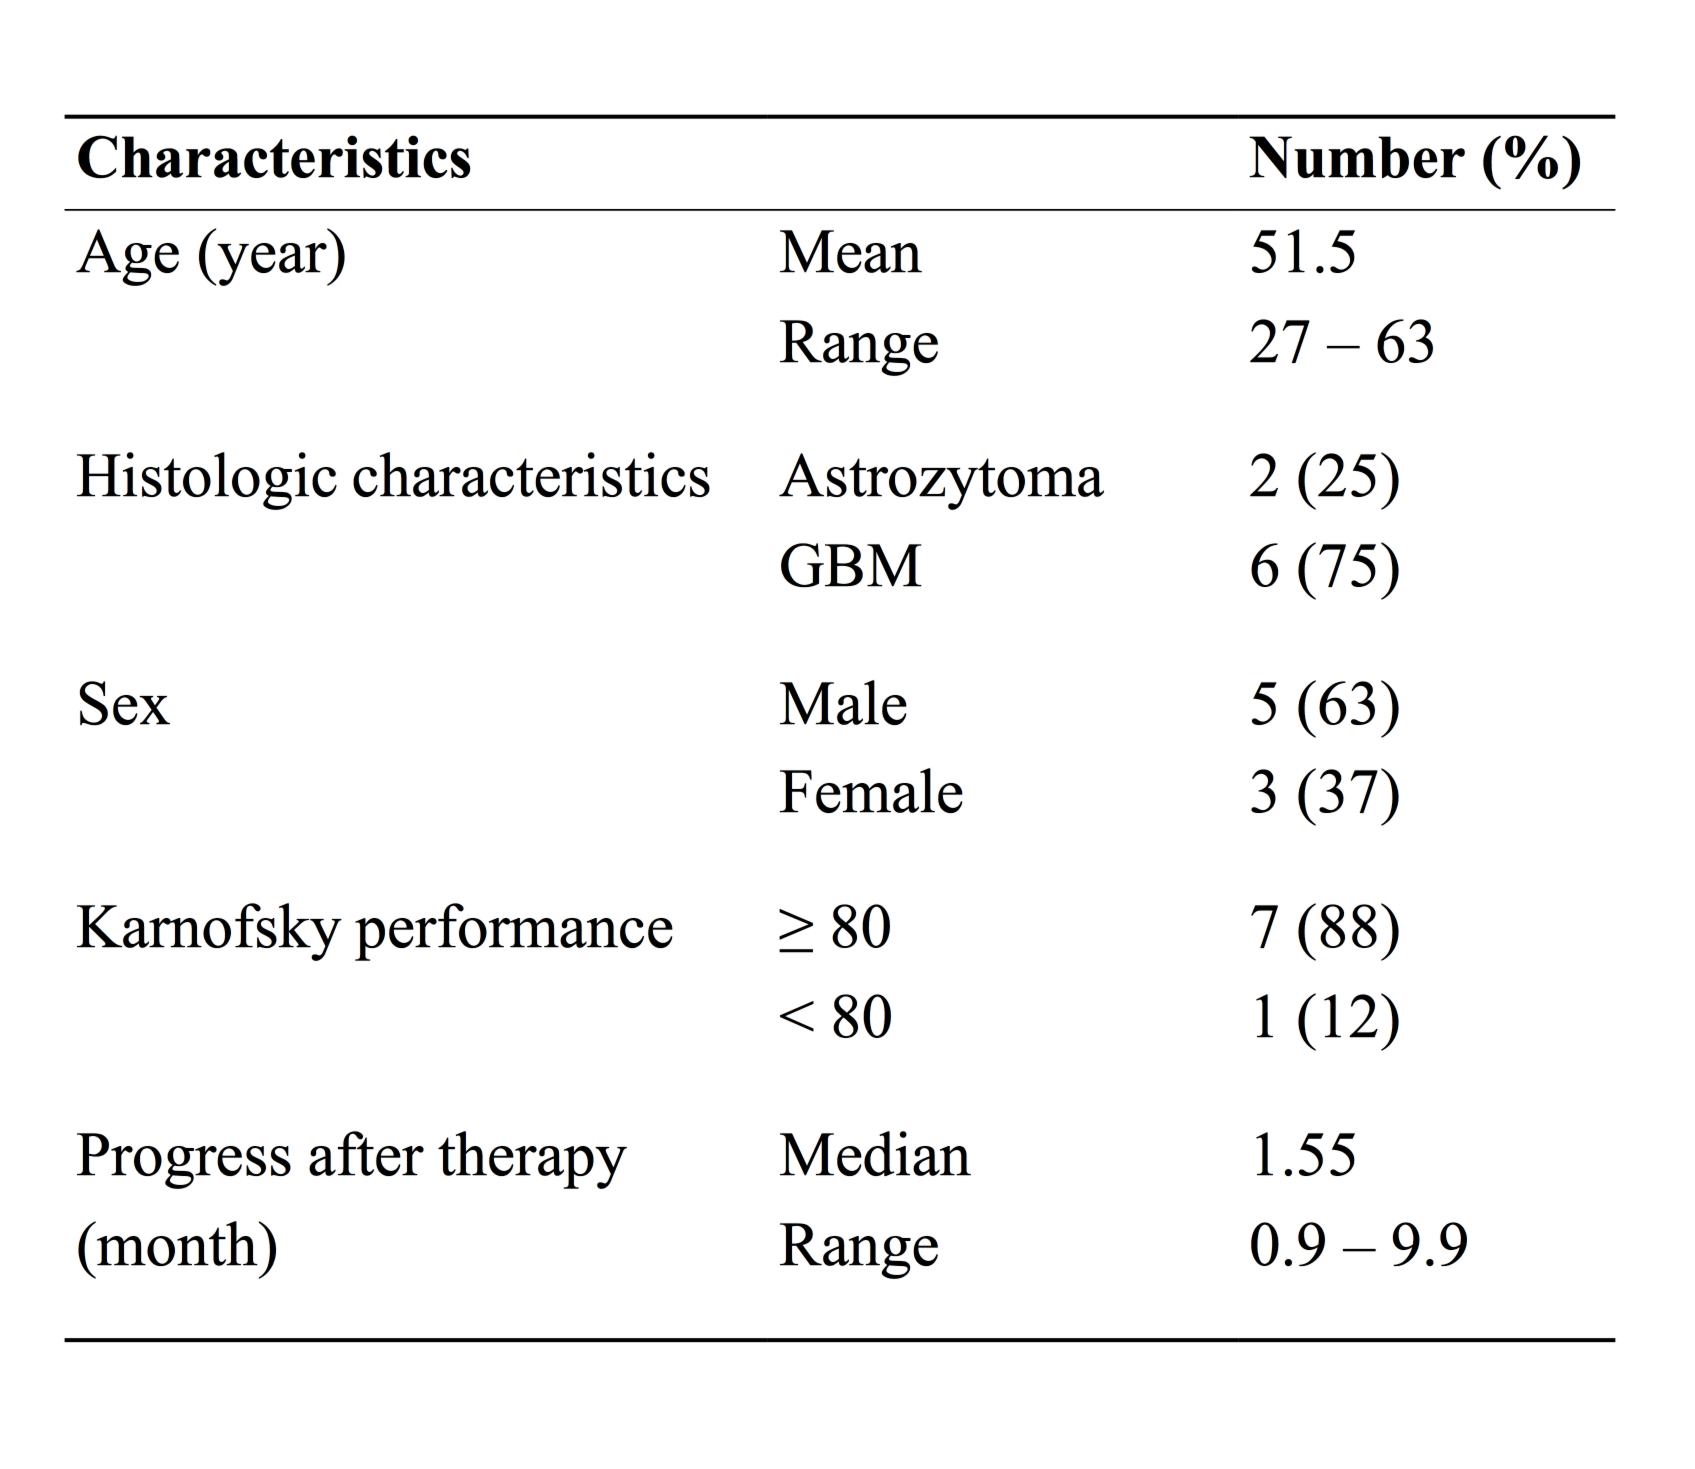
Eight patients with recurrent HGG were investigated retrospecitvely. Clinical characteristics are presented in figure 1. All patients underwent carbon ion irradiation at our center3. No surgical resection was performed, which simplified identification of voxels between time-points. Patients showed progression of disease during follow-up.
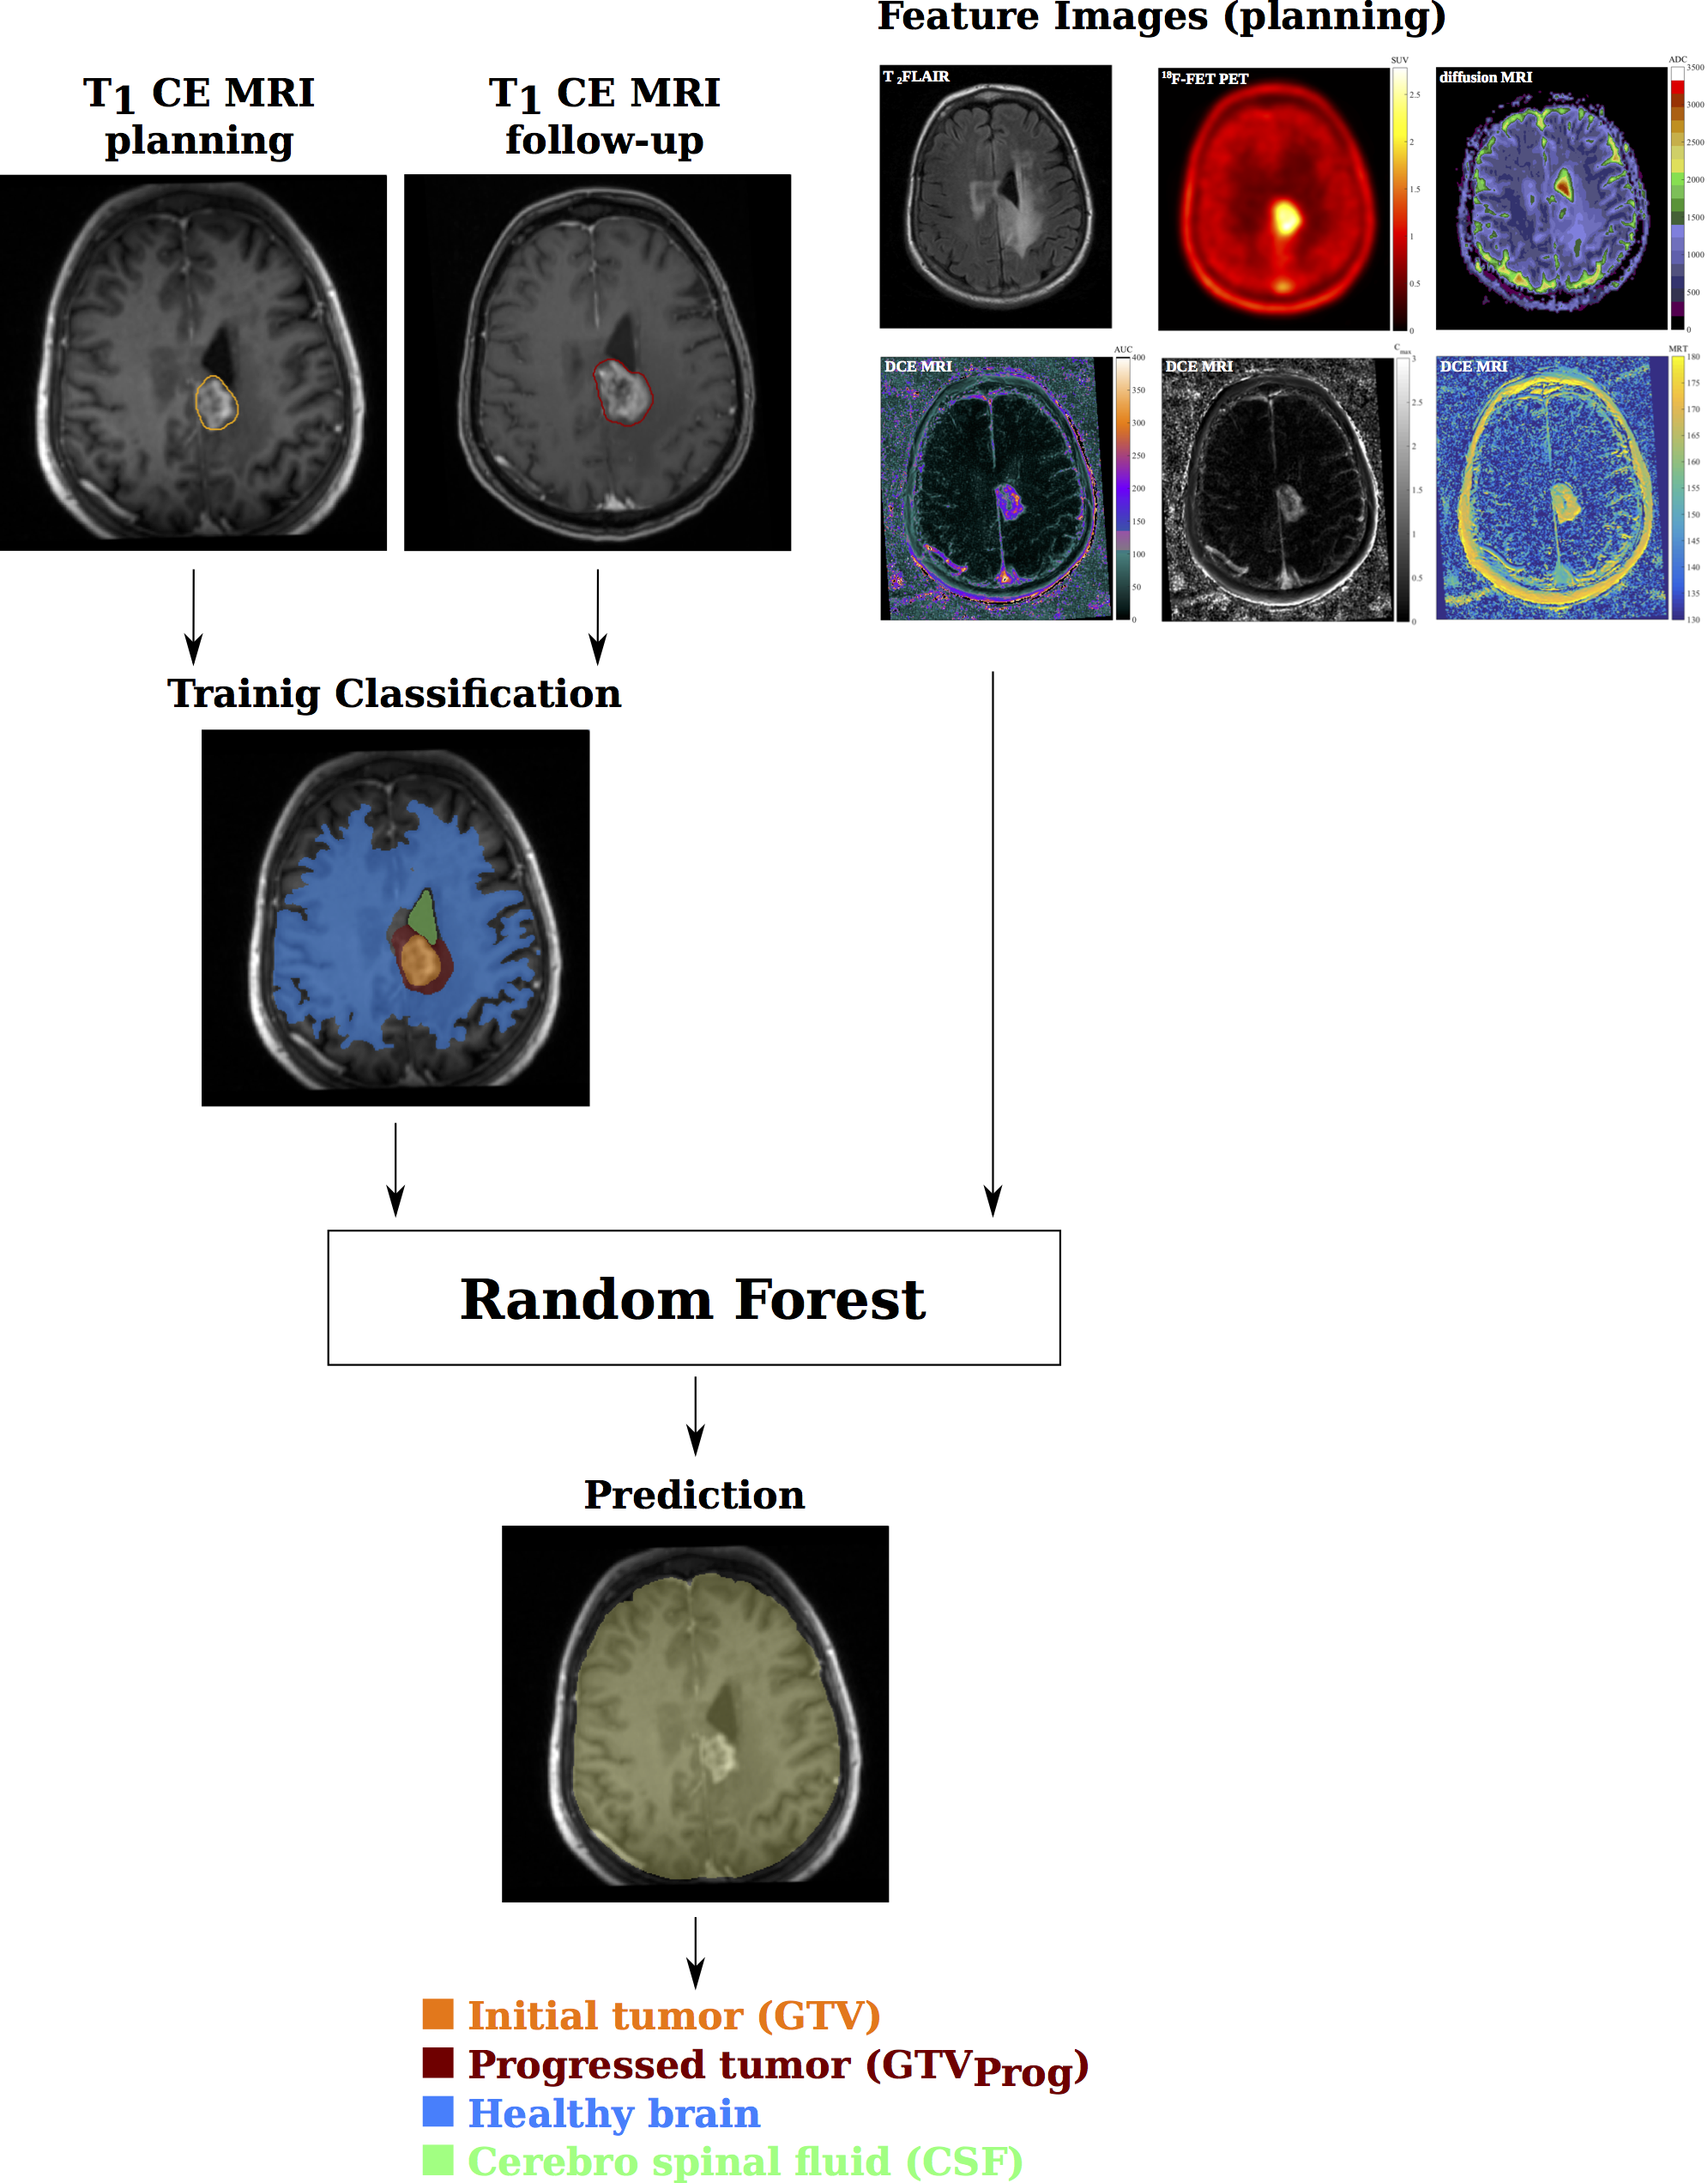
The Medical Imaging Interaction ToolKit4 was used to develop a pipeline for tissue classification with random forests5 based on multimodal imaging. The workflow for training and prediction of the random forest is illustrated in figure 2. The original initial tumor volume was derived from the radiotherapy gross tumor volume (GTV). The progress volume (GTVprog) was contoured based on the progress confirming follow-up MRI by a radiotherapist. A training classification was derived by associating each image voxel with either one of the following labels:
- Cerebrospinal fluid
- Healthy brain
- Tumor before radiotherapy (GTV)
- Progress after radiotherapy (GTV \ GTVProg)
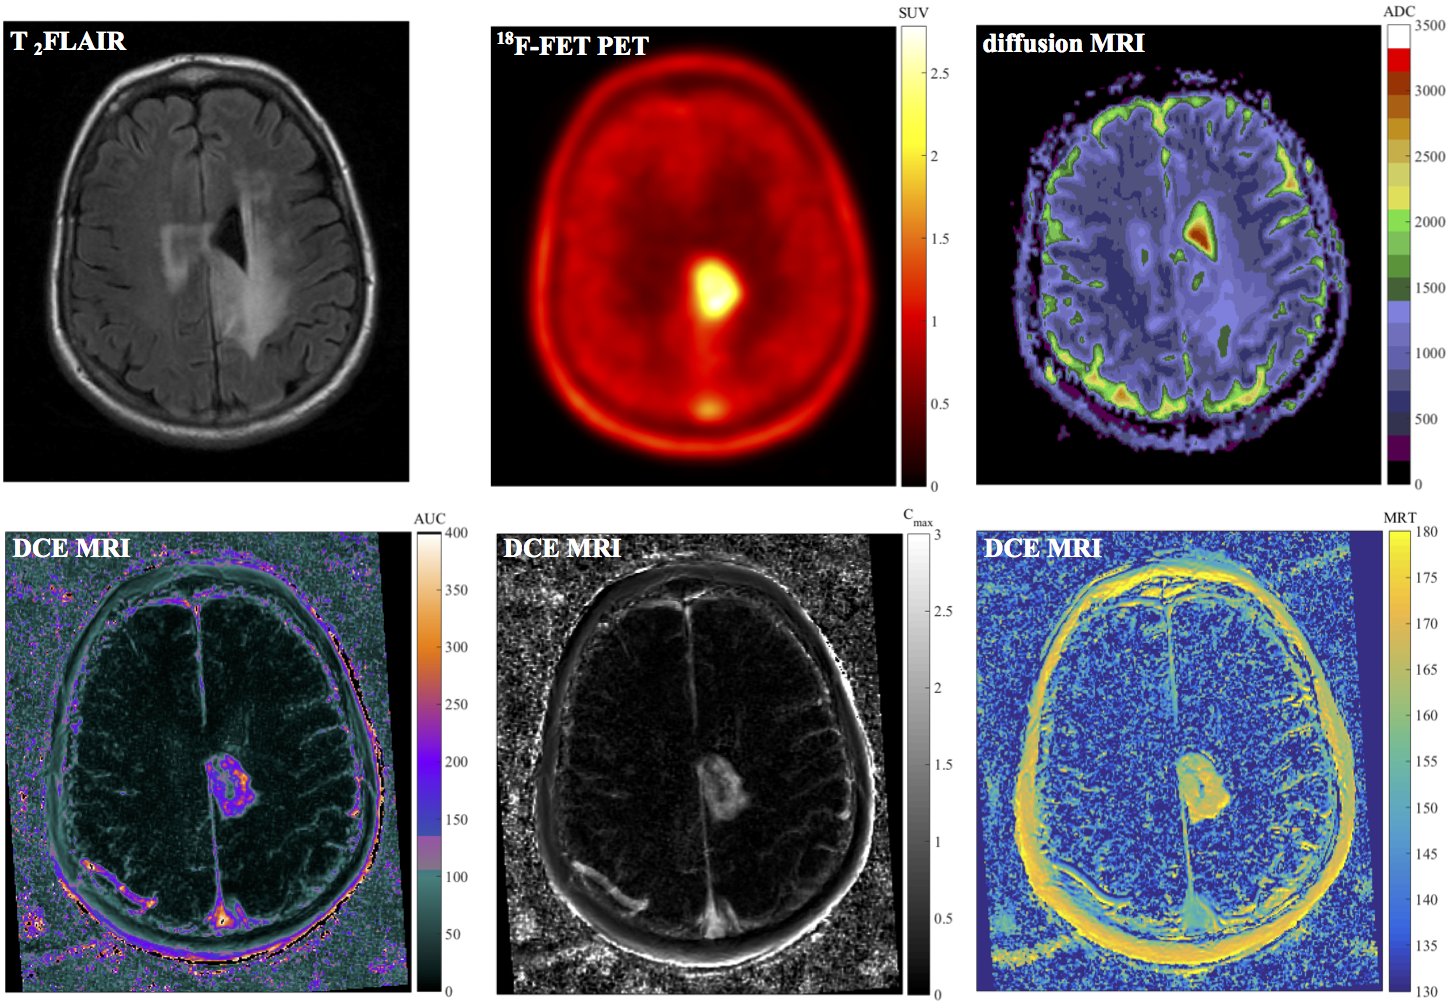
For classification features, focus was set on the physiological imaging modalities shown in figure 3, including T2 FLAIR MRI, diffusion MRI ADC maps, parameters derived from non-compartmental DCE-MRI (area-under-curve, mean-residence-time, maximum concentration), 18F-FET PET SUV and irradiated dose. Patients were analyzed in a leave-one-out manner, by training the forest based on images of seven patients and predicting tissue classification in the 8th patient. In the following, the predicted initial tumor before therapy is denoted as initial tumor mass ITMPred, whereas the predicted progress (GTV + progression after therapy) is referred to as progress tumor mass PTMPred. Prediction volumes Vpred were evaluated by calculating the intersection with the MRI based contours VGTV. Two parameters were defined for quantitative analysis: $$Sensitivity = \frac{V_{pred} \cap V_{GTV}}{V_{GTV}} $$ $$Specificity = \frac{V_{pred} \cap V_{GTV}}{V_{Pred}} $$
Results
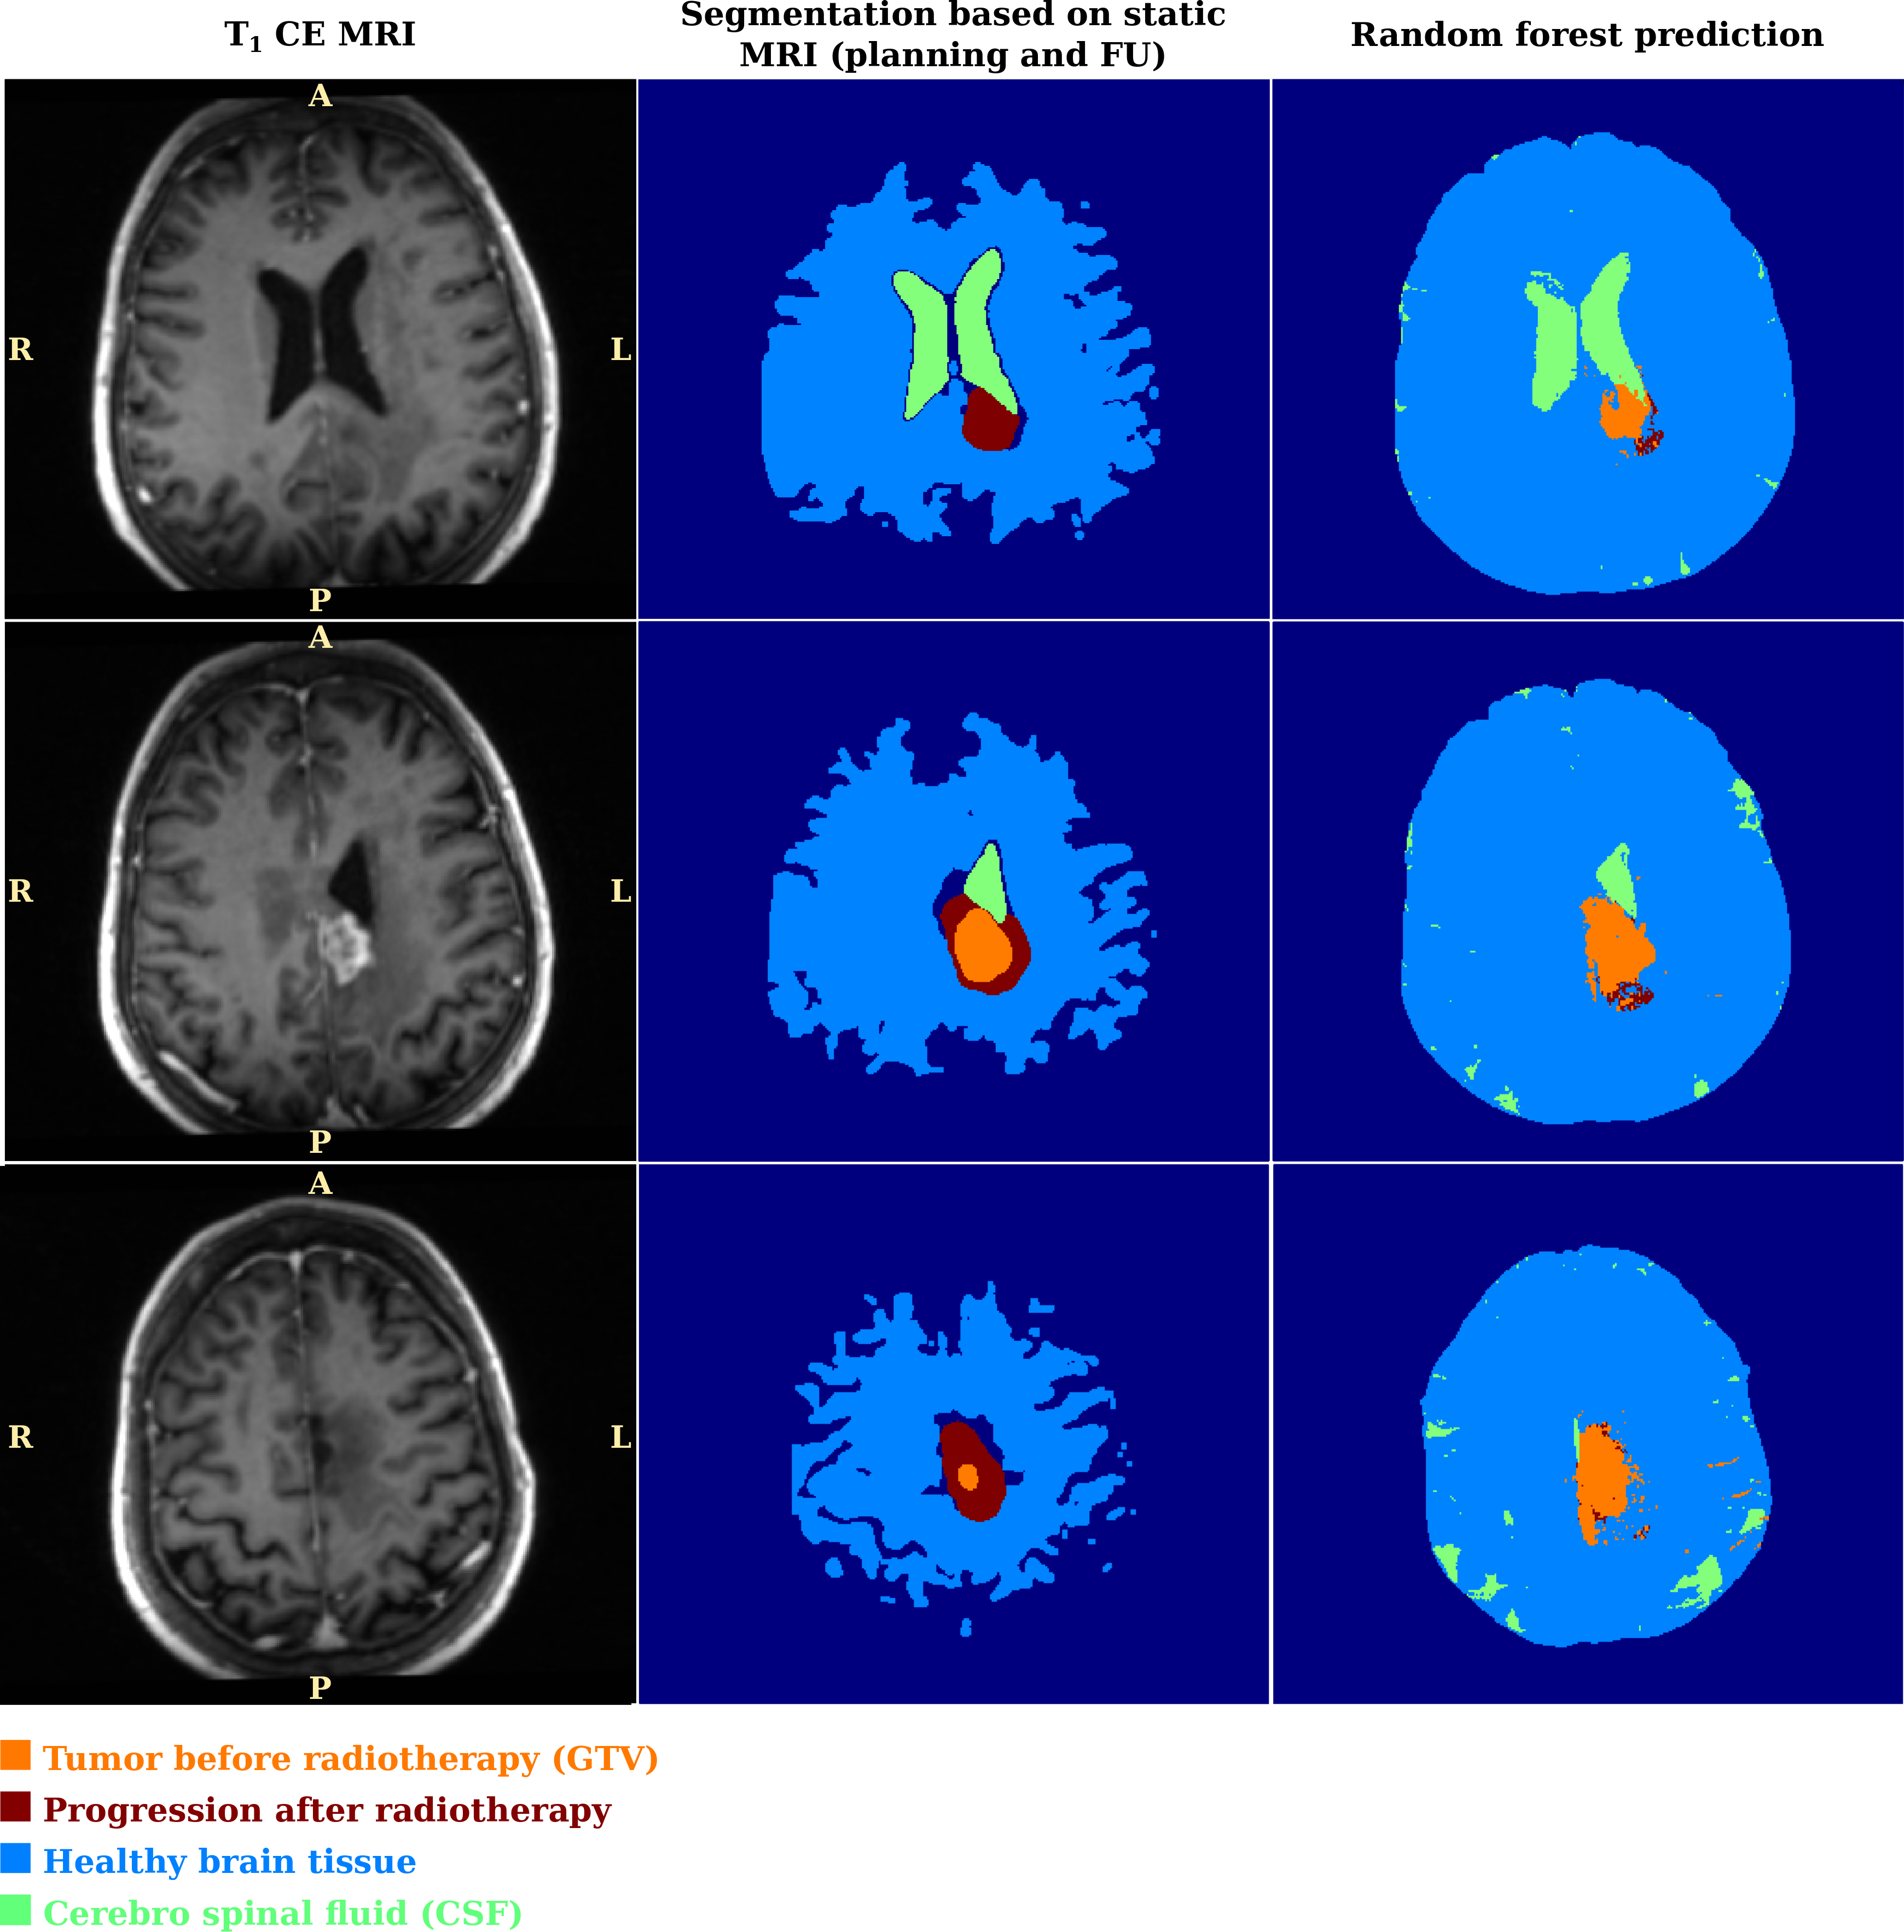
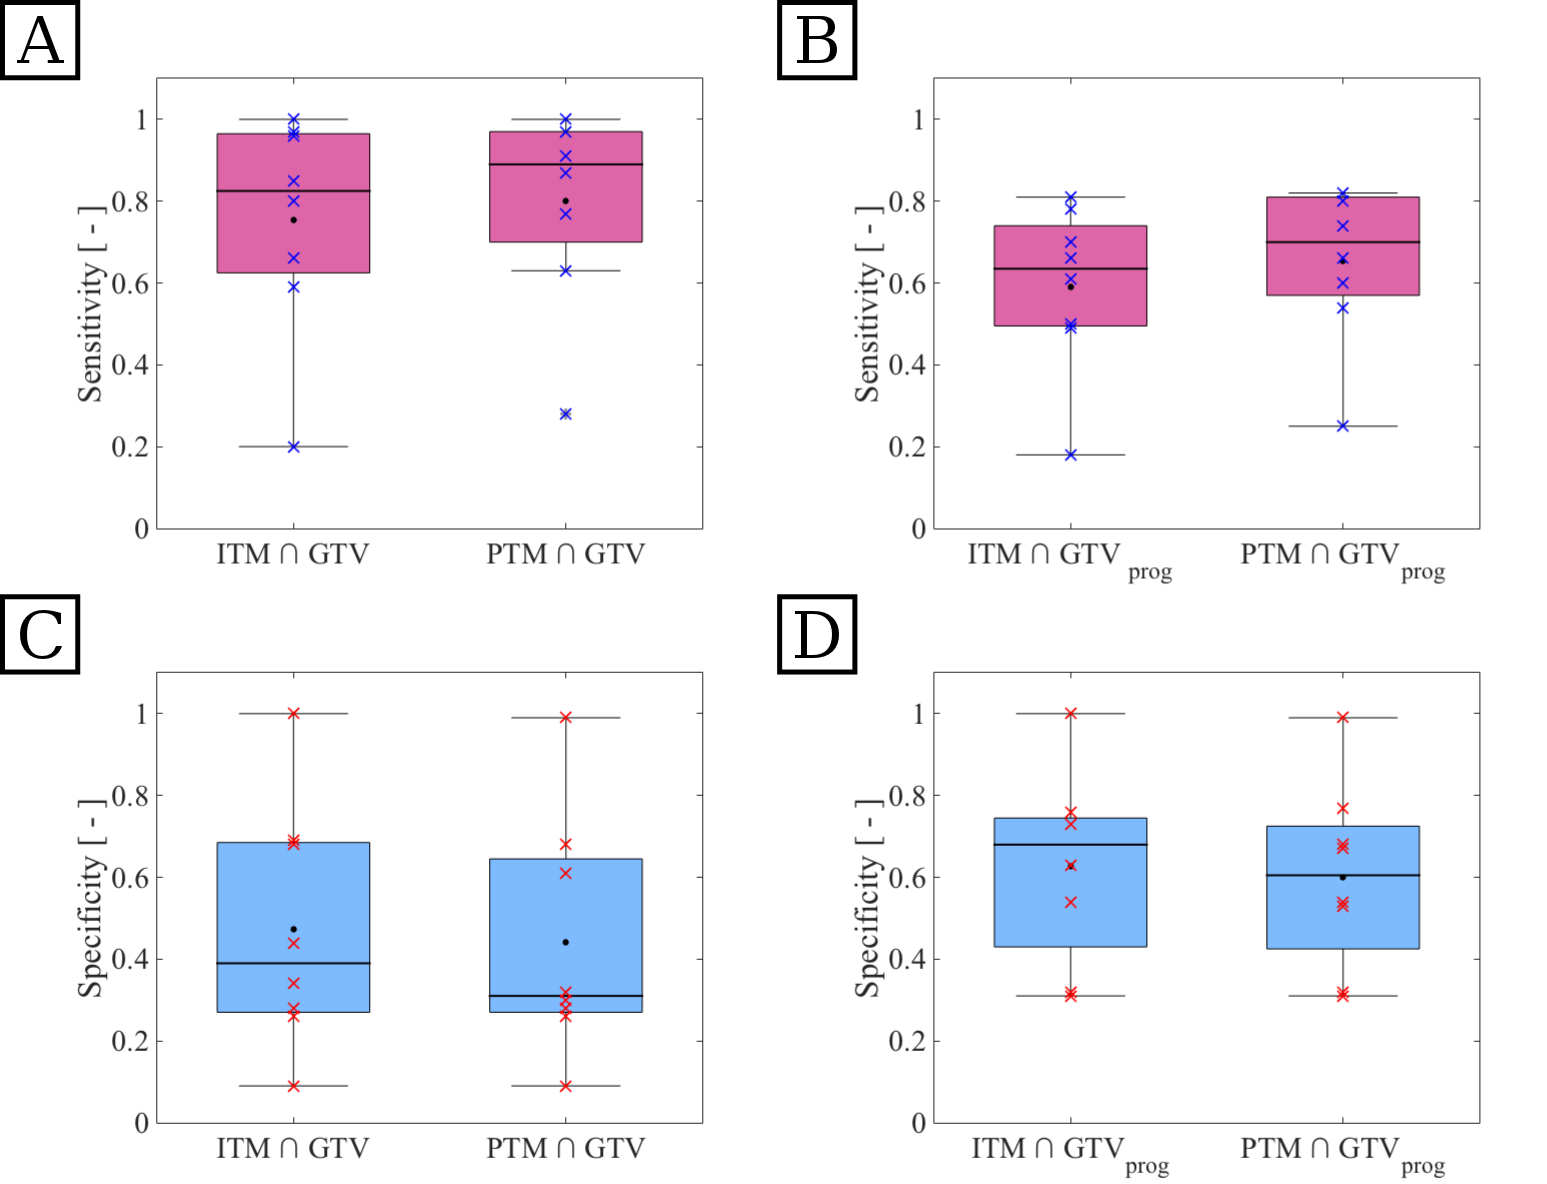
Our approach yielded feasible results for detection of tumor tissue. Figure 4 exemplary shows the results of tissue classification for one patient. The random forest yielded adequate classification of brain tissue and ventricle. Smaller structures were not assessed, due to the low spatial resolution of some feature images. The algorithm was able to identify tumor volumes and suggested even larger initial tumor volumes, which include parts of the progress volume GTVprog. Furthermore our approach identified regions of tissue at risk, that were not visible in the standard T1 contrast-enhanced MRI. Figure 5 shows sensitivity and specificity, measured over all patients, for intersections between the different predicted and MRI based volumes. Sensitivity with respect to GTV (A) was high for both ITMpred and PTMpred, showing that these volumes present with good coverage of the standard tumor volume definition. Specificity (C) was low, especially for the intersection $$$PTM\cap GTV$$$ (median 0.31), so the prediction detected larger volumes than the GTV. With respect to tumor growth after therapy GTVprog, the predicted ITMpred presented with adequate sensitivity (B) and high specificity (D). About 60% of the true progress were included in the predicted volume, roughly 70% of the predicted volume correctly labeled as tumor tissue. The predicted PTMpred yielded the best relation of high specificity (median 0.7) and high sensitivity (median 0.61), indicating excellent coverage of the actual progress volume and little wrongly classified tissue.Conclusion
We presented a novel approach for identification of tumor tissue, which allows for prediction of tumor growth. Our approach combined metabolic and hemodynamic surrogate parameters, derived from amino acid PET and DCE MRI, with information from radiotherapy treatment planning. The algorithm is able to detect tumor tissue not visible in the standard modalities, with good sensitivity and specificity. It could be used to gain deeper insight into tumor heterogeneity and assist in radiotherapy target delineation. Further studies should investigate the appropriate choice of classification features, the training endpoint and feature importance analysis. Distance measures, which account for the distance of each pixel from primary tumor site and nerve fiber paths, could be included6.Acknowledgements
No acknowledgement found.References
1 Gaspar, L. E., Fisher, B. J., Macdonald, D. R., Leber, D. V., Halperin, E. C., Schold, S. C. and Cairncross, J. G. ‘Supratentorial malignant glioma: patterns of recurrence and implications for external beam local treatment.’, International Journal of Radiation Oncology* Biology* Physics 24.1 (1992), 55–57
2 Breiman, L. ‘Random forests.’, Machine Learning 45.1 (2001), 5–32.
3 Combs, S. E., Burkholder, I., Edler, L., Rieken, S., Habermehl, D., Jäkel, O., Haberer, T., Haselmann, R., Unterberg, A., Wick, W. et al. ‘Randomised phase I/II study to evaluate carbon ion radiotherapy versus fractionated stereotactic radiotherapy in patients with recurrent or progressive gliomas: the CINDERELLA trial.’, BMC Cancer 10.1 (2010), 533.
4 Wolf, I., Vetter, M., Wegner, I., Böttger, T., Nolden, M., Schöbinger, M., Hastenteufel, M., Kunert, T. and Meinzer, H.-P. ‘The medical imaging interaction toolkit.’, Medical Image Analysis 9.6 (2005), 594–604.
5 Köthe, U. et al. ‘VIGRA-Vision with Generic Algorithms’, Cognitive Systems Group (2008), University of Hamburg, Germany
6 Weber, C., Götz, M., Binczyck, F., Polanska, J., Tarnawski, R., Bobek-Billewicz, B., Meinzer, H.-P., Stieltjes, B. and Maier-Hein, K. ‘Überwachtes Lernen zur Prädiktion von Tumorwachstum.’, Bildverarbeitung für die Medizin (2015), Springer, pp. 473– 478.
Figures