2222
The diagnostic performance of DCE-MRI in differentiating high-from low-grade gliomas: A systematic review and meta-analysis1Department of Diagnostic Radiology, the first affiliated hospital of XI'AN jiaotong universityDepartment of Diagnostic Radiology, XI'AN, People's Republic of China
Synopsis
Dynamic contrast-enhanced magnetic resonance imaging (DCE-MRI) has been provided for noninvasive assessment of different grade of gliomas. But the diagnostic performance of this new approach was variant among the recent reports. This study included 10 DCE-MRI studies regarding to differentiating high grade gliomas (HGGs) from low grade gliomas (LGGs). The meta-analysis results demonstrated that parameters of DCE-MRI have high diagnostic performanc (Ktrans and Ve) in distinguishing HGGs from LGGs. DCE-MRI can be used as an important tool for the assessment of neovascular permeability and for the pre-operative grading of glioma.
Introduction
Accurate assessment of glioma grades is important which could determine the optimal therapy and prognosis[1].The method of dynamic contrast-enhanced magnetic resonance imaging(DCE-MRI) is widely researched in evaluating glioma grades recent years, but the diagnostic performance of each studies and pharmacokinetics model are variant,while this method is not extended to clinical practice[2]. Therefore, this study aims to systematically review and meta-analyze DCE-MRI for differentiating high grade gliomas (HGGs) from low grade gliomas (LGGs).Methods
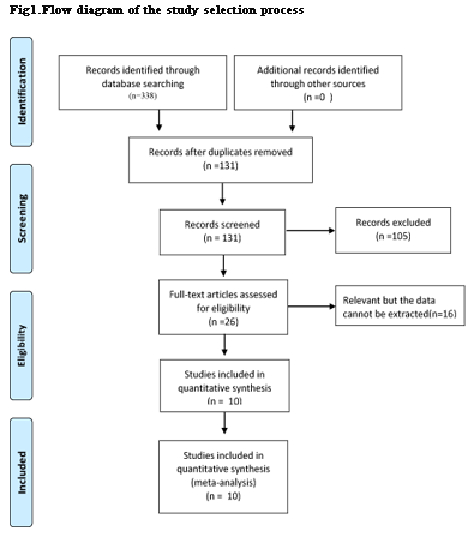
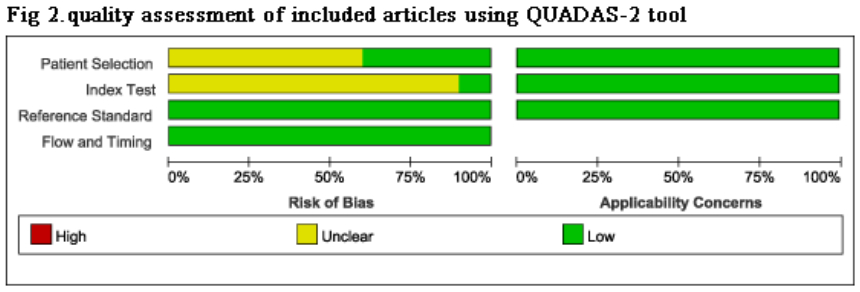
This meta-analysis was performed in accordance with the PRISMA guidelines[3]. The Pubmed ,Web of Science, EMBASE and Google Scholar databases were systematically searched until 31 May 2016, using following terms combinations: DCE & glioma, dynamic contrast enhanced & glioma, Ktrans & glioma, Ve & glioma. Quality Assessment Tool for Diagnostic Accuracy Studies version 2(QUADAS-2)[4]was used by two independent authors to evaluated the quality of each included studies.The primary outcomes were Ktrans and Ve. The extent of heterogeneity was assessed using chi-square value test and inconsistency index (I2) of diagnostic odds ratio (DOR). A Spearman correlation coefficient was computed between logit of SEN and logit of (1−SPE) to assess threshold effect, P<0.05 indicated significant difference.The summary receiver-operating characteristic curve (SROC), area under the curve (AUC) and Q* index were calculated. The above mentioned statistical analyses were performed using Meta-DiSc statistical software version1.4[5].Publication bias was assessed by Deeks’ funnel plot. Formal testing for publication bias was conducted using a regression of the diagnostic log odds ratio against ESS1/2 (effective sample size) and weighting according to the effective sample size, with P<0.10 indicating significant asymmetry[6]. This statistical analysis was performed using Stata 12.0 software (StataCorp LP, College Station, TX, USA).Results
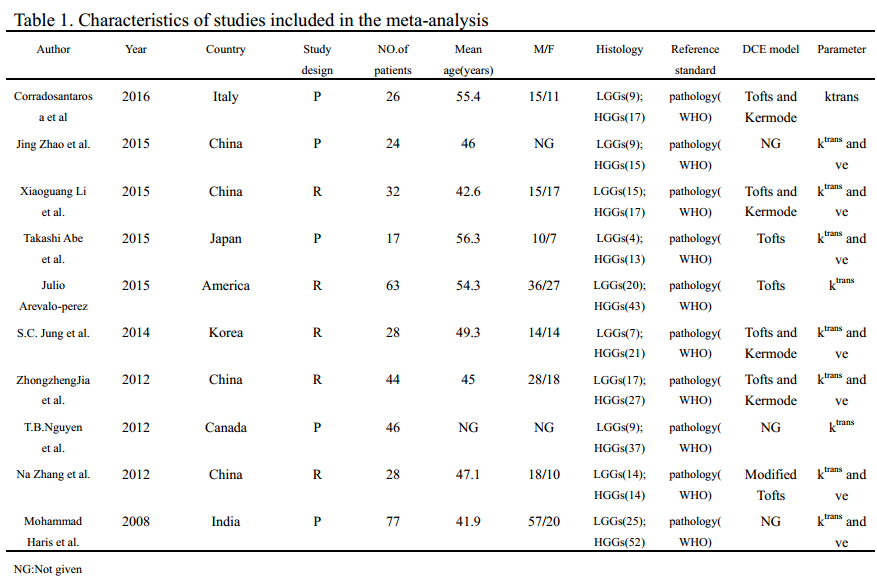
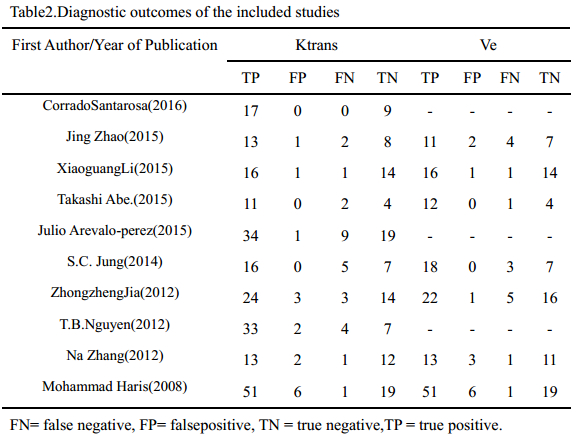
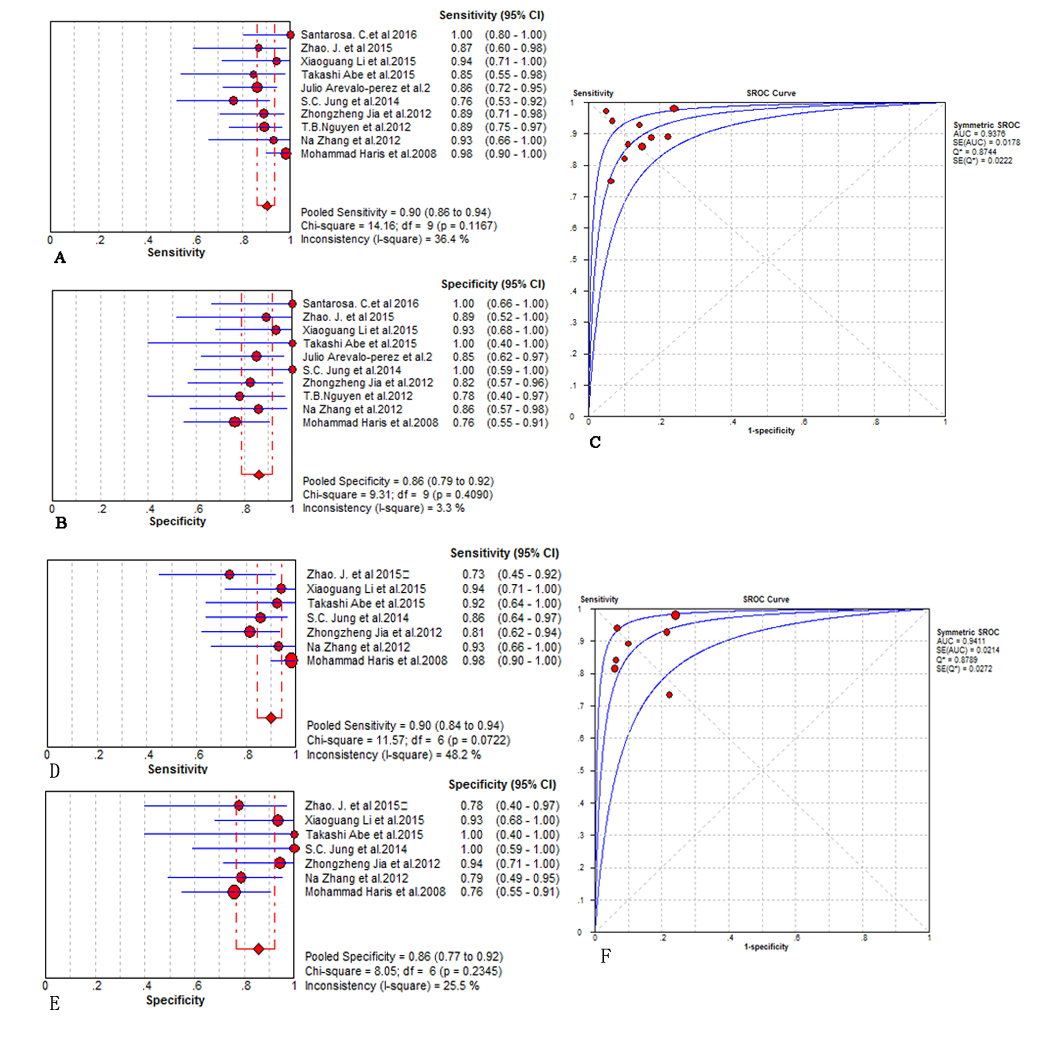
A flow diagram of the study selection is shown in Fig 1. 10studies[2,7-15]were included in our study. QUADAS-2 was used to assess the quality of each studies(Fig 2).385 patients were included (129 LGGs and 256 HGGs) Table 1.The various indicators obtained directly or indirectly from each study were shown in Table 2.Ktrans(sensitivity/specificity:I2=36.4%/3.3%, Chi-square test P=0.1176/0.4090, Fig 3A-3C) and Ve(sensitivity/ specificity: I2 =48.2%/25.5%, Chi-square test P = 0.0722/0.2345,Fig3D-3F) parameters have no heterogeneity, the pooled sensitivity /specificity are 0.90 (95% CI: 0.86 to 0.94)/0.86 (95% CI: 0.79 to 0.92) and 0.90 (95% CI: 0.84 to 0.94) / 0.86 (95% CI: 0.77 to 0.92). The AUC(SROC analysis) of Ktrans and Ve are 0.9376 (SE = 0.0178) and 0.9411 (SE = 0.0214). There are three kinds of pharmacokinetic models among included studies(Tofts model, Tofts and Kermode and Modified Tofts.Table 1).
There were no obvious threshold effect of Ktrans (Spearman correlation coefficient= 0.212,P-value= 0.556) and Ve (Spearman correlation coefficient= 0.357, P-value= 0.432).There was no significant publication bias (The Deeks’ funnel plot asymmetry test :P=0.85 for Ktrans;p=0. 22 for Ve).
Discussion
DCE-MRI provides more truthful tumor perfusion information, Ktrans and Ve are the most important quantitative parameters, which showed high diagnostic performance in this meta-analysis. Our findings are also consistent with these previous studies, therefore ,DCE-MRI would contribute greatly to various clinical situations.
However, there exists some limitations about this method. The main limitation of DCE-MRI is that, at present, there is no standardization as to the optimal method of assessing perfusion[16], for example, the physiological meaning of Ve has been defined as “leakage space” in an initial study and as extravascular extracellular space or its volume in later studies[2], T1 time, cut-off value and pharmacokinetic model are different during included studies[2,7-15]. These may exist heterogeneity and the results may untruthfulness. Nevertheless , the basic theory of methods were similar, the resultant error is not so large during closely acquisition times[2]. When using different DCE protocol for grading gliomas, parametric errors occur in the same direction, their resulting distributions could be unchanged and diagnostic utility is preserved. Therefore, our results are credible and valuable, meanwhile ,further investigation involving radiological-pathological correlation is needed to determine a standard in using DCE-MRI, in order to spread DCE-MRI to clinical practice.
Conclusion
This meta-analysis provides evidence that Ktrans and Ve parameter of DCE-MRI have high diagnostic performance in distinguishing HGGs from LGGs.Acknowledgements
This work was supported by the National Key Research and Development Program of China (2016YFC0100300), National Natural Science Foundation of China (No.81171317, 81471631), and the 2011 New Century Excellent Talent Support Plan of the Ministry of Education, China (NCET-11-0438).References
1. DeAngelis L M. Brain tumors[J]. New England Journal of Medicine, 2001, 344(2): 114-123.
2.Abe T, Mizobuchi Y, Nakajima K, et al. Diagnosis of brain tumors using dynamic contrast-enhanced perfusion imaging with a short acquisition time[J]. SpringerPlus, 2015, 4(1): 88.
3. Liberati A, Altman DG, Tetzlaff J, et al. The PRISMA statement for reporting systematic reviews and meta-analyses of studies that evaluate health care interventions: explanation and elaboration. Ann Intern Med. 2009;151:W65–W94.
4.Leeflang M M G, Deeks J J, Gatsonis C, et al. Systematic reviews of diagnostic test accuracy[J]. Annals of internal medicine, 2008, 149(12): 889-897.
5. Zamora, J., Abraira, V., Muriel, A., Khan, K., &Coomarasamy, A. (2006). Meta-DiSca software for meta-analysis of test accuracy data. BMC medical research methodology, 6(1), 31.
6. Deeks J J, Macaskill P, Irwig L. The performance of tests of publication bias and other sample size effects in systematic reviews of diagnostic test accuracy was assessed[J]. Journal of clinical epidemiology, 2005, 58(9): 882-893.
7.Haris M, Gupta R K, Singh A, et al. Differentiation of infective from neoplastic brain lesions by dynamic contrast-enhanced MRI[J]. Neuroradiology, 2008, 50(6): 531-540.
8.Jia Z, Geng D, Xie T, et al. Quantitative analysis of neovascular permeability in glioma by dynamic contrast-enhanced MR imaging[J]. Journal of Clinical Neuroscience, 2012, 19(6): 820-823.
9.Nguyen T B, Cron G O, Mercier J F, et al. Diagnostic accuracy of dynamic contrast-enhanced MR imaging using a phase-derived vascular input function in the preoperative grading of gliomas[J]. American Journal of Neuroradiology, 2012, 33(8): 1539-1545.
10.Zhang N, Zhang L, Qiu B, et al. Correlation of volume transfer coefficient Ktrans with histopathologic grades of gliomas[J]. Journal of Magnetic Resonance Imaging, 2012, 36(2): 355-363.
11. Jung S C, Yeom J A, Kim J H, et al. Glioma: application of histogram analysis of pharmacokinetic parameters from T1-weighted dynamic contrast-enhanced MR imaging to tumor grading[J]. American Journal of Neuroradiology, 2014, 35(6): 1103-1110.
12. Arevalo-Perez J, Peck K K, Young R J, et al. Dynamic Contrast-Enhanced Perfusion MRI and Diffusion-Weighted Imaging in Grading of Gliomas[J]. Journal of Neuroimaging, 2015, 25(5): 792-798.
13. Li X, Zhu Y, Kang H, et al. Glioma grading by microvascular permeability parameters derived from dynamic contrast-enhanced MRI and intratumoral susceptibility signal on susceptibility weighted imaging[J]. Cancer Imaging, 2015, 15(1): 1-9.
14. Zhao J, Yang Z, Luo B, et al. Quantitative Evaluation of Diffusion and Dynamic Contrast-Enhanced MR in Tumor Parenchyma and Peritumoral Area for Distinction of Brain Tumors[J]. PloS one, 2015, 10(9): e0138573.
15.Santarosa C, Castellano A, Conte G M, et al. Dynamic contrast-enhanced and dynamic susceptibility contrast perfusion MR imaging for glioma grading: Preliminary comparison of vessel compartment and permeability parameters using hotspot and histogram analysis[J]. European journal of radiology, 2016, 85(6): 1147-1156.
16. Cher Heng Tan1,Brian Paul Hobbs,Wei Wei, et al. Dynamic Contrast-Enhanced MRI for the Detection of Prostate Cancer: Meta-Analysis[J].AJNR,2015,204:w439-w448.
Figures