2217
Exploring the distribution of inflow and outflow bloodstream type in pituitary adenoma by dynamic contrast-enhanced MRI1Department of Diagnostic Radiology, the First Affiliated Hospital of Xi’an Jiaotong University, Xi’an, People's Republic of China, 2ISN Lab, Xidian University
Synopsis
In this study, a new approach for assessing distribution of bloodstream inflow and outflow type based on the three-time point (3TP) method was used to semi-quantitative analysis of the microcirculation characteristics in whole pituitary adenoma by dynamic contrast-enhanced MRI (DCE-MRI). The volume percentage of persistently enhancing type of time-intensity curve (TIC) in adenoma was higher than normal region. Meanwhile, adenomas with hyperprolactinemia were shown a significant decrease of volume percentage in speed up the downhill type when compared with the adenoma without hyperprolactinemia. This method could identify the different distribution of vascularity between normal pituitary and subtype of adenoma.
Introduction
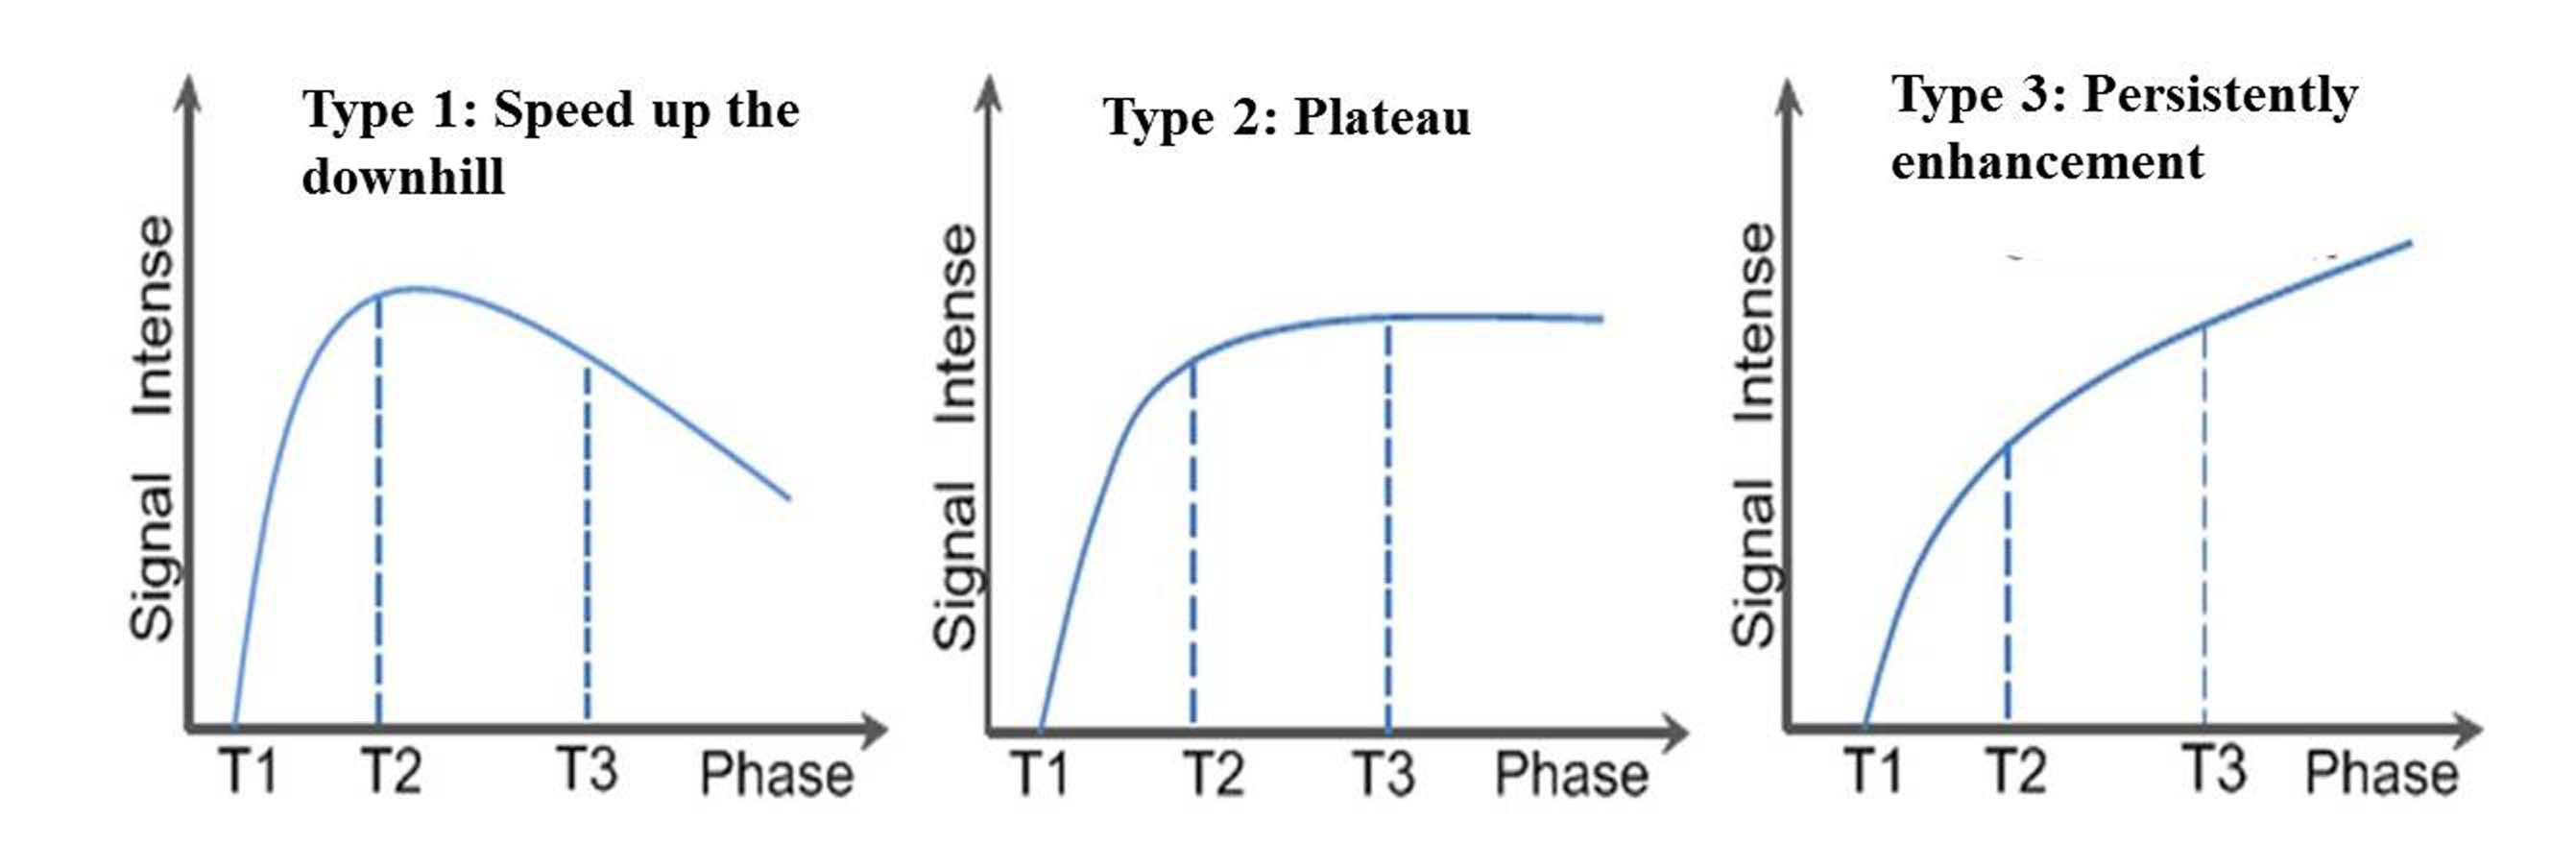
The distribution of bloodstream type within pituitary adenoma is an important feature in clinical management.1 Since dynamic contrast-enhanced MRI (DCE-MRI) can yield different time-intensity curve (TIC), which is categorized as speed up the downhill (type 1), plateau (type 2), or persistently enhancing (type 3) according to washout shape.2 This study aims to semi-quantitatively estimate the distribution of inflow and outflow bloodstream type of pituitary adenoma by three-time point (3TP) method of DCE-MRI.Methods
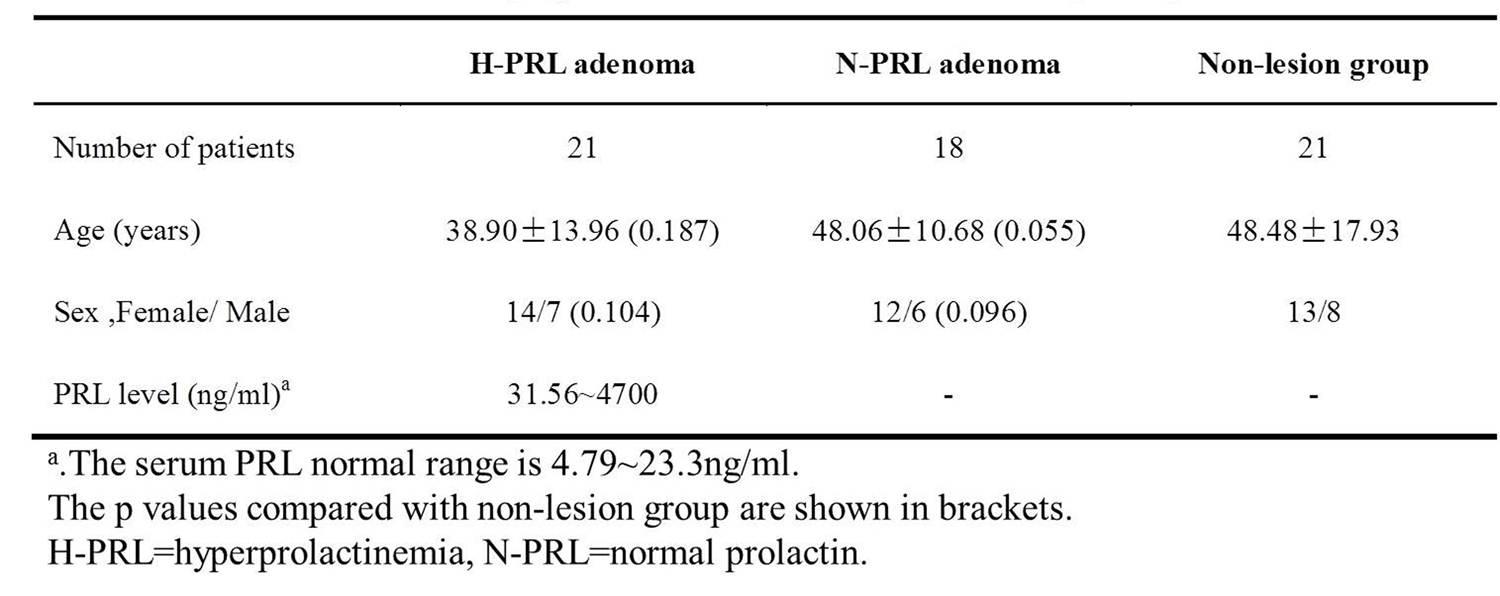
The local institutional review board approved this study and all the written informed consents were obtained. Subjects: 39 pituitary adenoma patients were confirmed by pathology and 21 subjects with non-lesion in pituitary were recruited. Among the adenoma group, there are 21subjects with hyperprolactinemia (H-PRL) and others with normal serum PRL level (N-PRL, including 4 growth hormone adenomas, 7 adrenocorticotropic hormone adenomas and 6 non-functioning adenomas). All MRI examinations were performed on GE-HDxt 3.0T scanner with an 8-channel head coil. The dynamic T1-weighted fast spin-echo sequence (TR=360ms, TE=minimum, slice thickness=2mm with no gap, FOV=20mm×20mm, matrix=256×160, NEX=2) with the injection of gadolinium (1.0 mmol/kg) was performed coronally. 6 to 9 slices locations were acquired every 20-23 s. Image analysis: Whole-adenoma voxel-based TIC was calculated by using home-made software with a preset threshold of ±10%: speed up the downhill (type1, < -10%), plateau (type2, -10%~10%) and persistently enhancement (type3, >10%) (Fig. 1). Regions of interest (ROIs) of whole tumor or pituitary were manually drawn, and the volume percentage of each type was then calculated. Parameters were analyzed by Mann-Whitney U test. A p<0.05 was considered to indicate a statistically significant difference.Results
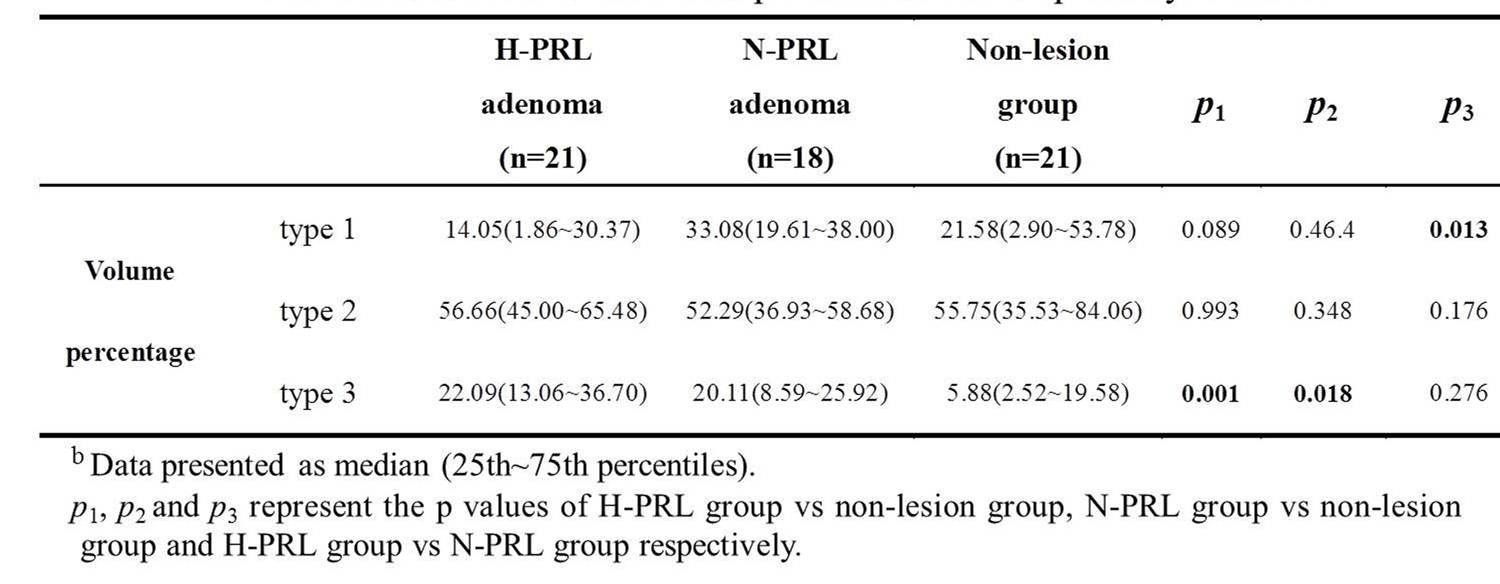
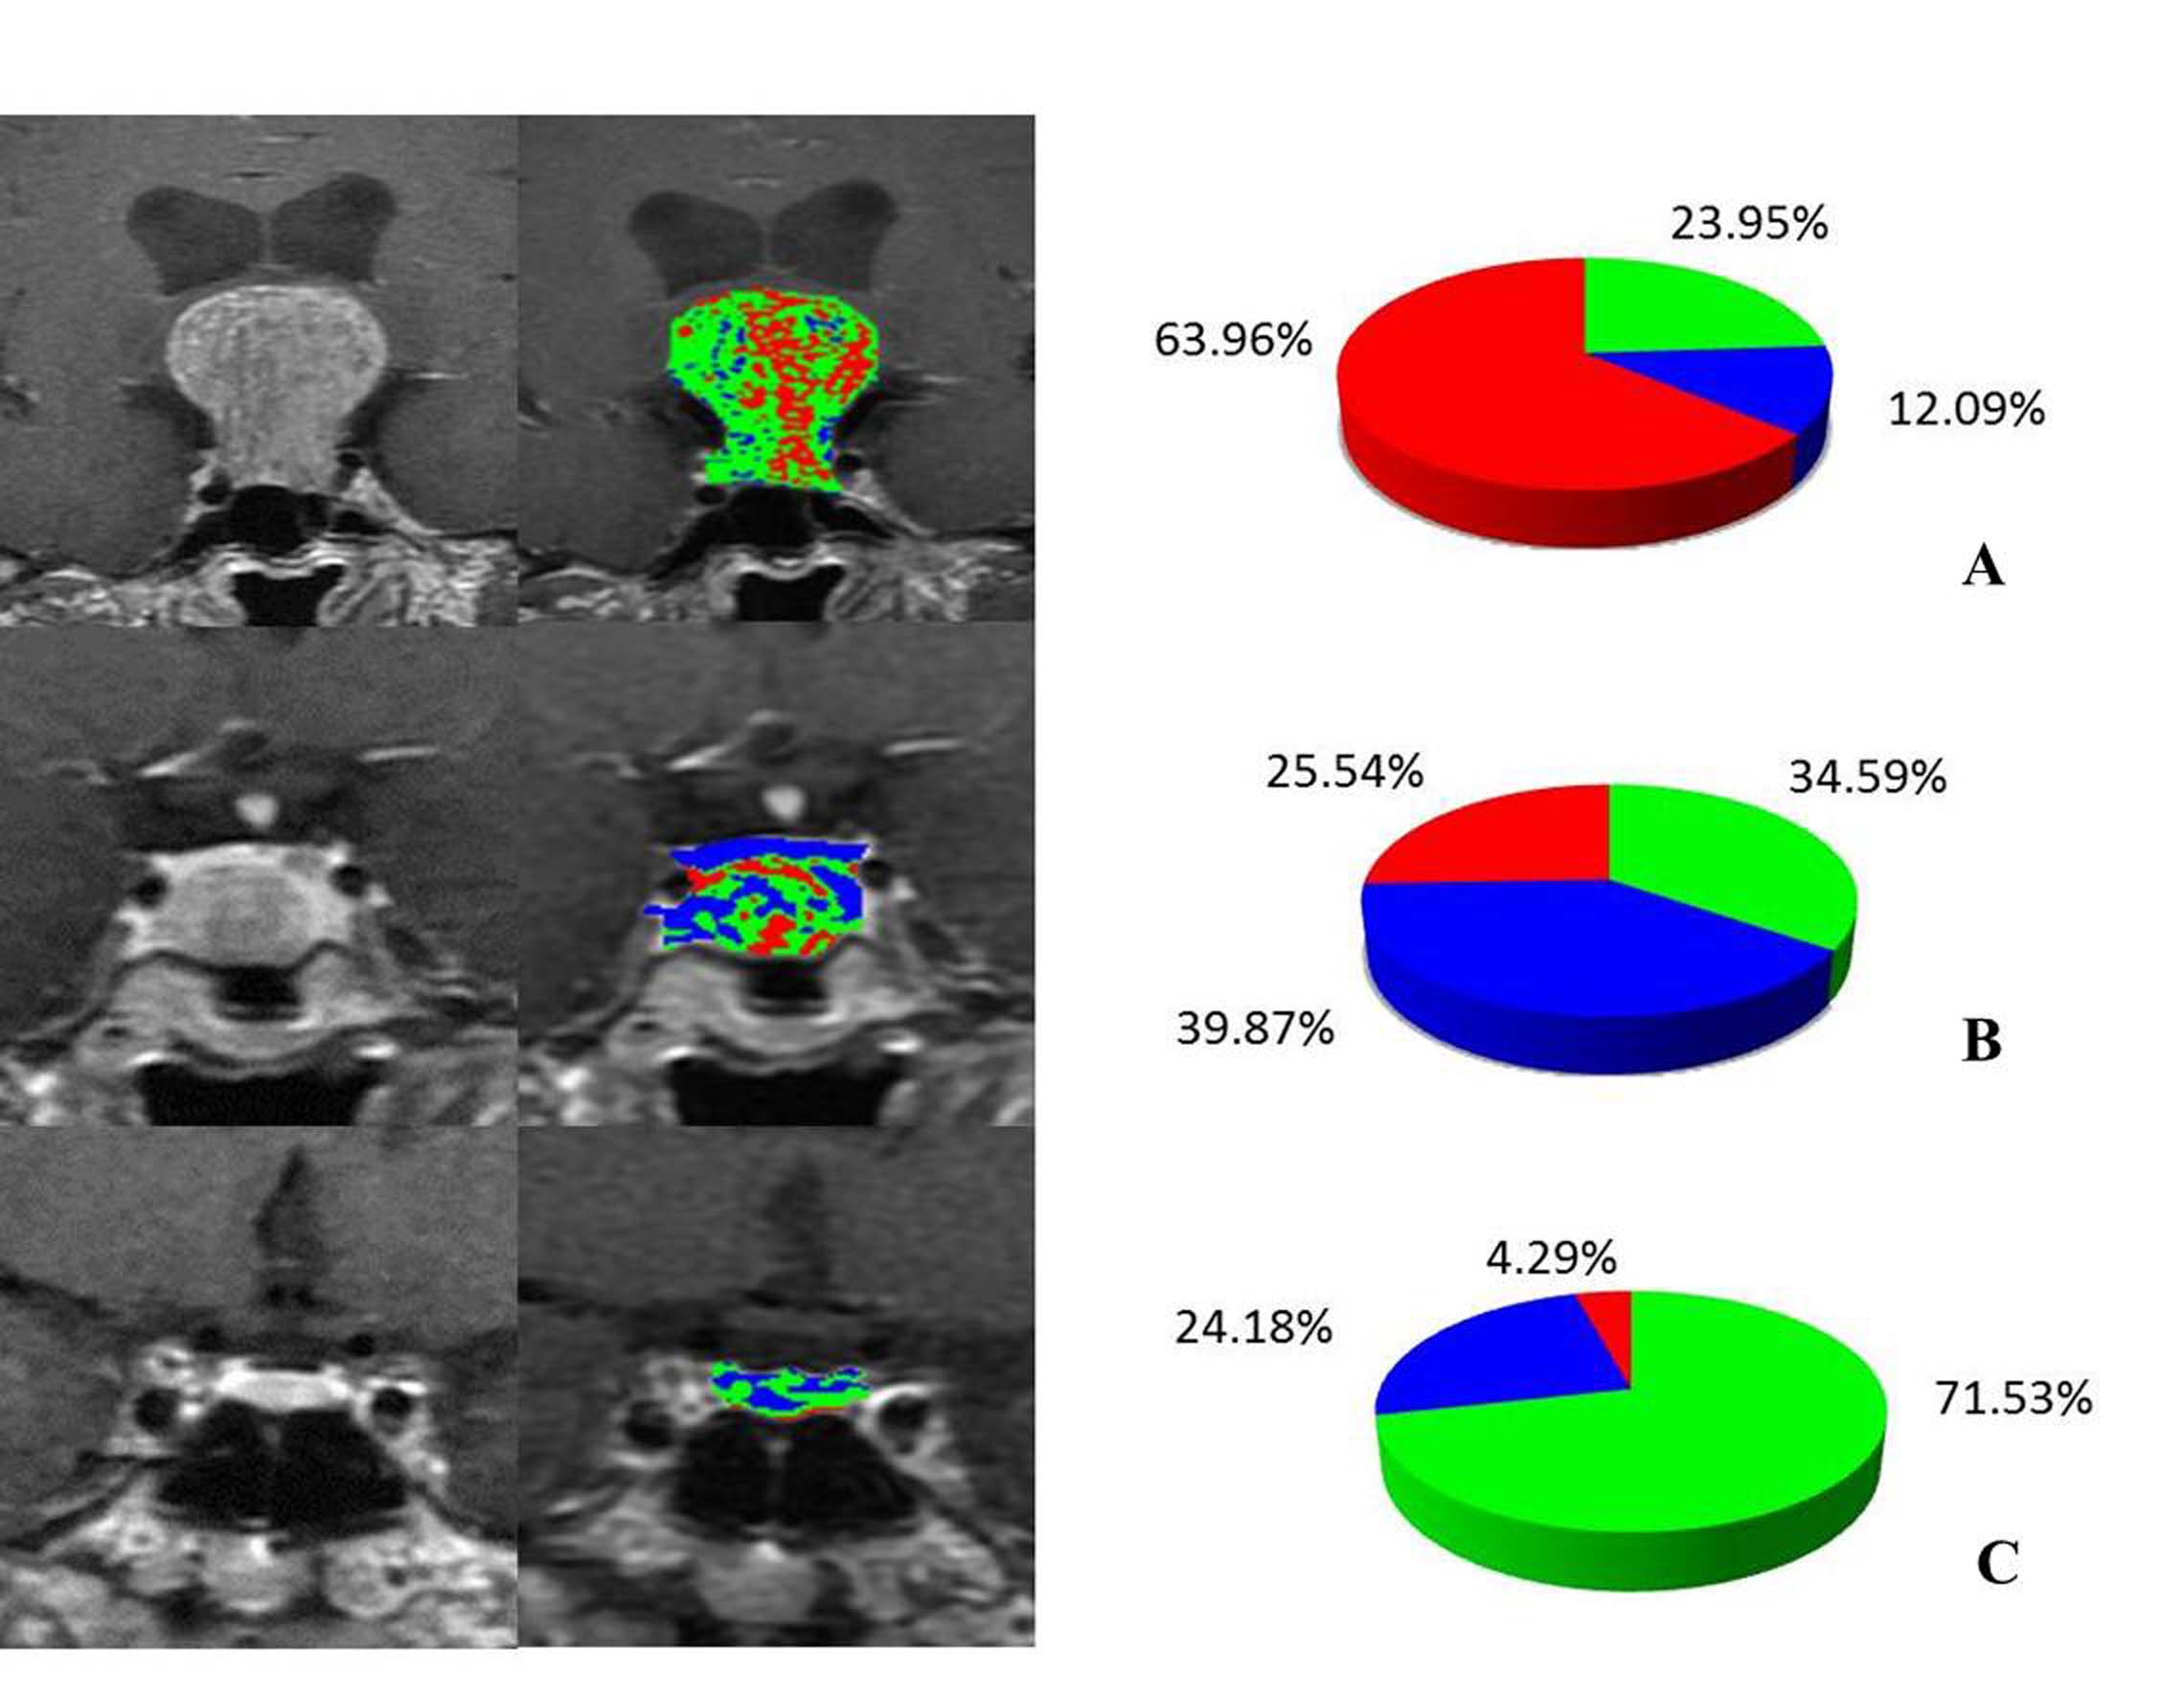
No statistical differences were found between adenomas with or without hyperprolactinemia and non-lesion group in terms of age and sex (Table 1).The volume percentage of the type3 is significantly increased in the two types of tumor compared with non-lesion group (p=0.001, p=0.018). While concerning the adenoma with higher PRL, significant difference was only found in type1 (p=0.013) (Table 2), which was reduced than it in the normal PRL group. Corresponding to above results, typical images of adenoma with or without H-PRL and normal pituitary were shown in the Fig. 2A-C.Discussion
This study demonstrated the differences between adenomas and normal pituitary in volume percentage of type 3. These findings may reflect differences in the underlying vascular anatomy and perfusion characteristics of these regions.3 Due to the abundant blood supply to the anterior lobe of pituitary gland from superior and inferior hypophyseal arteries and lack of blood-brain barrier, the enhanced TIC of normal pituitary is mainly composed of plateau type.4 However, tumor angiogenesis in adenoma may immature with relatively smaller diameter, which could be the reason of the increased volume percentage in persistently enhancement type.5 In addition, adenoma with hyperprolactinemia with the different expression of VEGF and D2 receptors, its percentange of the speed up the downhill type is lower than adenomas with N-PRL.Conclusion
The 3TP method of DCE-MRI could identify the different distribution of inflow and outflow bloodstream types between normal pituitary and the subtype of adenoma.Acknowledgements
This work was supported by the National Natural Science Foundation of China (No.81171317, 81471631), and the 2011 New Century Excellent Talent Support Plan of the Ministry of Education, China (NCET-11-0438).References
1. Sakai N, Koizumi S, Yamashita S, et al. Arterial spin-labeled perfusion imaging reflects vascular density in nonfunctioning pituitary macroadenomas[J]. American Journal of Neuroradiology, 2013, 34(11): 2139-2143. 2. El Khouli R H, Macura K J, Kamel I R, et al. 3-T dynamic contrast-enhanced MRI of the breast: pharmacokinetic parameters versus conventional kinetic curve analysis[J]. AJR. American journal of roentgenology, 2011, 197(6): 1498-1505. 3. Espagnet M C R, Bangiyev L, Haber M, et al. High-Resolution DCE-MRI of the pituitary gland using radial k-space acquisition with compressed sensing reconstruction[J]. American Journal of Neuroradiology, 2015, 36(8): 1444-1449. 4. Manuchehri A M, Sathyapalan T, Lowry M, et al. Effect of dopamine agonists on prolactinomas and normal pituitary assessed by dynamic contrast enhanced magnetic resonance imaging (DCE-MRI)[J]. Pituitary, 2007, 10(3): 261-266.Figures