2215
Effect of Lesion-related Signal Variation in Proton Density Reference Image on Blood Flow Quantification with Arterial Spin Labeling MRI for Differentiating Pseudo-progression from True Progression in Gliomas1Department of Diagnostic Radiology, The University of Texas MD Anderson Cancer Center, Houston, TX, United States, 2Department of Imaging Physics, The University of Texas MD Anderson Cancer Center, Houston, TX, United States, 3Department of Radiology, University of California, San Diego, La Jolla, CA, United States, 4Department of Radiation Oncology, The University of Texas MD Anderson Cancer Center, Houston, TX, United States
Synopsis
CBF quantification using ASL is an important MR technique for the evaluation of suspicious enhancing lesions for patients’ status post chemotherapy treatment. The quantification requires an estimate of equilibrium magnetization of blood which is often obtained using a set of proton density (PD) reference images; however, this approach can lead to errors in CBF based on tissue variation in PD which could then lead to inaccurate assessment of pseudo-progression (PsP) versus true progression (TP). Our work showed that PD variation led to a reduced diagnostic performance of CBF particularly in the region of enhancing lesions with pathologic proven TP.
Purpose
Cerebral blood flow (CBF) quantification using arterial spin labeling (ASL) MRI requires an estimate of equilibrium magnetization of blood (M0,blood), which is often obtained using a set of proton density (PD)-weighted reference images and the blood-brain partition coefficient (λ).1 These PD reference images are also useful in compensating for the spatial profile of the coil sensitivity. Normally, the λ is assumed to be constant across the brain, which may not be valid in areas with brain lesions.2 In this study, we evaluated the impact of lesion-related signal variations in PD reference image on quantified blood flow measures for differentiating pseudo-progression (PsP) from true progression (TP) following chemoradiation in patients with gliomas.Methods
MR images obtained with pseudo-continuous ASL (PCASL), T2-weighted fluid-attenuated inversion recovery (FLAIR) and postcontrast T1-weighted sequences were analyzed retrospectively in 19 glioma patients (9 TP and 10 PsP). All images were acquired on a clinical 3T MR750 scanner (GE Healthcare, Waukesha, WI). The PCASL perfusion imaging was performed using a 3D background-suppressed FSE stack-of-spiral readout module with 8 in-plane spiral interleaves (TR/TE = 4696 ms/10.2 ms; labeling duration = 1500 ms; post-labeling delay = 2025 ms; in-plane matrix = 128 x 128; 3 signal average; whole brain coverage with 5-mm slice thickness). PD reference images were obtained as part of the product PCASL sequence. A quantitative CBF map was calculated for each patient using the commonly applied simplified model1 on a GE Advantage Windows workstation. Regions of interest (ROIs) were determined for lesions on the FLAIR images as well as the enhancing region on the postcontrast T1-weighted images. Relative lesion blood flow (lesion/contralateral tissue) was calculated using both a CBF map (dependent on the PD) and an ASL difference signal map (ΔM map, independent of the PD) for comparison.Results and Discussion
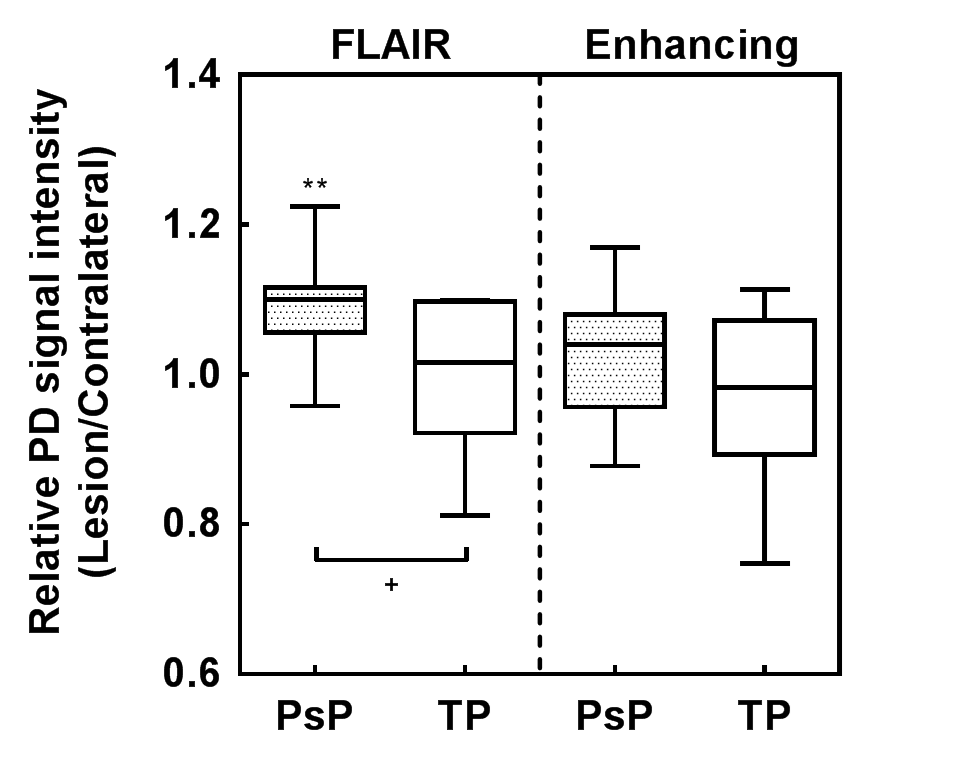
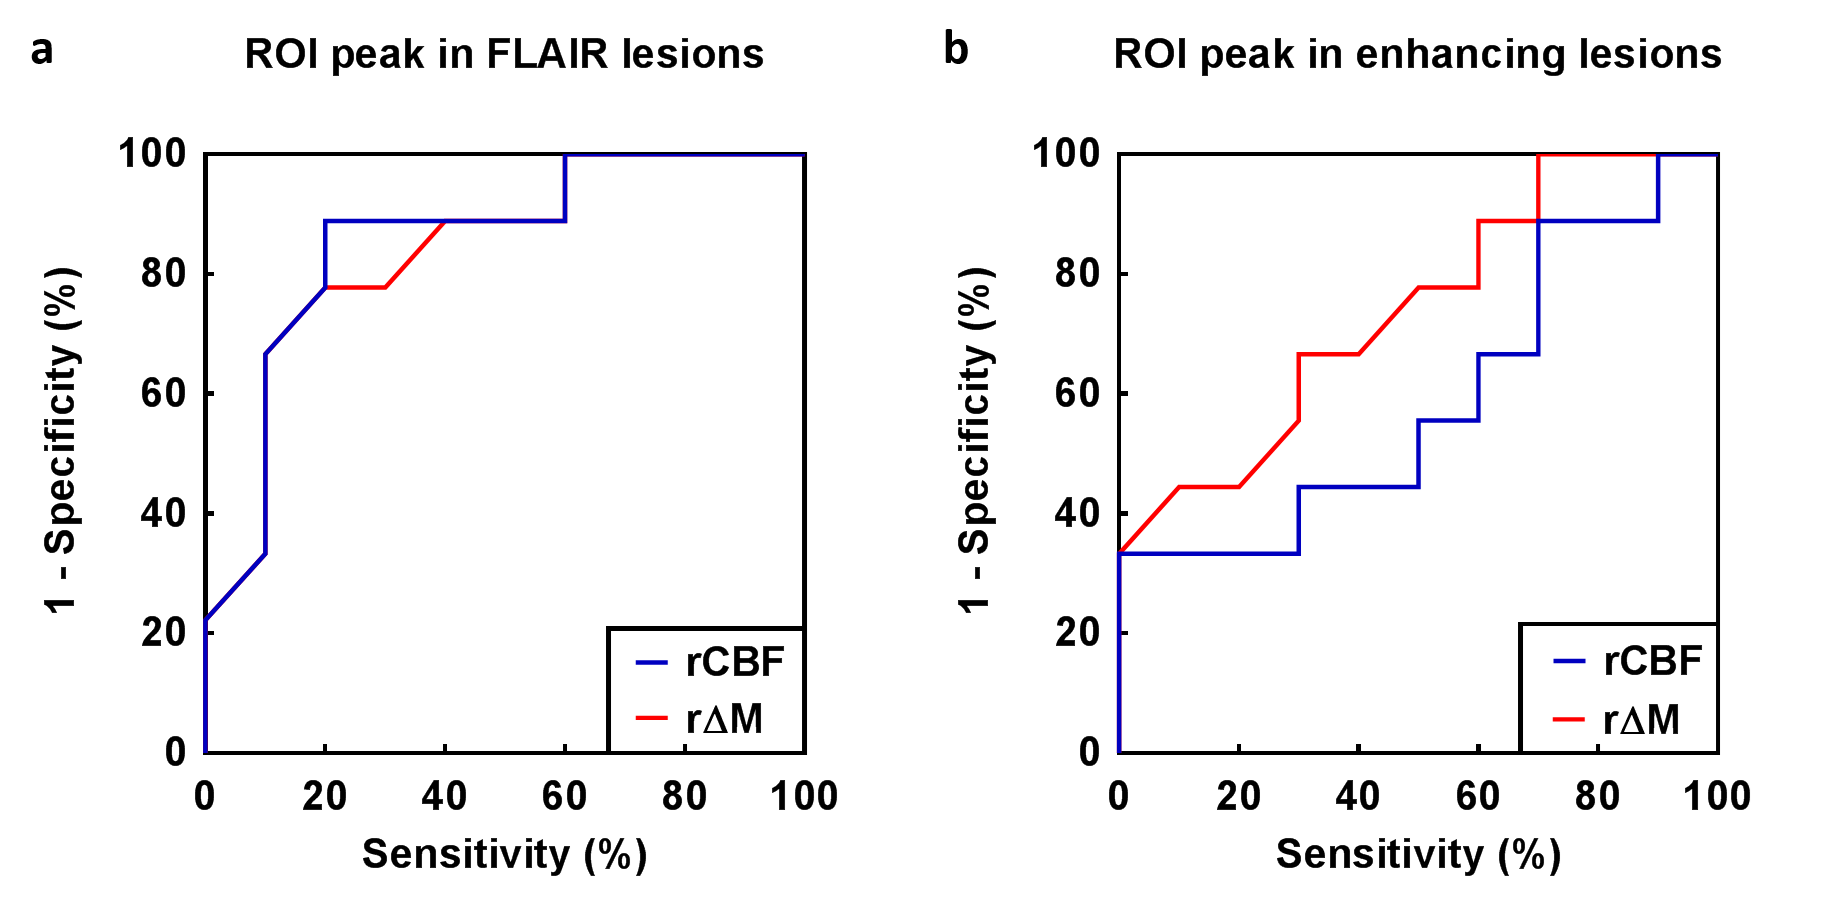
FLAIR lesions in PsP had significantly larger signal in the proton density (PD) reference image (P < 0.05, Figure 1). PD signal in TP and enhancing ROIs showed large variations (Figure 1). When deriving from ΔM (without using the PD reference signal), relative BF of TP was significantly larger than PsP in both FLAIR (P < 0.05, Figure 2a) and enhancing ROIs (P < 0.05, Figure 2b). When deriving from CBF (with the PD reference signal used), relative BF of TP was significantly larger than PsP only in FLAIR lesion (P < 0.01, Figure 2a), not in the enhancing ROI (Figure 2b). This may be due to the large variation of the PD signal in the TPs. Figure 3 shows similar diagnostic performance between using CBF and ΔM when looking at FLAIR ROIs. However, ΔM gave better performance than CBF when looking at the enhancing ROIs.Conclusions
Large PD variation in enhancing lesions reduced the diagnostic performance of quantitative CBF for the differentiation of PsP from TP. ASL signal (ΔM) can be used as an alternative measure of relative lesion blood flow with better performance in the enhancing ROI. This finding supports the use of alternative approaches to estimate the M0,blood for the ASL-based quantification of blood flow in brain tumors.3, 4Acknowledgements
No acknowledgement found.References
1. Alsop DC, Detre JA, Golay X, et al. Recommended implementation of arterial spin-labeled perfusion MRI for clinical applications: A consensus of the ISMRM perfusion study group and the European consortium for ASL in dementia. Magn Reson Med. 2015;73(1):102-116.
2. Just M, Thelen M. Tissue characterization with T1, T2, and proton density values: results in 160 patients with brain tumors. Radiology. 1988;169(3), 779-785.
3. Dai W, Robson PM, Shankaranarayanan A, Alsop DC. Sensitivity calibration with a uniform magnetization image to improve arterial spin labeling perfusion quantification. Magn Reson Med. 2011;66(6):1590-1600.
4. Liu TT, Behzadi Y, Restom K, et al. Caffeine alters the temporal dynamics of the visual BOLD response. Neuroimage. 2004;23(4):1402-1413.
Figures