2214
Differentiation of glioblastoma and primary central nervous system lymphoma by using MR image-based texture features1Department of Radiology, The University of Tokyo, Tokyo, Japan, 2Department of Radiology, The University of Tokyo Hospital, Tokyo, Japan, 3Department of Radiology, International University of Health and Welfare Mita Hospital, Tokyo, Japan
Synopsis
We evaluated the feasibility of machine learning-based differentiation between glioblastoma and primary central nervous system lymphoma by using texture features of post-contrast MR images. Cross validation showed that more than 80% of teacher data were correctly assigned. Trial data comprised of atypical image variants were correctly assigned in up to 78.6% by the best classifiers.
Background and Purpose
Both glioblastoma (GBM) and primary central nervous system lymphoma (PCNSL) affect adult brain but require different therapeutic strategies. Imaging diagnosis is often made with the following post-contrast MR image features: GBM typically shows ring-like heterogeneous enhancement, whereas PCNSL typically shows homogeneous enhancement.1,2
However, there do exist atypical GBM with homogeneous appearance and atypical PCNSL with heterogeneous appearance on imaging. Preoperative diagnosis is often very challenging in such imaging variants.
Image texture analysis is a relatively traditional technique but attracts increasing attention, in the context of artificial intelligence or machine learning-based diagnosis and prediction of disease prognosis.3-5 To our knowledge, however, there seems to be no previous report on the differentiation between such atypical GBM and atypical PCNSL with a machine learning technique.
The purpose of this study was: (1) to evaluate the accuracy of support vector machines trained with typical GBM and PCNSL images and (2) to evaluate atypical images with the best classifier.
Methods
Study ethics
This was an IRB-approved, retrospective study and informed consent was waived.
Patient demographics and MR protocols
Consecutive 45 cases of GBM (31 men, 14 women, aged 26 to 81, average 60.9 years) and 16 cases of PCNSL (13 men, 3 women, aged 42 to 75, average 60.6 years) were included who were referred to our hospital from December 2006 through August 2015. All cases were pathologically proven.
Contrast-enhanced, trans-axial, 2D spin-echo T1-weighted MR images (TR/TE (ms) = 400/minimum, FOV = 21.0 cm, matrix = 256 × 256, slice thickness = 5 mm) were used from among preoperative brain MR images acquired on a 3T system.
Image analysis
Haralick’s gray-level co-occurrence matrices (GLCM) and four texture-analysis metrics (contrast, correlation, energy, and homogeneity) were calculated on the largest enhanced area for each case.6 Displacement vectors were set at (1, 0), (1, 1), (0, 1), (1, -1), and thus the indices could be rotationally invariant (Figure 1).
Trial data set
Through a radiology report search, we found that initial imaging diagnosis had suggested PCNSL for five cases of GBM and GBM for two cases of PCNSL. The GLCM data corresponding to these seven atypical cases were designated as the trial data set.
Training data set
Two training (= teacher) data sets were created. The training data set (A) was comprised of the GLCM data of 14 typical PCNSL cases and 14 typical GBM cases that were randomly chosen out of the forty typical GBM cases, so that the numbers of GBM and PCNSL cases were balanced. The training data set (B) was comprised of the GLCM data of 14 typical PCNSL cases and all of the forty typical GBM cases.
Machine learning and internal validation (cross validation)
Sixty models were created with support vector machines for classification, depending on the combination of GLCM metrics of the training data sets and kernels (linear, quadratic, cubic and radial basis function (RBF)), and the best three classifiers with the smallest generalization error were selected after the leave-one-out cross validation. ROC analyses were also performed on the best classifiers.
External validation with trial data set
The trial data set was classified with the best classifiers and the rate of correct answers was recorded.
Results
Results are summarized in Figures 2 and 3.
The training data set (A) provided the best four classifiers with the smallest generalization error of 0.232. The four classifiers correctly assigned 53.6%, 53.6%, 35.7%, and 39.3% of the trial data set respectively.
The training data set (B) provided the best three classifiers with the generalization error of 0.162, 0.171, and 0.176 respectively. The three classifiers correctly assigned 71.4%, 78.6%, and 78.6% of the trial data set respectively.
The classifiers obtained with the training set (B) offered smaller generalization errors and better prediction results than those with (A) (p = 0.0043 and 0.0034, respectively, unpaired t-test).
Discussion
Our results show that the best classifiers could correctly assign more than 80% of the typical GBM or typical PCNSL images and that the trial data comprised of atypical image variants could be correctly assigned in up to 78.6%.
The constitution of the training data may have an effect on the prediction performance of classifiers and the teacher data with a balanced number of each object are often favored in machine learning schemes. In our study, however, the teacher data following the natural proportion of disease incidence offered classifiers with better prediction performance.
Conclusion
Our results suggest that machine learning technique may be feasible for differentiating GBM from PCNSL. However, the constitution of teacher data may affect the prediction performance of an obtained classifier.Acknowledgements
No acknowledgement found.References
1. Rees JH, Smirniotopoulos JG, Jones RV, et al. Glioblastoma multiforme: radiologic-pathologic correlation. Radiographics. 1996;16(6):1413-38.
2. Koeller KK, Smirniotopoulos JG, Jones RV. Primary central nervous system lymphoma: radiologic-pathologic correlation. Radiographics. 1997;17(6):1497-526.
3. Kassner A, Thornhill RE. Texture analysis: a review of neurologic MR imaging applications. AJNR Am J Neuroradiol. 2010;31(5):809-16.
4. Rodriguez Gutierrez D, Awwad A, et al. Metrics and textural features of MRI diffusion to improve classification of pediatric posterior fossa tumors. AJNR Am J Neuroradiol. 2014;35(5):1009-15.
5. Lee J, Jain R, Khalil K, et al. Texture feature ratios from relative CBV maps of perfusion MRI are associated with patient survival in glioblastoma. AJNR Am J Neuroradiol. 2016;37(1):37-43.
6. Haralick RM, Shanmugam K, Dinstein I. Textural features for image classification. IEEE Trans. Syst Man Cybern. 1973;SMC–3(6):610–21.
Figures
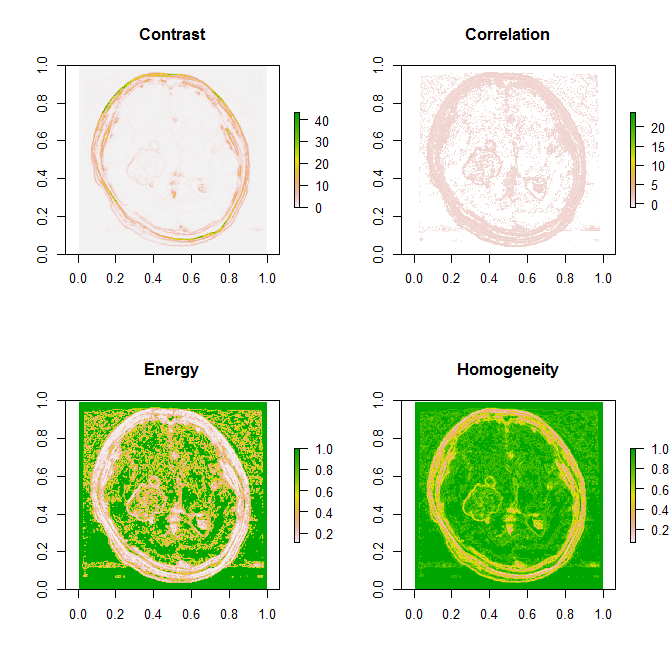
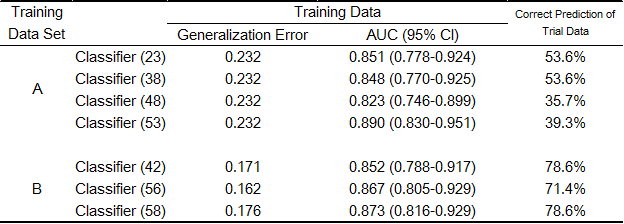
Figure 2. The summary of the results
Abbreviations: AUC = area under curve, CI = confidence intervals
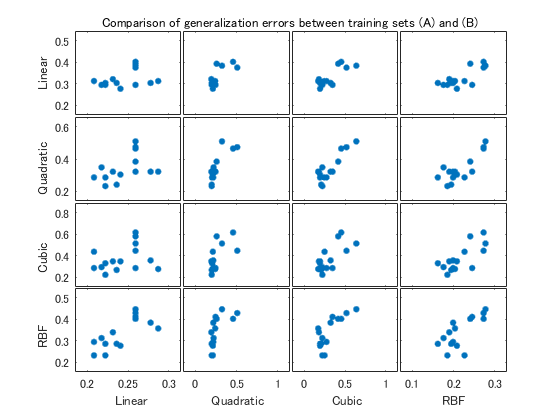
Figure 3. Comparison of generalization errors between the training sets (A) and (B)
The scatter plot matrix suggests that the training set (B) offers smaller generalization errors. The horizontal axis indicates generalization errors obtained with the training set (B). The vertical axis indicates generalization errors obtained with the training set (A).
Abbreviation: RBF = radial basis function