2211
Influence of leakage correction on DSC-based CBV values acquired without and with prebolus in human high-grade glioma1Department of Neuroradiology, Klinikum rechts der Isar, Technische Universität München, Munich, Germany, 2Department of Nuclear Medicine, Klinikum rechts der Isar, Technische Universität München, Munich, Germany
Synopsis
Aim of this study was to investigate the influence of leakage correction methods on dynamic susceptibility contrast (DSC)-based measures of cerebral blood volume (CBV), using patient data acquired with and without pre-bolus. Two post-processing techniques were compared with respect to normalized CBV (nCBV) in contrast enhancing tumor tissue. Generally, CBV increased or decreased after leakage correction for data acquired without or with prebolus, respectively. The best agreement between corrected nCBV values, obtained in the same patients without and with prebolus, respectively, was obtained for a reference curve-based correction approach.
Introduction
Cerebral blood volume (CBV) based on dynamic susceptibility contrast
(DSC) MRI is increasingly used in diagnostic imaging for characterizing brain
tumors [1]. However, in regions with disrupted blood brain barrier, resulting CBV
values are severely confounded by contrast agent leakage into the extravascular
extracellular space (EES). A recent study demonstrated that three different
correction techniques yielded different CBV results, depending on whether T1- or
T2*-related relaxation effects dominated in the EES [2]. In order to further
elucidate underlying factors and identify a reliable technique, two approaches
based on the area under the relaxation curve (AUC) and singular value
decomposition (SVD) investigated by [2], were further modified and applied to
DSC data acquired during injection of two consecutive boli (prebolus, main
bolus) of contrast agent in patients with high grade glioma.Methods
12 patients (58.2 ± 19.3 years, 7 male) with confirmed high-grade glioma (1 WHO °III, 11 WHO °IV) were examined at 3T. In each patient, DSC-MRI data (GE EPI, TR=1500 ms, TE=30 ms, α=90°, 80 dynamics, voxel size 1.8x1.8x4mm³, 20 slices) were acquired during injection of the prebolus (7.5 ml) and the mainbolus (15 ml) of Gd-DTPA (0.5mmol/ml). CBV evaluation was implemented in Matlab (MathWorks) as described previously [2]. The AUC method estimates leakage contributions from linear combinations of healthy tissue reference curves [3]. Uncorrected and corrected CBV values were calculated by integrating the uncorrected and corrected relaxation curve (AUC) over the first pass (fp) or full range (full), respectively. The SVD approach estimates leakage contributions from the residue function [4], which is obtained via singular value decomposition (SVD) of tissue time curves and arterial input function (AIF). To reduce noise sensitivity of the SVD algorithm, both standard regularization (sSVD) with a global, SNR dependent cut-off value [5] and Tikhonov regularization (TiSVD) [6] were used. Automatic AIF selection was based on an SVD approach [7]. Corrected and uncorrected CBV were then calculated according to the central volume principle. For comparability, all CBV’s of one patient were normalized to the same healthy white matter region assuming CBVWM=1.5 % {2]. For VOI evaluation, contrast-enhancing tissue (CET) was segmented manually by thresholding post-contrast T1w data.Results
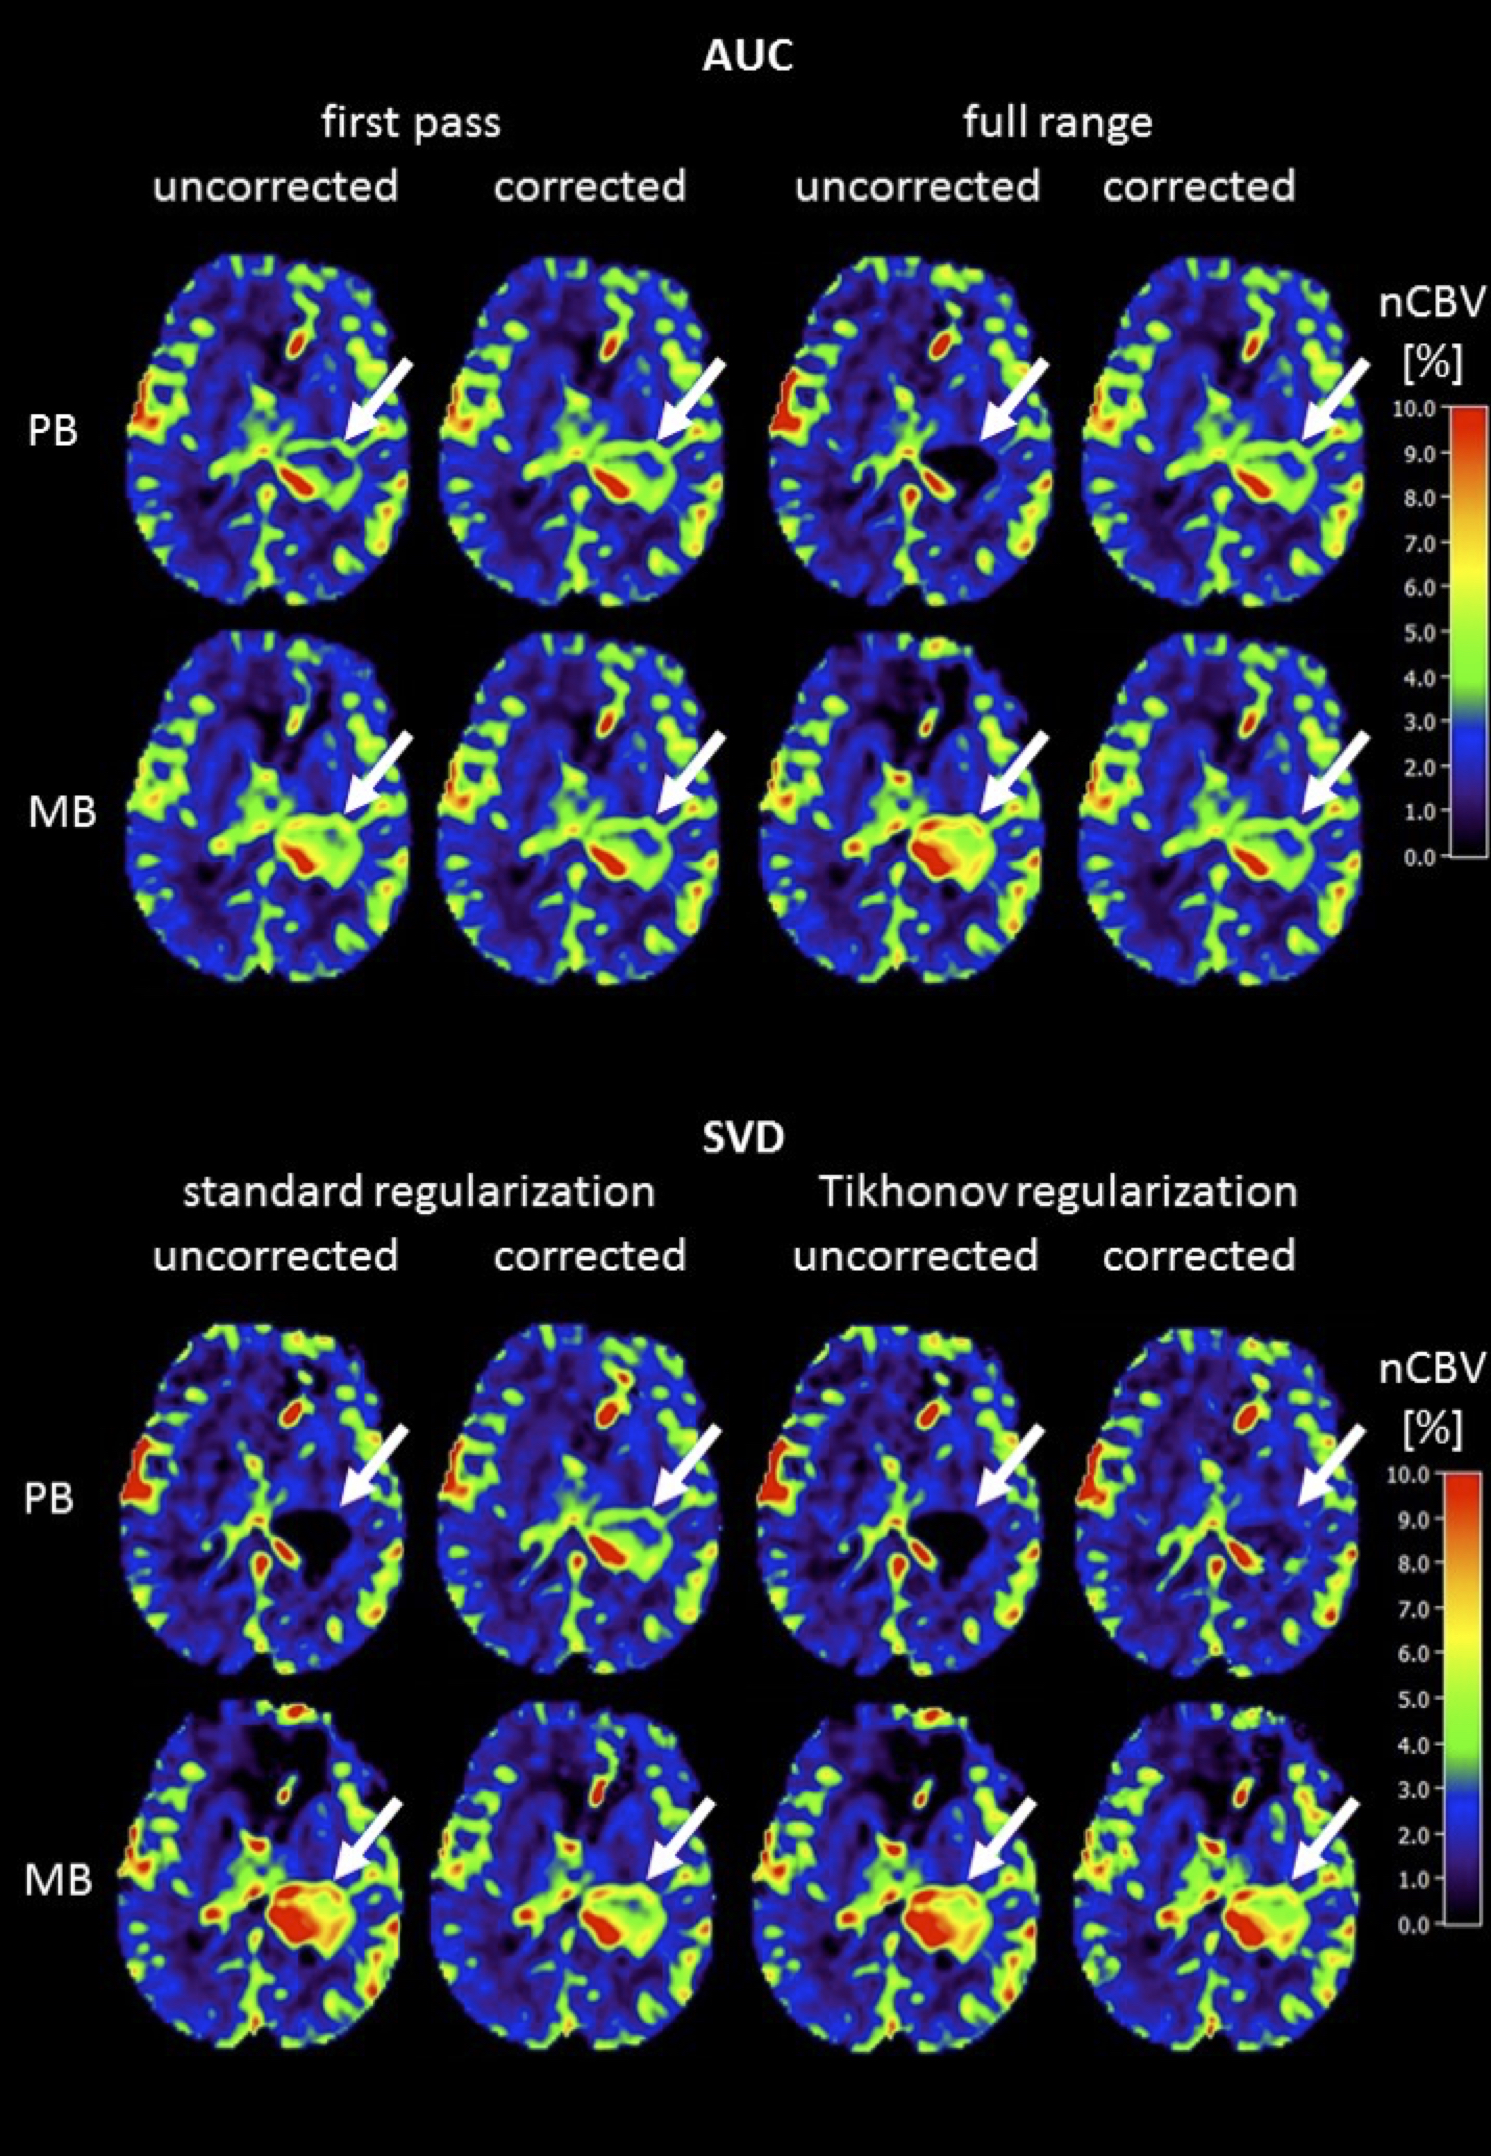
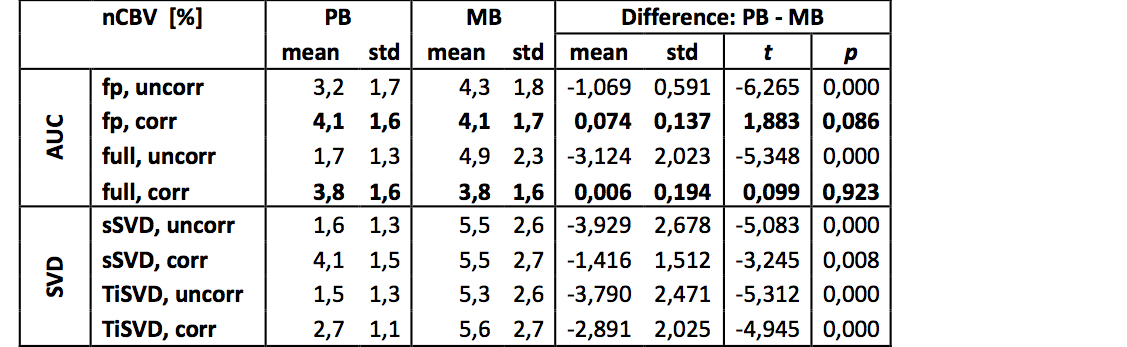
From the patient example in Figure 1 and the patient averaged values summarized in Table 1, it is obvious that uncorrected nCBV values, derived from data acquired during the prebolus, were generally rather low in contrast enhancing tumorous tissue. Clearly higher values were obtained when uncorrected nCBV was derived from data acquired during application of the main bolus, i.e. after previous application of a prebolus. Compared to the respective uncorrected nCBVs, all correction techniques effected an increase of nCBV values for data acquired during the prebolus. For data acquired during the main bolus, the opposite effect was observed for AUC, while the SVD method variants caused minor inconsistent changes. For all investigated techniques, the differences between nCBV values obtained during PB and MB were reduced after application of leakage correction. While for SVD-based methods, the differences between PB and MB derived nCBV values remained significant after correction, the corrected nCBV values for AUC based calculations were indistinguishable in our sample of 12 patients with high grade glioma.Discussion
Our results demonstrate a consistent up-correction of low uncorrected nCBV values, derived from DSC data acquired from a single dose of contrast agent, i.e. without or in this case during the prebolus. For the AUC method variants a down-correction of high uncorrected nCBV values, derived from the main bolus of contrast agent, i.e after a prebolus was observed. This confirms previous findings of predominant T1-related and T2*-related leakage effects without and with prebolus, respectively [23,4,8]. A closer look at the relative performance of the two investigated methods and their variants reveals that the AUC correction method, based on scaling of a reference curve [2,3], clearly outperforms the SVD based methods [2,4], when consistency between corrected nCBV values, obtained from PB and MB data, serves as a criterion. Using AUC-based correction, best results are obtained when integrating the full relaxation time curve. However, it is interesting to note that the uncorrected first pass integration technique already yielded results quite close to the respective corrected values. The SVD-based techniques on the other hand, at least reduce the gap between PB and MB nCBV, but do not really achieve a good match, most likely do to their higher noise sensitivity [2].Acknowledgements
No acknowledgement found.References
1. Preibisch C, Richter V, Zimmer C. MR Perfusion Imaging in: Medical Radiology - Diagnostic Imaging: Brain Tumor Imaging. Springer; 2014.
2. Kluge A, Lukas M, Toth V, Pyka T, Zimmer C, Preibisch C. Analysis of three leakage-correction methods for DSC-based measurement of relative cerebral blood volume with respect to heterogeneity in human gliomas. Magn Reson Imaging. 2016 May;34(4):410-21. doi: 10.1016/j.mri.2015.12.015.
3. Boxerman JL, Schmainda KM, Weisskoff RM. Relative cerebral blood volume maps corrected for contrast agent extravasation significantly correlate with glioma tumor grade, whereas uncorrected maps do not. AJNR Am J Neuroradiol. 2006 Apr;27(4):859-67.
4. Bjornerud A, Sorensen AG, Mouridsen K, Emblem KE. T1- and T2*-dominant extravasation correction in DSC-MRI: part I − theoretical considerations and implications for assessment of tumor hemodynamic properties. J Cereb Blood Flow Metab. 2011 Oct;31(10):2041-53. doi: 10.1038/jcbfm.2011.52. Epub 2011 Apr 20.
5. Knutsson L, Ståhlberg F and Wirestam R (2004). Aspects on the accuracy of cerebral perfusion parameters obtained by dynamic susceptibility contrast MRI: a simulation study. Magnetic Resonance Imaging 22(6): 789-798. doi 10.1016/j.mri.2003.12.002
6. Calamante F, Gadian DG and Connelly A (2003). Quantification of bolus-tracking MRI: Improved characterization of the tissue residue function using Tikhonov regularization. Magnetic Resonance in Medicine 50(6): 1237-1247. doi 10.1002/mrm.10643
7. Sanz-Requena R, Prats-Montalban JM, Marti-Bonmati L, Alberich-Bayarri A, Garcia-Marti G, Perez R and Ferrer A (2015). Automatic individual arterial input functions calculated from PCA outperform manual and population-averaged approaches for the pharmacokinetic modeling of DCE-MR images. JMRI 42(2): 477-487. doi 10.1002/jmri.24805.
8. Boxerman JL, Prah DE, Paulson ES, Machan JT, Bedekar D, Schmainda KM. The Role of preload and leakage correction in gadolinium-based cerebral blood volume estimation determined by comparison with MION as a criterion standard. AJNR Am J Neuroradiol. 2012 Jun;33(6):1081-7. doi: 10.3174/ajnr.A2934.
Figures