2210
Identifying Isocitrate Dehydrogenase Genotype in Low-grade Glioma Non-invasively using Amide Proton Transfer-Weighted (APTW) Imaging1Department of Radiology, Johns Hopkins University School of Medicine, Baltimore, MD, United States, 2Department of Radiology, Southern Medical University, Zhujiang Hospital, Guangzhou, People's Republic of China, 3Department of Pathology, Johns Hopkins University School of Medicine, Baltimore, MD, United States, 4Department of Pathology, Southern Medical University, Zhujiang Hospital, Guangzhou, People's Republic of China
Synopsis
We explored the radiographic features of isocitrate dehydrogenase (IDH) wildtype and mutated tumors in glioma patients preoperatively using APTW imaging at 3 Tesla. 26 patients with newly suspected low-grade gliomas were recruited, surgical specimens were obtained for pathological analysis, and corresponding APTW signal intensities were recorded. Results showed that the IDH1 wild-type tumors had significantly higher APTW signal intensity than the IDH1 mutant tumors. The area under the ROC curve (AUC) for APTW to differentiate IDH1 wild-type from IDH1 mutant was 0.750. APT imaging has the potential for discriminating IDH genotypes in WHO grade-II gliomas.
Target audience
Researchers and clinicians who are interested in clinical CEST imaging applications and radiogenomics.Purpose
Gliomas, the most common CNS primary tumors in adults, yield widely various clinical outcomes. Current pathologic and practical evidence proved that mutations in isocitrate dehydrogenase (IDH) genes, which occur in the majority of WHO grade-II and -III gliomas and secondary glioblastomas, are associated with favorable prognosis (1, 2). Since IDH-genes-encoded proteins are closely involved in energy-producing Kreb cycle as catalytic isozymes, mutations of IDH genes arouse widespread metabolic disturbances of the cellular metabolome, including alteration of amino acid concentration and enzymatic activity (3, 4). Amide proton transfer-weighted (APTW) imaging is a novel molecular technique that gives contrast based in large part on endogenous cytosolic proteins and peptides (5, 6). APTW MRI has previously shown promising applications for assessing malignant brain tumors (7-9). We predictively assessed the APTW MRI features for grade-II gliomas, with the hypothesis that APTW signal may serve as a surrogate imaging maker for identifying IDH mutation status preoperatively.Methods
Subjects
Between May 2013 and August 2016, 26 patients with newly suspected LGGs (mean age, 37.3 ± 12.6 years; range, 18–51 years; without surgical intervention, radiotherapy, or chemotherapy) were recruited prior to their surgical procedure. Written, informed consent was obtained from each subject.
MRI protocol
All patients were scanned on a Philips 3T MRI system. The sequences performed for each patient included: T2W; FLAIR; T1W; APTW; and Gd-T1W. A fast 3D APTW imaging sequence (RF saturation power = 2 μT; saturation time = 800 ms; 15 slices; slice thickness = 4.4 mm) was used (8). To correct for B0 field inhomogeneity effects, APTW imaging was acquired with a six-offset protocol (±3, ±3.5, ±4 ppm from water), together with a WASSR B0 scan (10). The APTW scan time was 8 min 6 sec. APT-weighted (APTW) images were calculated using MTRasym(3.5ppm) (7-9).
Histological and image analysis
Patients proceeded with their clinically indicated brain biopsy after MRI scanning. All pathological specimens were examined by an experienced neuropathologist, and the IDH1 mutation status was assessed with immunohistochemical stain to evaluate the expression of IDH1-R132H mutant protein. Quantitative APTW image analysis was performed by a neuroradiologist. For each patient, five small regions of interesting were drawn within the T2w/FLAIR hyperintense lesion area, and the maximum APTW (APTWmax), the minimum APTW (APTWmin), the average APTW (APTWave), and the APTW heterogeneity within the lesion (APTWhet = APTWmax – APTWmin) were calculated. The relative APTW signal intensity values compared with the contralateral normal brain area were reported.
Statistical analysis
The comparisons of APTW intensities between the IDH1 wild-type and mutant tumors were performed using an independent samples t-test to analyze the statistical differences. The accuracy for the differentiation of IDH1 wild-type and IDH1 mutant, and the corresponding optimal cut-off values were determined by a receiver operator characteristics (ROC) analysis. The alpha level of all tests was set at P < 0.05.
Results and Discussion
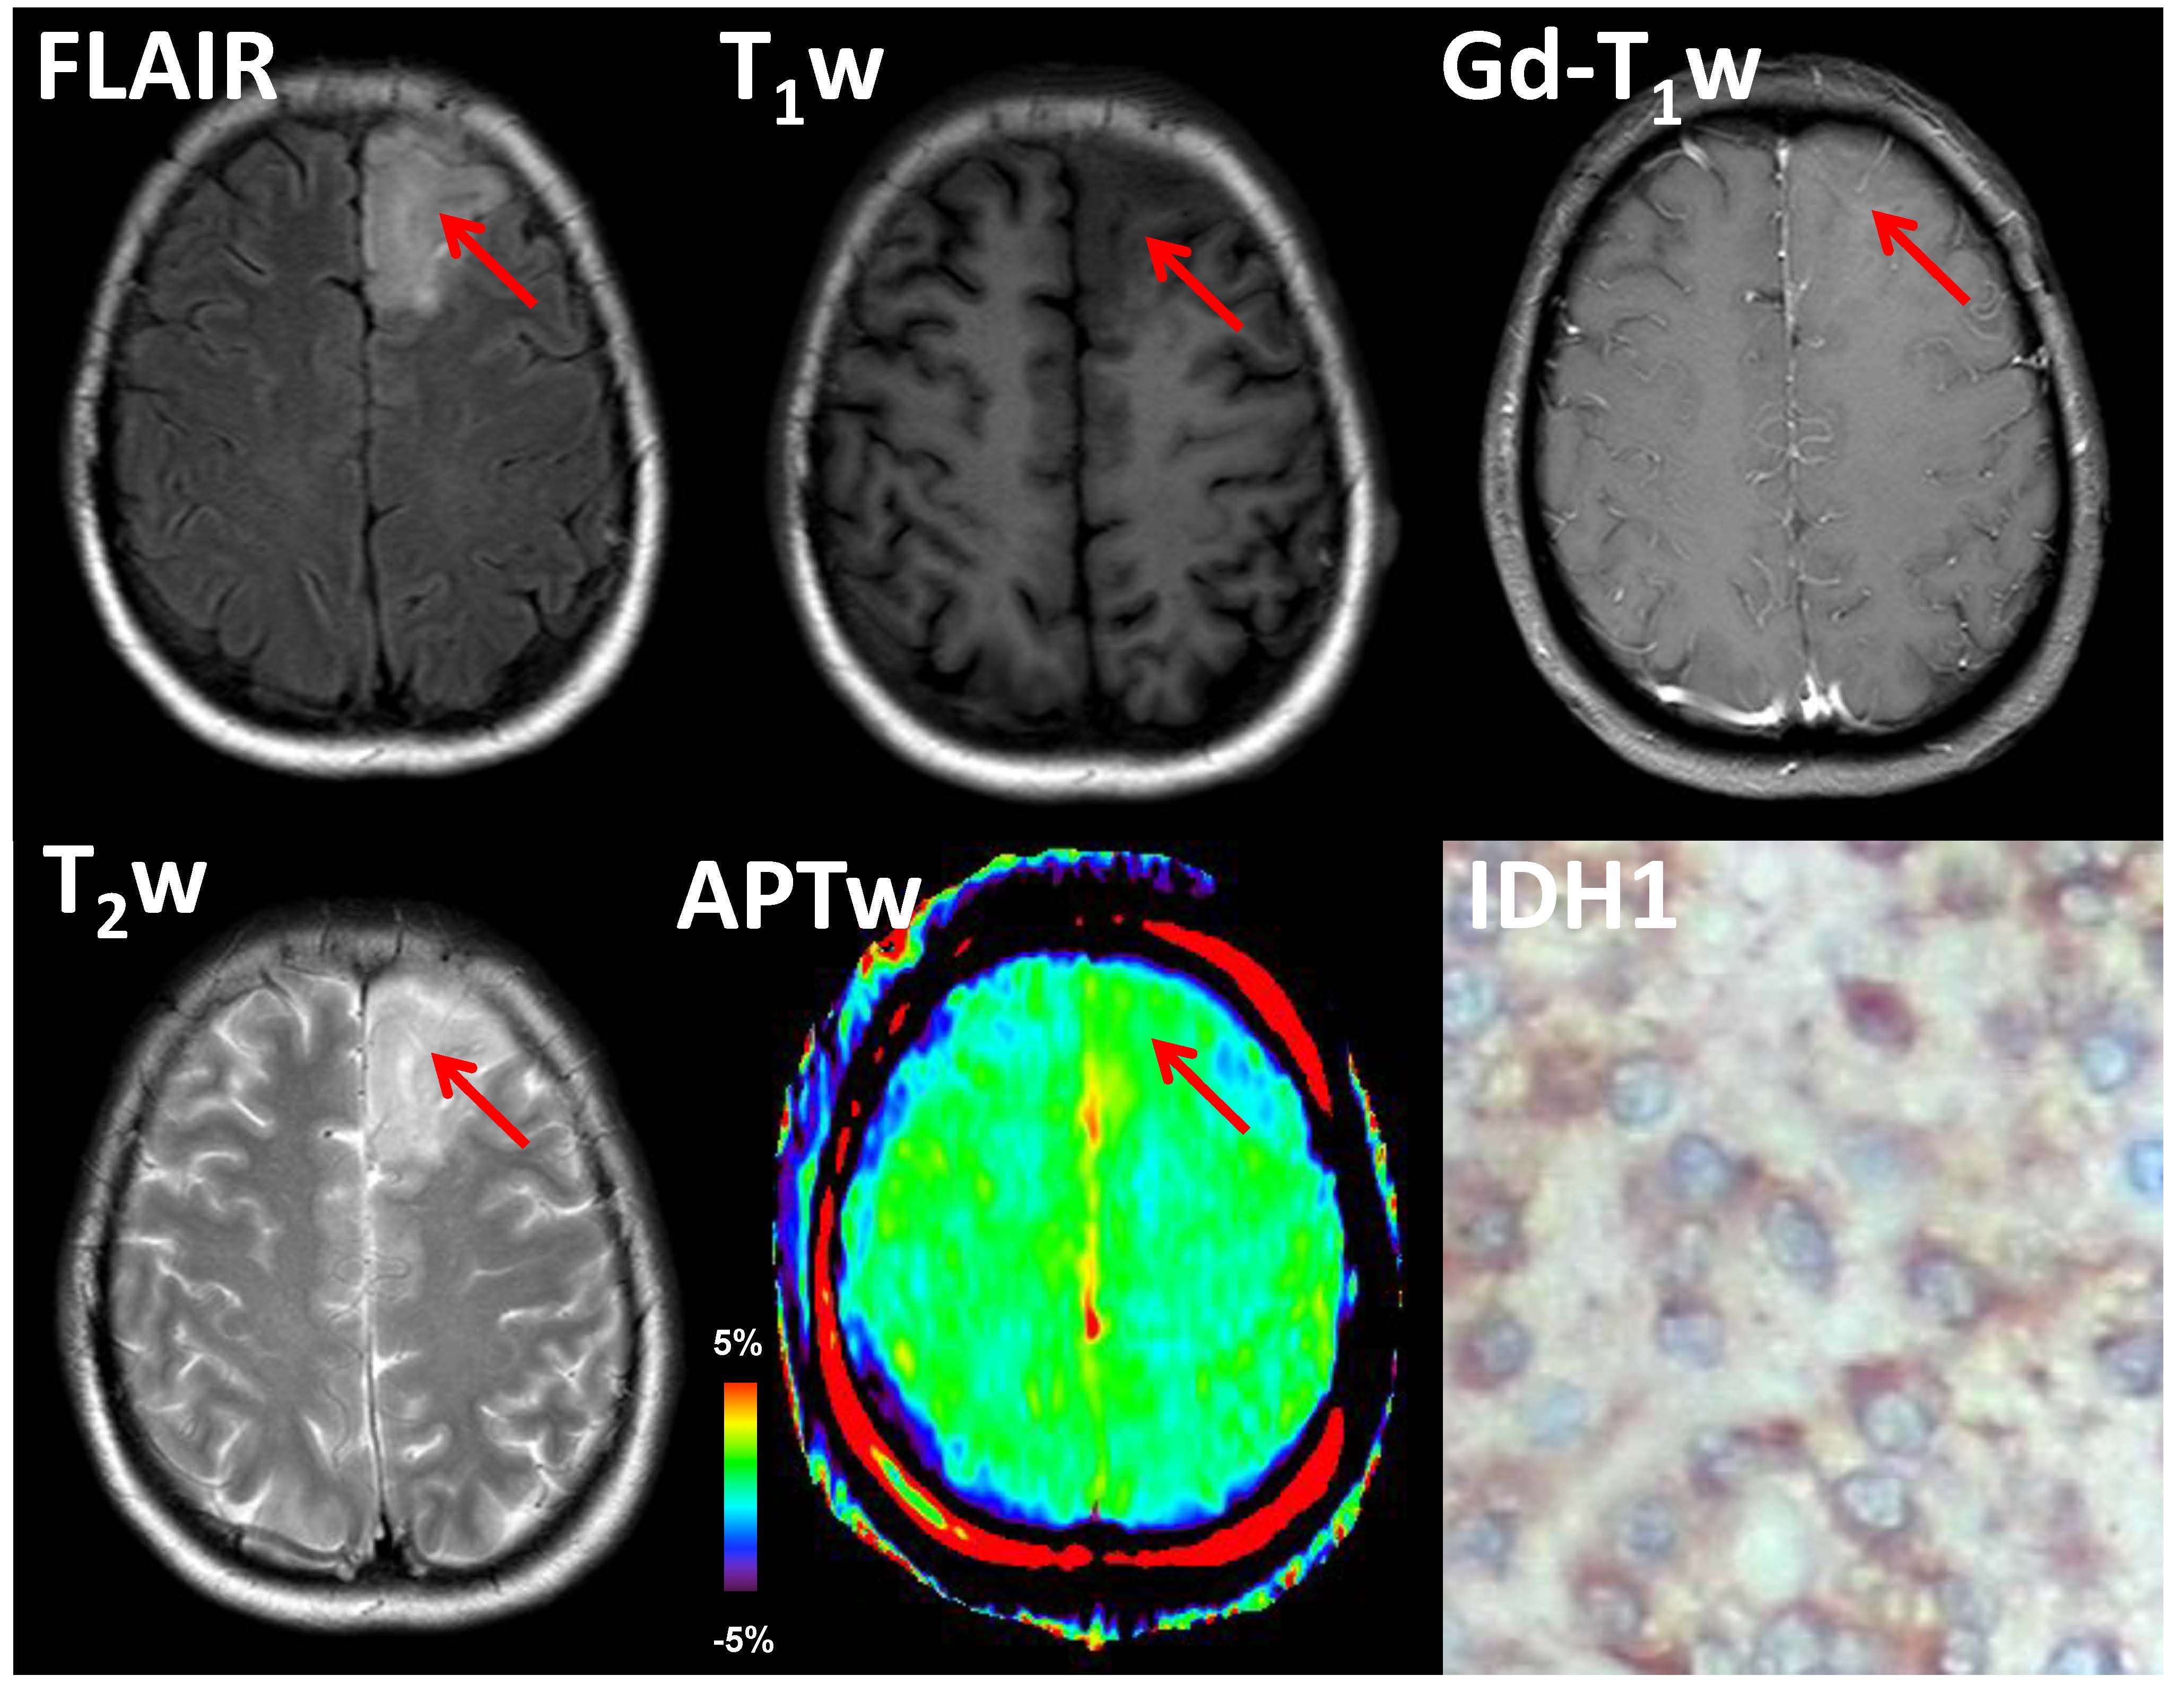
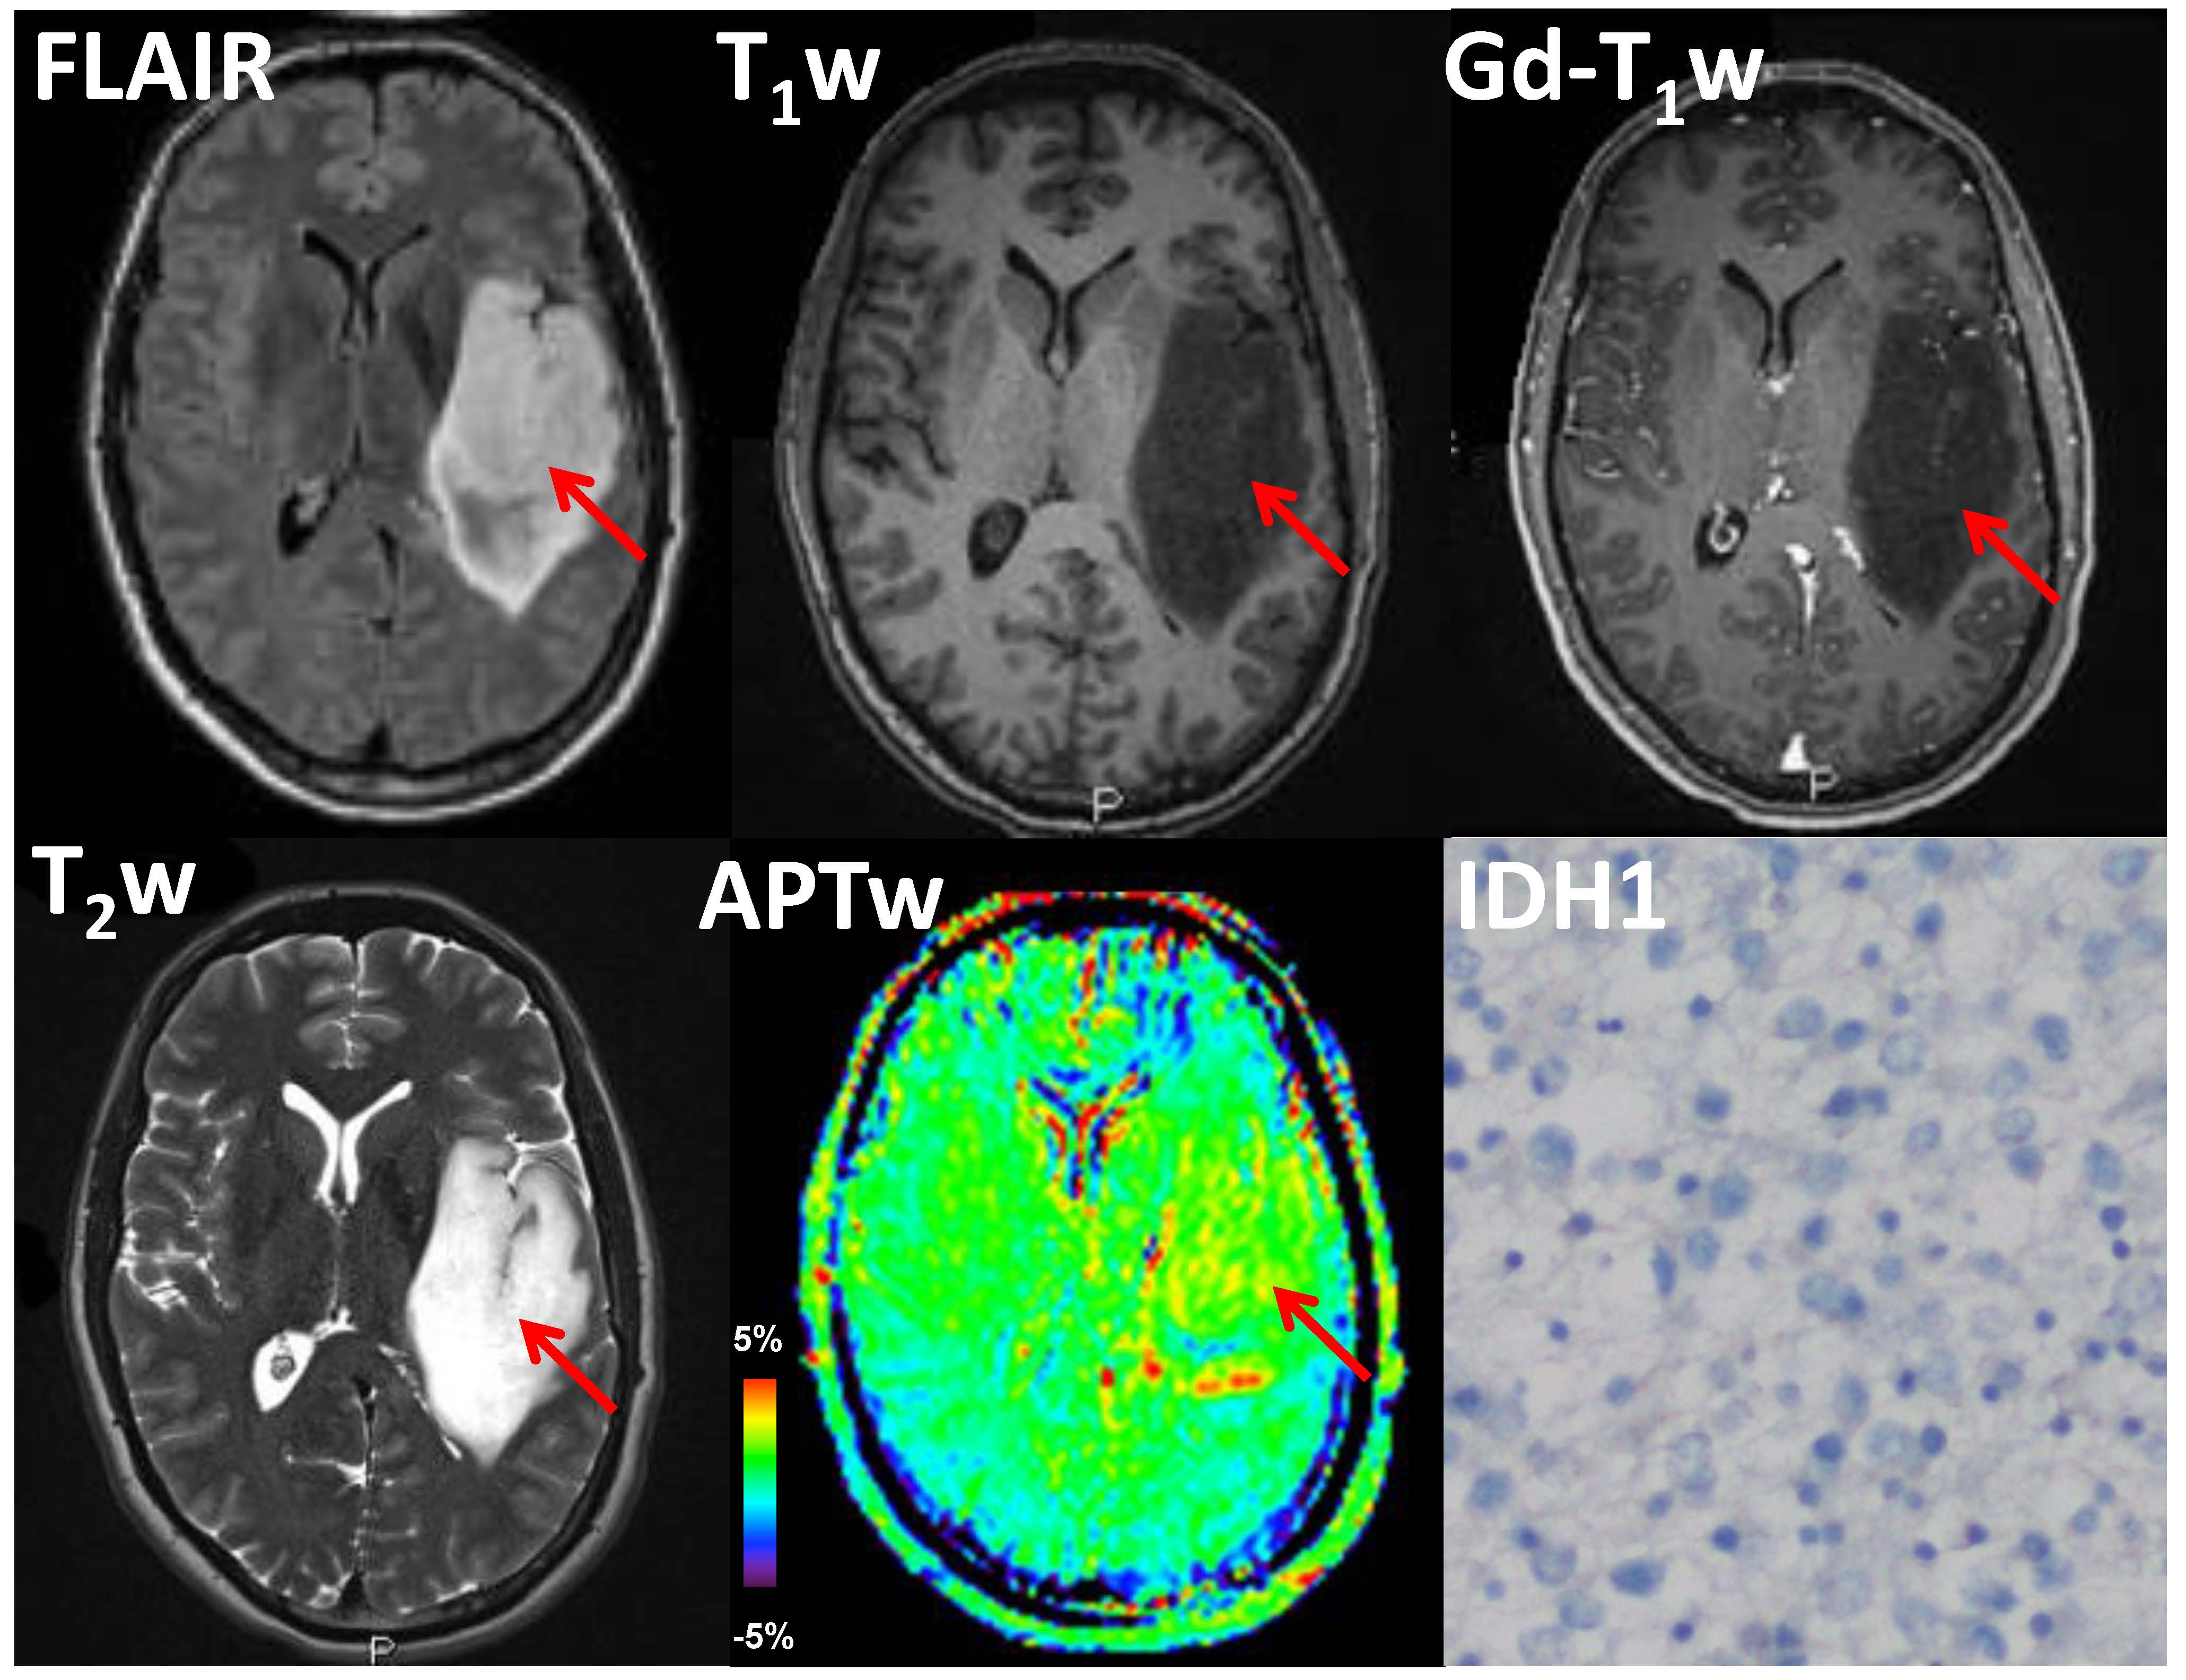
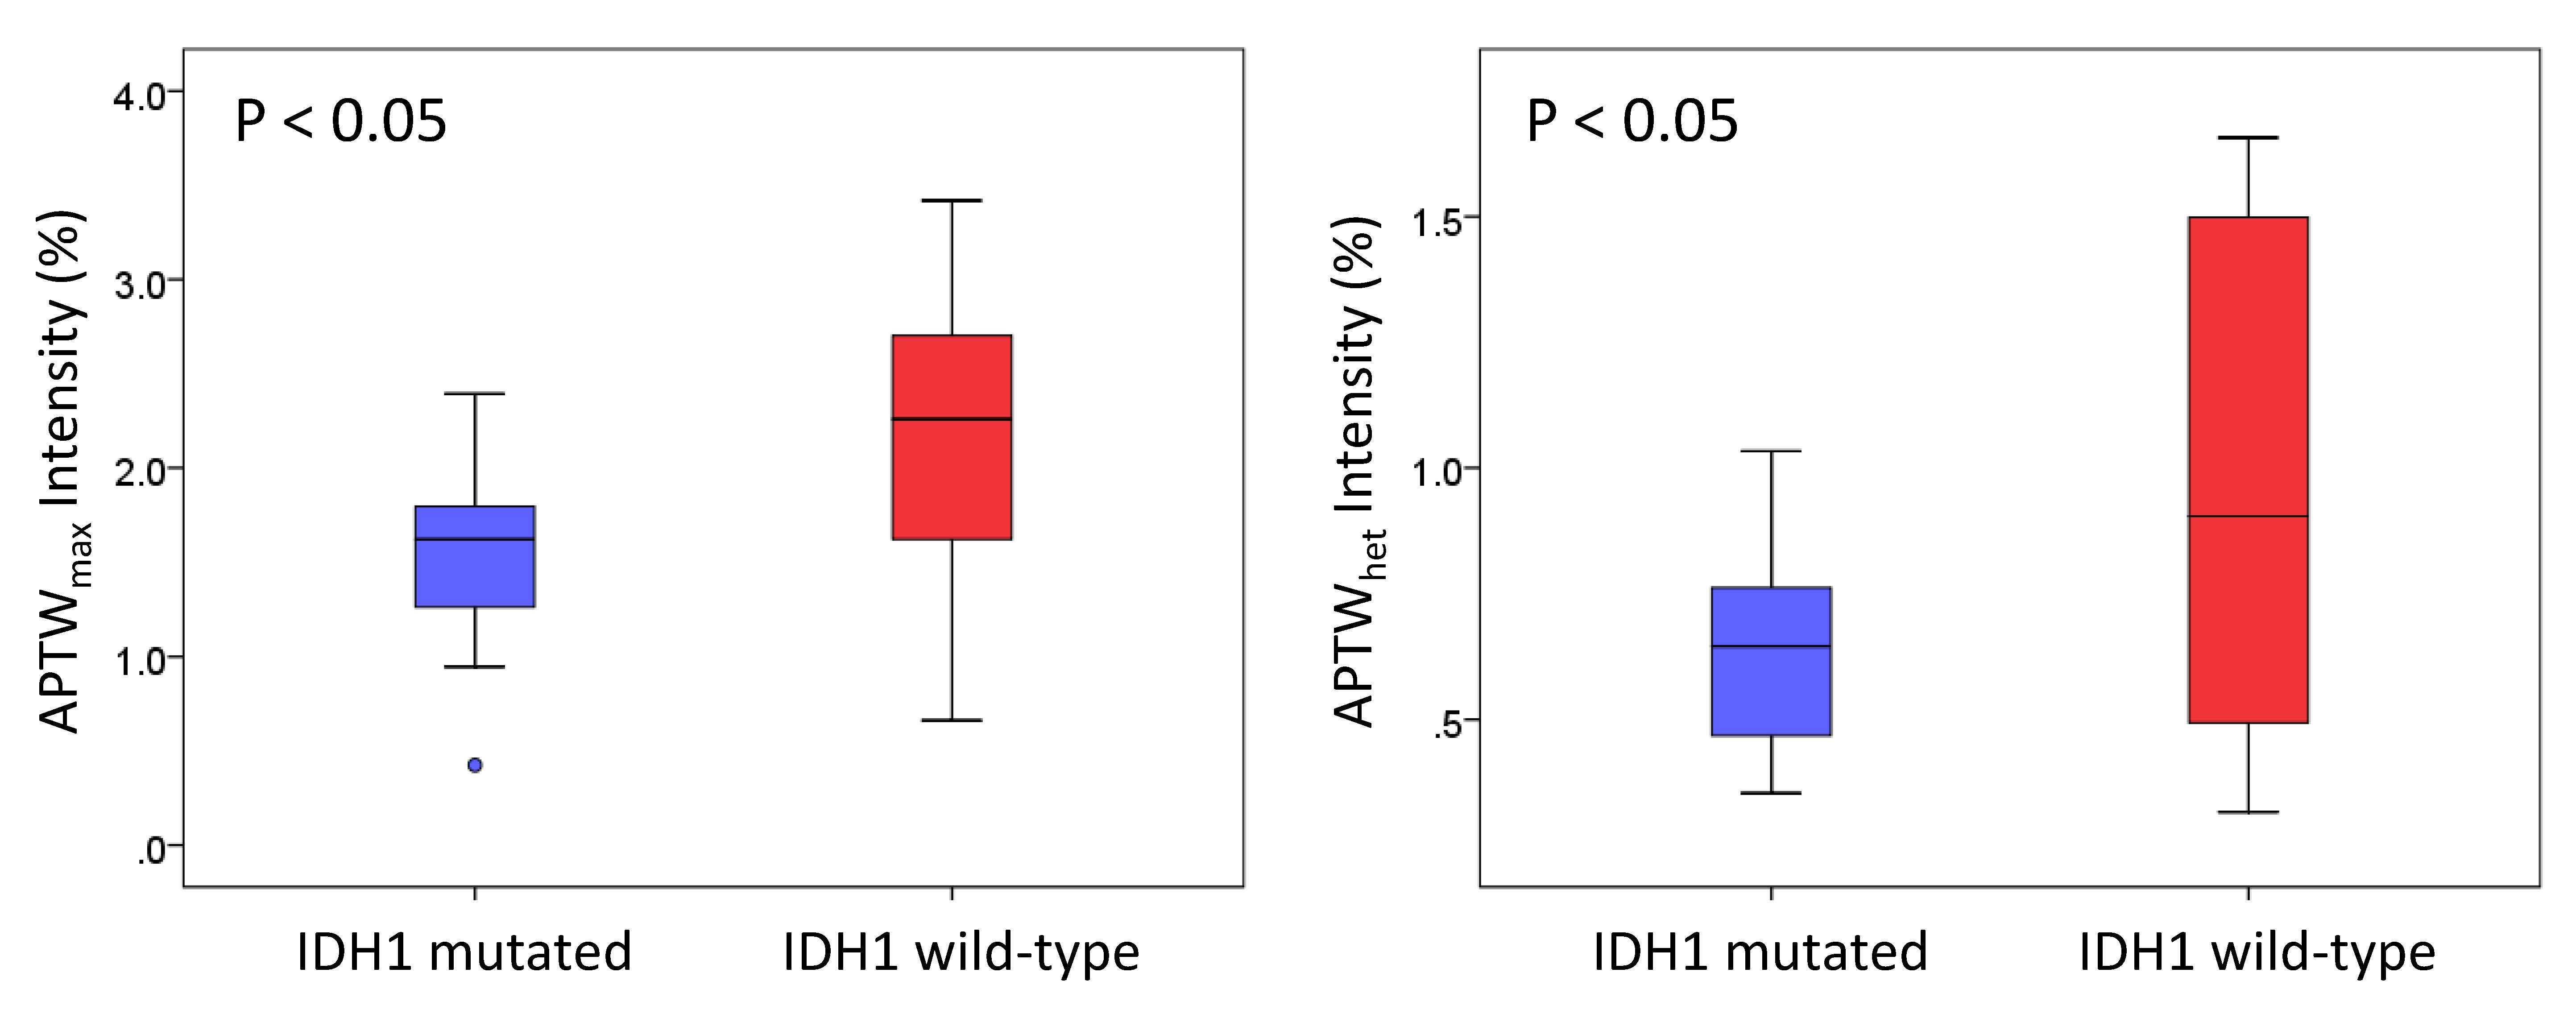
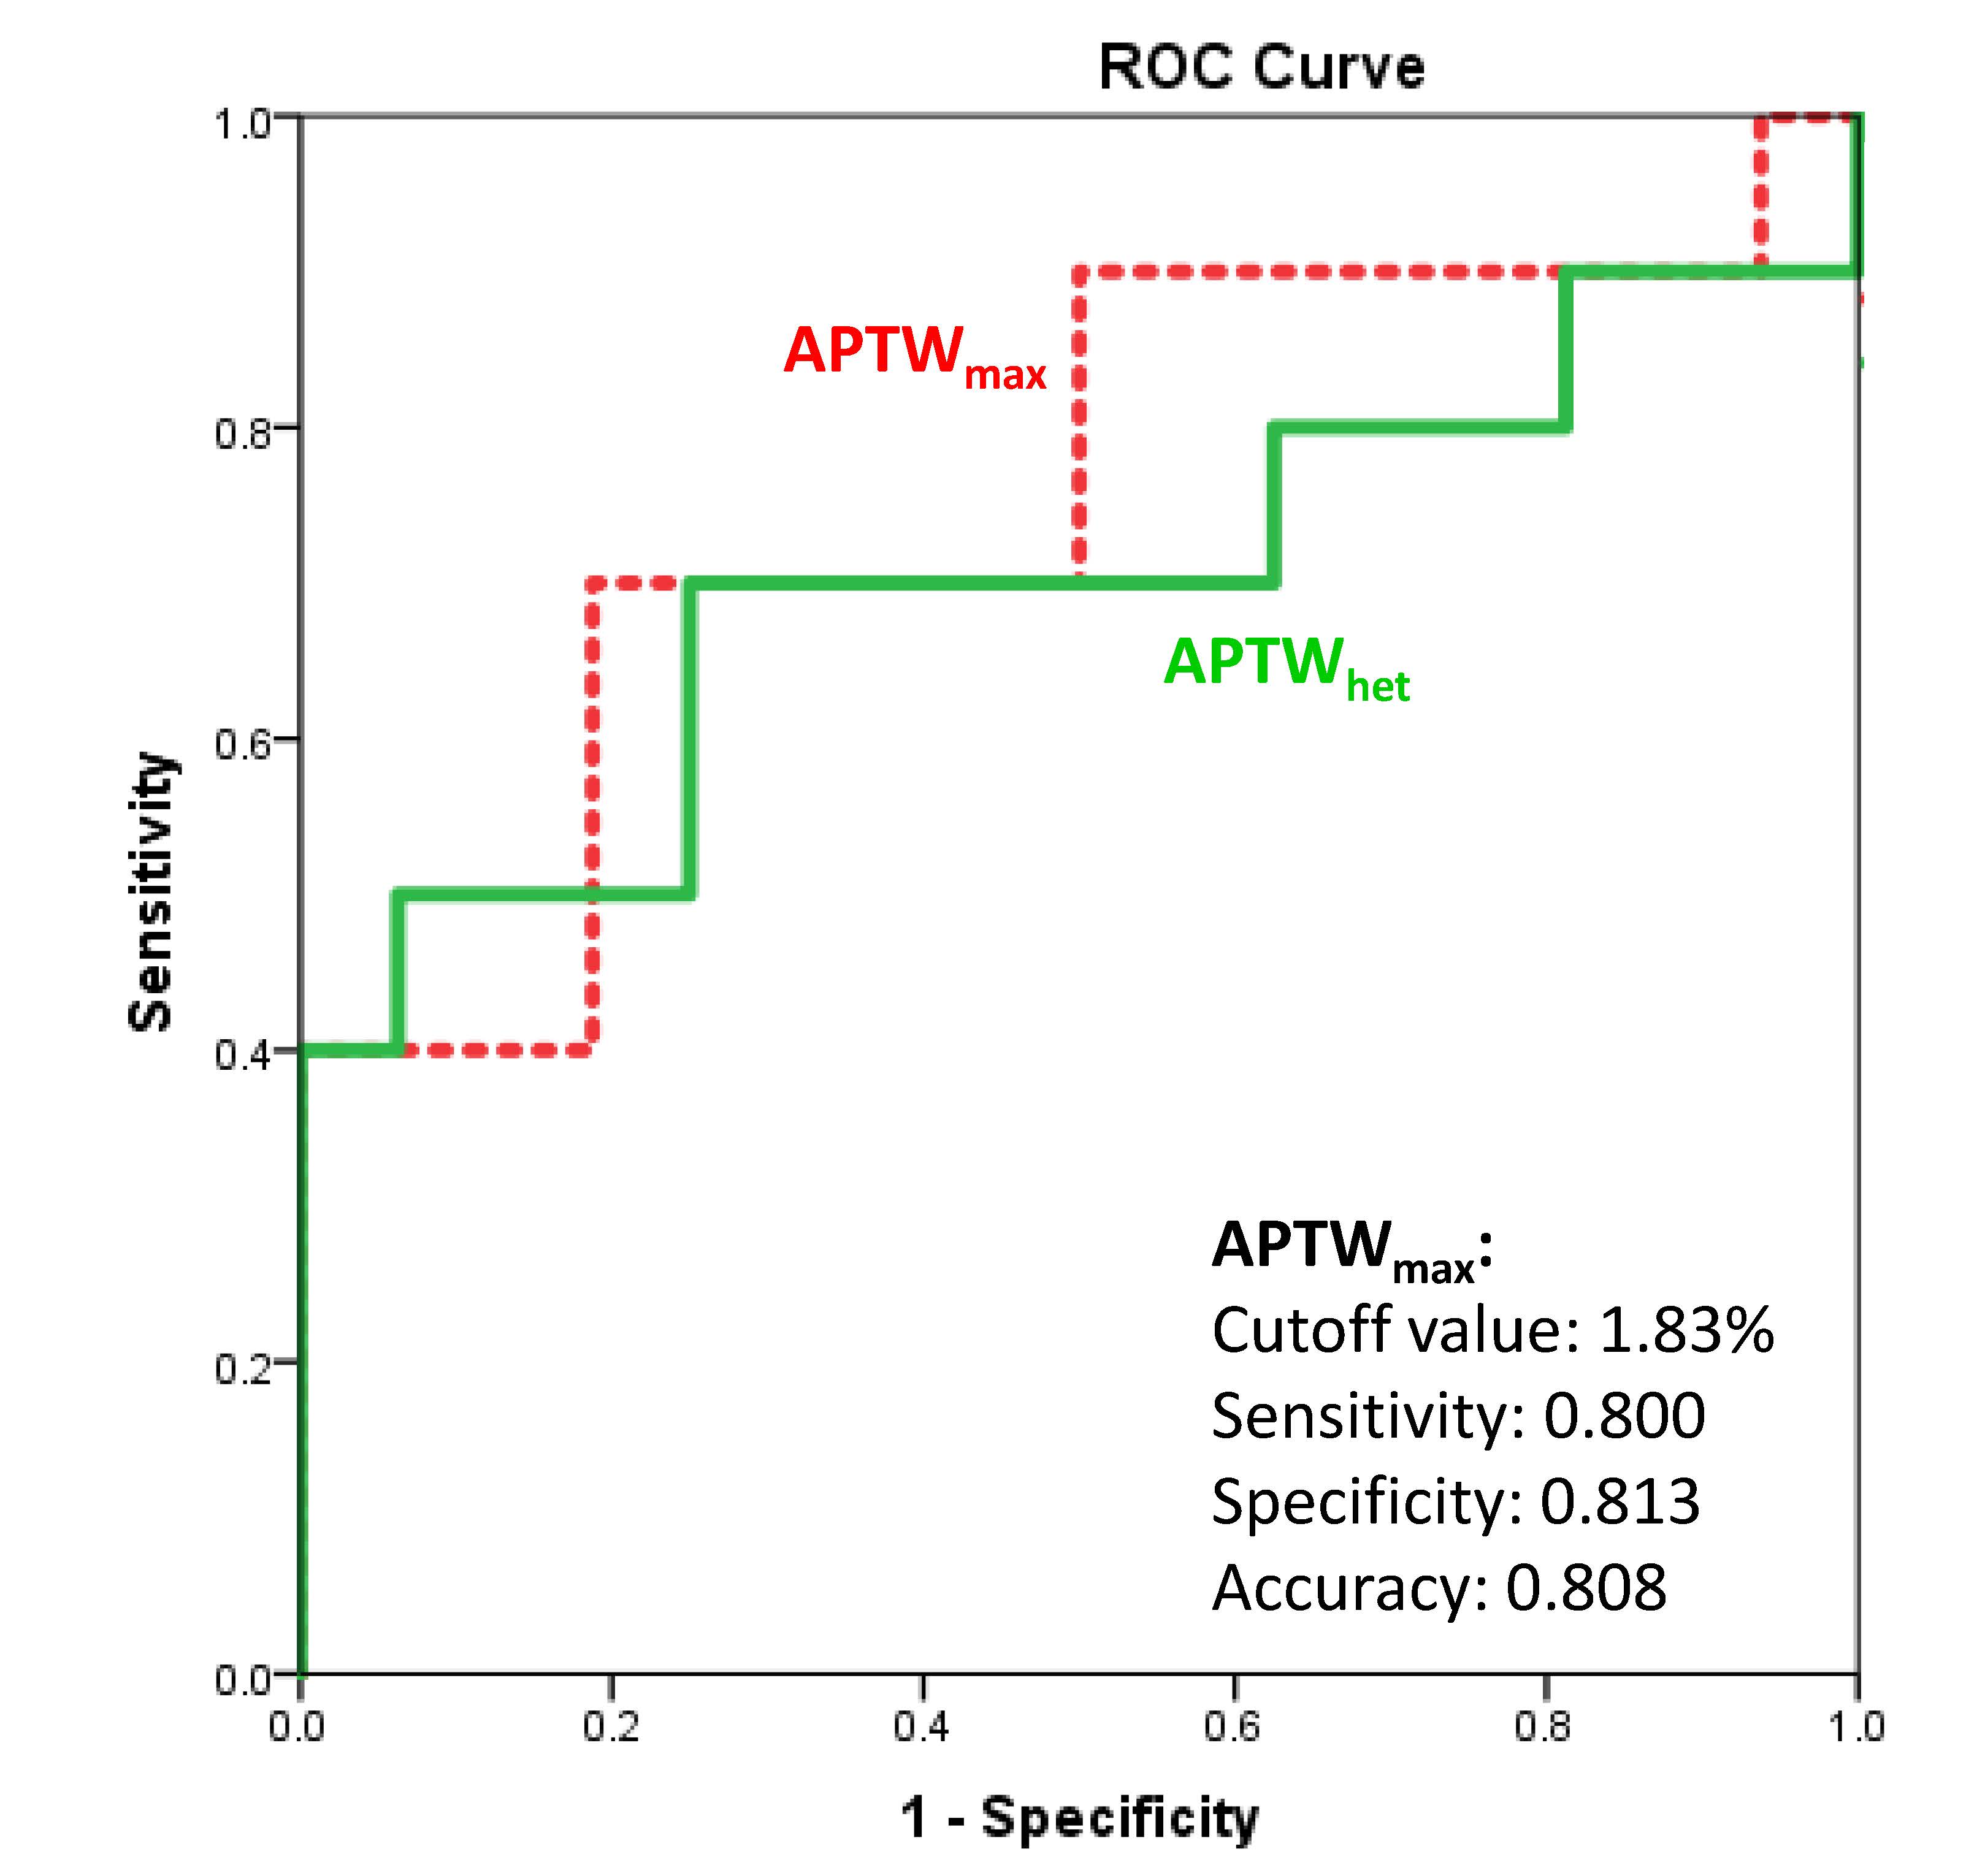
16 of 26 grade II gliomas were pathologically confirmed as IDH1 wild-type, and the remaining 10 were confirmed as IDH1 mutated. APTW images demonstrated relatively homogeneous, iso-intensity to minimal hyperintensity in the IDH1 mutant lesions (Fig. 1), but scattered punctuate, mild hyperintensity in most IDH1 wild-type lesions (Fig. 2). Quantitative ROI analysis (Fig. 3) showed that the IDH1 wild-type group had significantly higher APTWmax (2.90 ± 0.37% vs. 2.28 ± 0.47%; P < 0.05), significantly higher APTWhet (1.15 ± 0.33% vs. 0.77 ± 0.23%; P < 0.05), and marginally significantly higher APTWave (1.69 ± 0.66% vs. 1.27 ± 0.47%; P = 0.07) than the IDH1 mutant group in grade II gliomas. Based on the ROC analysis, APTWmax had the highest area under the curve (0.750) and accuracy (80.8%) in differentiating IDH1 wild-type from IDH1 mutated lesions, with the cutoff value of 1.83% (Fig. 4). Our result is consistent with a recent study by Xiong et al. (10), who reported that IDH mutations significantly correlated with a lower cell proliferation in grade II oligodendroglial tumors, thus leading to a lower APTW signal.Conclusion
The preliminary results suggest that the APTW signal could be a valuable imaging biomarker to identify IDH1 mutation status in grade-II gliomas. IDH1 mutated lesions are typically correlated with relatively homogeneous, low APTW signal intensity, compared with IDH1 wild-type lesions. Non-invasive prediction of IDH1 mutation status without surgery procedures could provide supplementary information about the prognosis of grade-II gliomas.Acknowledgements
This work was supported in part by grants from the NIH (EB009731, CA166171, EB015032, and EB015909).References
(1) Pollard et al. Science 324,192 (2009). (2) Kloosterhof et al. Lancet Oncol 12, 83 (2011). (3) Reitman et al. Proc Natl Acad Sci 8, 3270 (2011). (4) Ichimura et al. Neuro-oncology 4, 342 (2009). (5) Ward et al. JMR 143, 79 (2000). (6) Zhou et al. Nature Med. 9, 1085 (2003). (7) Wen et al. NeuroImage 51, 616 (2010). (8) Zhou et al. JMRI 38, 1119 (2013). (9) Togao et al. Neuro-oncology 16, 441 (2014). (10) Xiong et al. Eur Radiol. 26, 1705 (2016).Figures