2209
Can q-space imaging differentiate meningioma from cranial nerve schwannoma?1Radiology, Kyoto Prefectural University of Medicine, Kyoto, Japan, 2Radiological Sciences, David Geffen School of Medicine at UCLA, 3Radiology, Johns Hopkins University, 4Neurosurgery, Kyoto Prefectural University of Medicine, Kyoto, Japan
Synopsis
Q-space imaging (QSI) is an extended version of diffusion weighted image technique which can be utilized for observing microstructure of brain in micrometer order. In order to assess whether QSI can differentiate between the two most common extra-axial brain tumors of the posterior fossa, we performed histogram analyses as well as ROC analyses on the q-space data of meningioma and cranial nerve schwannoma (CNSch). We also assessed the apparent diffusion coefficient (ADC) for comparison. As a result, we have shown that mean displacement derived from QSI as well as ADC are able to differentiate meningioma from CNSch.
Purpose
Meningioma and cranial nerve schwannoma (CNSch) are the most common extra-axial brain tumors of cerebellopontine angle (CPA) in adult 1. The potential usefulness of diffusion weighted image (DWI) techniques to differentiate these two entities has previously been reported 2,3. One of the extended version of DWI techniques, known as q-space imaging (QSI), has also been utilized for assessing microstructure of human brain in micrometer order 4,5. The purpose of this study was to assess the usefulness of QSI for differentiating meningioma from CNSch in CPA tumors. We compared mean displacement (MD) derived from QSI as well as ADC. The histogram analyses were employed for the whole mass.Materials and Methods
Subjects
This retrospective study was approved by the institutional review board. Thirteen patients with meningioma (1 men, 12 female, mean 61.7 ±10.0 years old) and 5 patients with CNSch (2 men, 3 female, mean 57.0 ±11.6 years old) were enrolled from April 2011 to May 2013 in our hospital. The tumor locations were not only CPA but intracranial.
Data acquisition
MRI examinations were performed on a 1.5T whole-body imager (Philips Medical Systems, Best, the Netherlands). QSI was acquired using a single-shot EPI [TR/TE = 6,000/173 ms], Δ/δ = 142/17 ms, and a matrix of 128 x 128. The b values used were 0, 10, 60, 100, 300, 600, 1,000, 3,000, 6,000, and 10,000 s/mm2. MPGs were applied from 15 directions. A total of twelve 3-mm-thick sections were obtained without gaps. The total acquisition time was 25 min.
Data post-processing and analysis
Histogram analysis
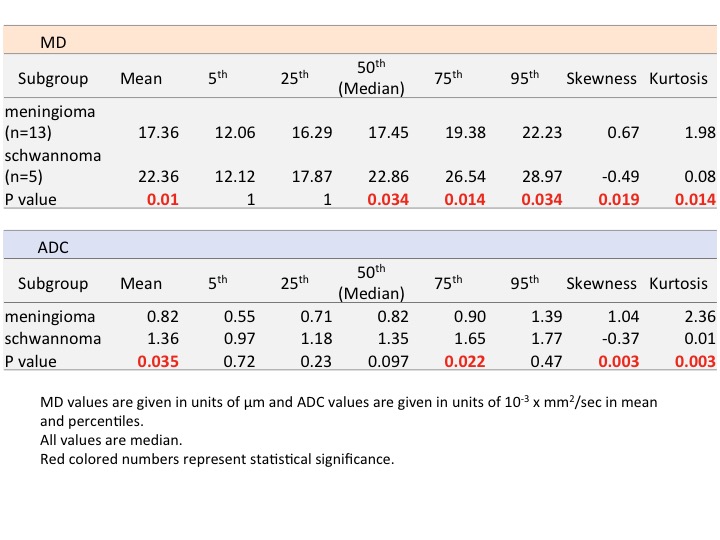
MD and ADC were calculated by in-house software (written in Matlab® code). The regions of interest (ROI) were drawn on every slice of the whole tumor on b = 0 images or DWI images, with reference to corresponding T2-weighted and contrast-enhanced T1-weighted images. The ROIs were overlaid and obtained MD and ADC values. Histogram analyses were performed at the 5, 25, 50, 75, and 95th percentiles for ROI of each patient. The kurtosis and skewness of the histograms were calculated, respectively. The differences of those histogram measures between meningioma and schwannoma were compared by Mann-Whitney’s U-test with Bonferroni correction (P < 0.05 as significant).
ROC analysis
To determine
the diagnostic ability of QSI, the receiver operating characteristic (ROC)
analyses were performed for the histogram measures (Table 1). The differences
between mean MD and each percentile of MD were tested by DeLong’s test (P < 0.05 as significant).
Results and Discussion
Histogram analysis of MD and ADC Values
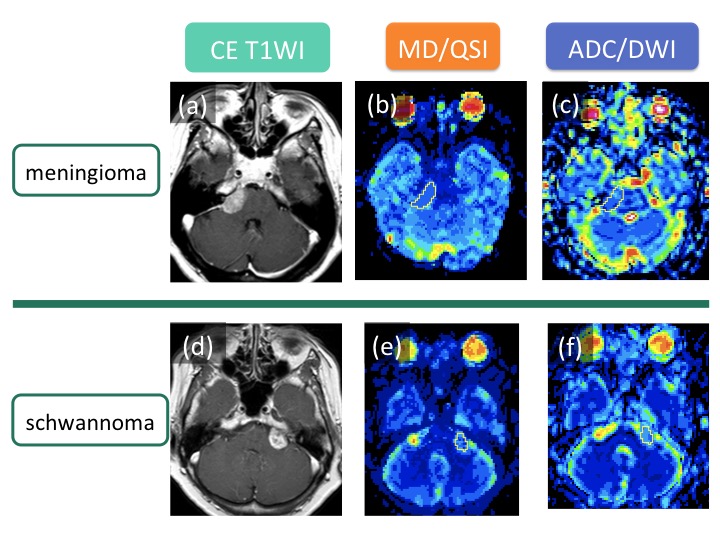
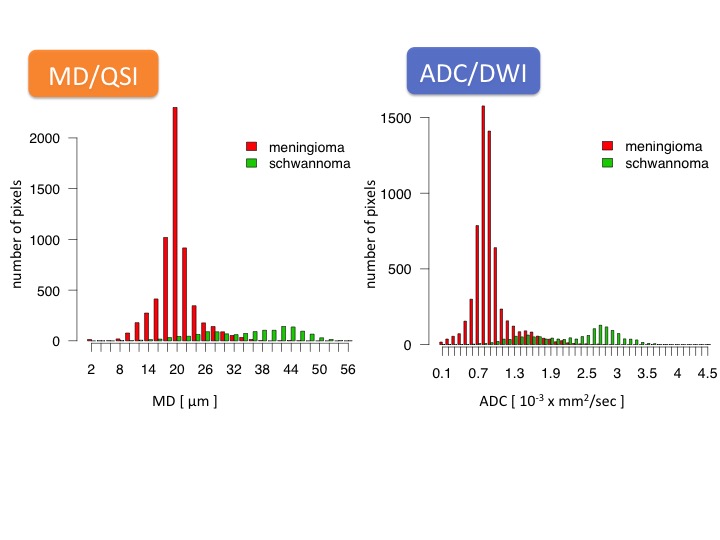
Figure 1 shows representative cases of meningioma and schwannoma. Figure 2 shows histograms of meningioma and schwannoma for all patients. The distribution of MD and ADC of schwannoma, which had two peaks, was wider than that of meningioma. Table 1 shows the comparison of histogram measures between meningioma and schwannoma. Significant differences were found in the following parameters; MD: mean, 50th, 75th, 95th, skewness, kurtosis; ADC: mean, 75th, skewness, kurtosis. Higher percentile (≥ 50th) of histogram showed significant difference in both MD and ADC. There were also significant differences in kurtosis and skewness of both MD and ADC, unlike previous report 3.
ROC analysis
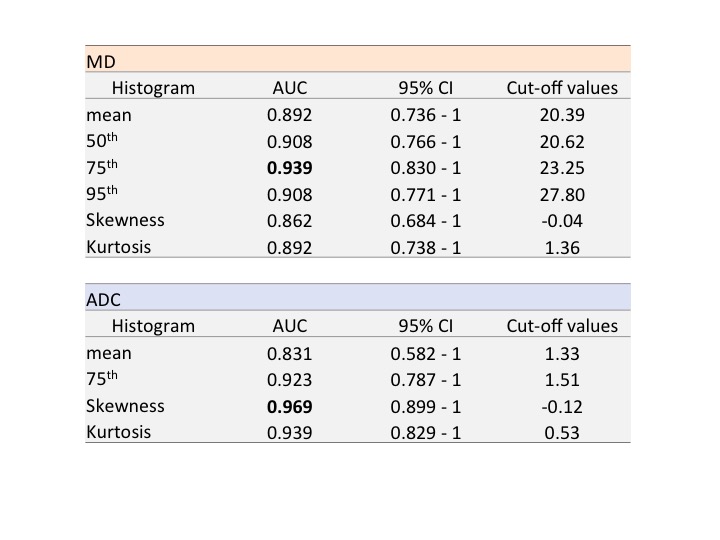
Table 2 shows the results of ROC analysis for measures which showed significant difference (P < 0.05) in Table 1. The 75th percentile of both MD and ADC showed higher area under the curve (AUC) among the percentiles. There were no significant differences between mean and 75th percentile in either MD (P = 0.308) or ADC (P = 0.171). Pathologically, schwannoma comprised of two basic patterns in varying proportions: Antoni type A and type B and Antoni type B were less cellular, loosely textured cells. The higher MD values may reflect low cell density area of Antoni type B as well as ADC 1,2,3.
Acknowledgements
No acknowledgement found.References
1. Bonneville F, Savatovsky J, Chiras J. Imaging of cerebellopontine angle lesions: an update. Part 1: enhancing extra-axial lesions. Eur Radiol. 2007;17:2472–2482.
2. Yamasaki F, Kurisu K, Satoh K, et al. Apparent diffusion coefficient of human brain tumors at MR imaging. Radiology. 2005;235:985–991.
3. Xu X-Q, Li Y, Hong X-N, Wu F-Y, Shi H-B. Radiological indeterminate vestibular schwannoma and meningioma in cerebellopontine angle area: differentiating using whole-tumor histogram analysis of apparent diffusion coefficient. Int J Neurosci. 2016;1–8. http://dx.doi.org/10.3109/00207454.2016.1164157. Accessed November 9, 2016.
4. Hori M, Fukunaga I, Masutani Y, et al. Visualizing non-Gaussian diffusion: clinical application of q-space imaging and diffusional kurtosis imaging of the brain and spine. Magn Reson Med Sci. 2012;11:221–233.
5. Yamada K, Sakai K, Akazawa K, Sugimoto N, Nakagawa M, Mizuno T. Detection of early neuronal damage in CADASIL patients by q-space MR imaging. Neuroradiology. Springer-Verlag. 2013;55:283–290.
Figures