2208
Do gadolinium-based contrast agents alter 23Na T1 relaxivity in glioma?1Department of Radiology, University of Cambridge, Cambridge, United Kingdom, 2Cancer Research UK Cambridge Institute, University of Cambridge, Cambridge, United Kingdom, 3GE Global Research, Munich, Germany, 4Neurosurgery Division, Dept. of Clinical Neurosciences, University of Cambridge, Cambridge, United Kingdom
Synopsis
Incomplete fluid suppression on fluid-attenuated inversion-recovery 23Na-MRI (IR-23Na-MRI) was observed in three patients undergoing IR-23Na-MRI after gadolinium contrast injection, as part of a brain tumour imaging study. To evaluate this, 23Na-MRI T1 maps were acquired before and after injection of a gadolinium-based contrast agent on a grade IV glioma (GBM) patient, which showed a statistically significant change of 23Na-MRI T1 within the peritumoral oedema (p=0.0095). Gadolinium contrast-enhanced 23Na-MRI could potentially add further applications for sodium imaging and probe tumour tissue structure in new ways to investigate proliferation and treatment response.
Introduction
Gadolinium-based contrast agents (Gad) are commonly used for the diagnosis and monitoring of changes in perfusion and blood-brain barrier integrity in neurological conditions using clinical 1H-MRI. It has previously been demonstrated that Gad can alter 23Na chemical shift.1 The effect is however small compared to dedicated 23Na chemical shift reagents that can be utilized to separate intra and extracellular sodium. Separation of intra and extracellular sodium is of clinical interest, however dedicated 23Na contrast agents are based on heavy metals and are toxic in humans. Triple quantum filtered (TQF) 23Na-MRI is the gold standard for separating intra from extracellular sodium using MRI, but is limited by low resolution and long acquisition times.2 In vivo studies have recently employed inversion-recovery sodium fluid attenuation (IR-23Na-MRI), due to its ease of implementation and short acquisition times compared to TQF.3,4
However, the effect of Gad on these IR sequences is unknown. This study has assessed the effects of clinical concentrations of Gad in IR-23Na-MRI of brain tumors.
Methods
Three patients with brain tumors (2 glioblastoma (GBM), 1 metastases) were imaged between 15 and 60 minutes after Gadobutrol (Bayer Schering Pharma AG, Berlin, Germany) injection on a 3T GE MR750 (GE Healthcare, Waukesha, WI) using a dual-tuned 1H/23Na volume head coil (Rapid Biomed, Germany) using a 3D-cones sequence5 (TE=0.5ms, TR=112-130ms,resolution=3.75mm isotropic, 30cm FOV, 500µs hard-pulse excitation, adiabatic inversion pulse with TI=30ms, 3 averages, total scan time 12-15.5 minutes). One GBM patient was scanned before and after Gad injection (1 mmol/kg) in addition with 4 inversion times (TI=0,20,30,40ms) for T1 estimation using a shorter lower resolution protocol to make the total scan duration clinically feasible (TE=0.5ms, TR=100ms, resolution=4.5mm isotropic, 30 cm FOV, 500µs hard-pulse excitation, adiabatic inversion pulse, 3 averages, total scan time per TI = 1.5 minutes). This patient study is ongoing. 23Na-T1 maps were fitted in Matlab 2016a (the MathWorks, Natick, MA).6 Regions-of-interest (ROIs) were drawn in Osirix 8 (Pixmeo SARL, Switzerland) by a neuroradiologist on contrast-enhanced 1H T1-weighted images (3D, magnetization prepared FSPGR, TE=3.18ms, TR=8.16 ms, resolution=1.5mm isotropic, reconstructed to 1mm, 25cm FOV, 5.5 minutes). 23Na-MRI was co-registered to the contrast-enhanced 1H-T1-weighted volume using SPM12 (UCL, London, UK). Statistical significance was assessed using the paired sample t-test at the 5% significance level.Results
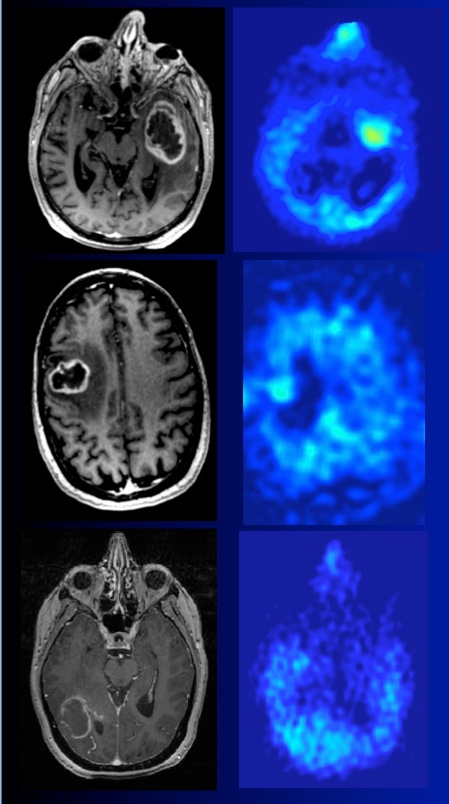
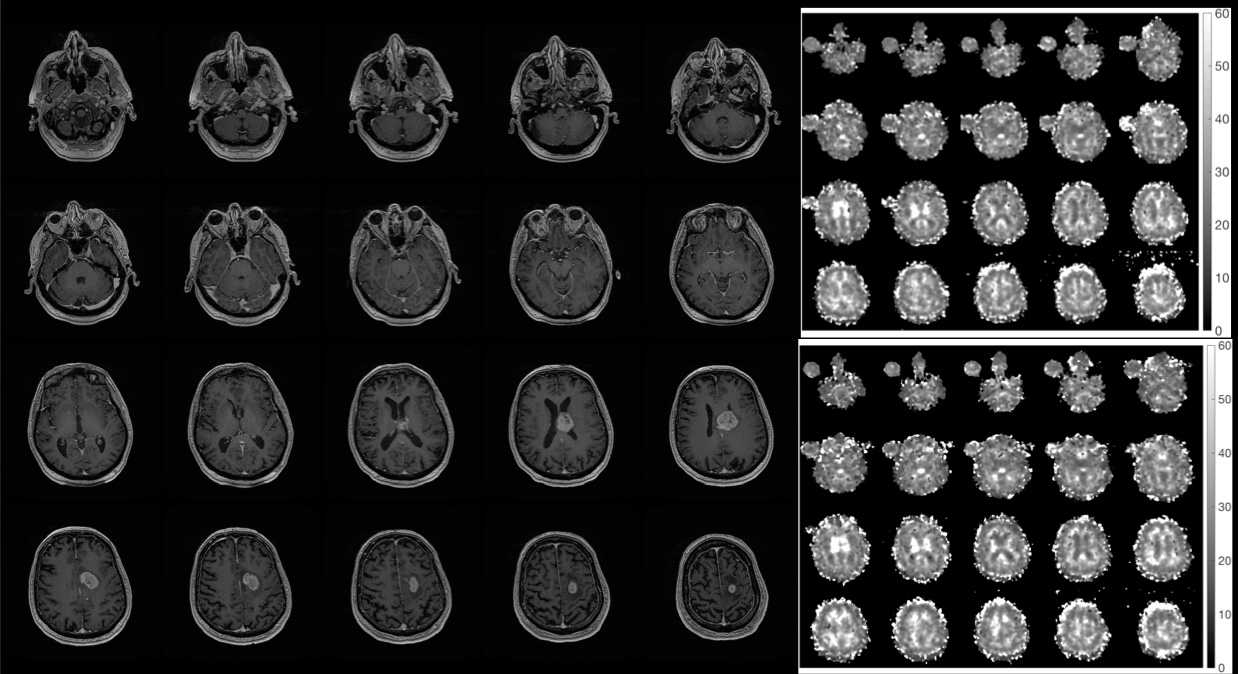
Figure 1 shows incomplete fluid suppression in the patients in IR-23Na-MR images after Gad injection. Residual sodium signal is detected in the necrotic/cystic region. Images show successful suppression of cerebrospinal fluid. Figure 2 shows post-contrast 1H-T1-weighted imaging of the patient who had 23Na T1 maps acquired before and after gadolinium injection. White matter (40 ± 5.5 vs. 45 ± 7 ms), enhancing tumor (30 ± 2 vs. 29 ± 1 ms) and gray matter (30 ± 3 vs. 32 ± 4.5 ms) 23Na-T1 values were similar before and after contrast injection and showed no statistically significant change. Within the edema however, 23Na-T1 was significantly reduced from 31.5 ± 1.5 to 27 ± 1 ms after contrast injection (p = 0.0095).Discussion
We expected to see the largest effect of 23Na-T1 shortening in the enhancing part of the lesion and the necrotic/cystic core, as in the latter, gadolinium would slowly diffuse and essentially be trapped. As this GBM atypically lacked a necrotic/cystic core, we were unable to test this hypothesis and no 23Na-T1 changes were observed in the enhancing tumor. 23Na-T1 shortening was observed in peritumoral edema only, which normally would not enhance on 1H-MRI. This effect is interesting and could be due to the atypical patient or a different effect of gadolinium in 23Na-T1 compared to 1H-T1. We are currently investigating in a wider pool of patients. 23Na-T1 changes were also observed in the white matter ROI, albeit were not statistically significant. The white matter ROI was placed in the centrum semiovale and could have been influenced by partial volume from ventricular cerebrospinal fluid.Conclusion
It was shown that a Gadolinium-based contrast agent alters 23Na-T1 relaxivity in peritumoral edema. Further subjects will be studied to investigate the effect on large necrotic/cystic regions as well as the relationship between time of injection and imaging. Investigation of other gadolinium formulations at different concentrations and charge distribution may demonstrate other effects. More pronounced effects may be observed at higher field strengths.Acknowledgements
This study was supported by the CRUK-EPSRC Cancer Imaging Centre in Cambridge and Manchester, the NIHR Cambridge Biomedical Research Centre and the Cambridge Experimental Cancer Medicine Centre (ECMC).References
1. Aguor EN, van de Kolk CW, Arslan F, et al. 23Na chemical shift imaging and Gd enhancement of myocardial edema. Int. J. Cardiovasc. Imaging 2013; 29(2):343–354.
2. Griffey RH, Griffey BV, Matwiyoff NA. Triple-quantum-coherence filtered imaging of sodium-ions in vivo at 4.7 Tesla. MRM 1990;13(2):305–313.
3. Stobbe R, Beaulieu C. In vivo sodium magnetic resonance imaging of the human brain using soft inversion recovery fluid attenuation. MRM 2005;54(5):1305-1310.
4. Biller A, Badde S, Nagel A, et al. Improved Brain Tumor Classification by Sodium MR Imaging: Prediction of IDH Mutation Status and Tumor Progression. AJNR Am J Neuroradiol. 2016;37(1):66-73.
5. Gurney PT, Hargreaves BA, Nishimura DG. Design and analysis of a practical 3D cones trajectory. MRM 2006;55(3):575-582.
6. Barral JK, Gudmundson E, Stikov N, et al. A Robust Methodology for In Vivo T1 Mapping. MRM 2010;64(4):1057-1067.
Figures