2207
Quantitative analysis of MR diffusion-weighted imaging for differential diagnosis of cerebral alveolar echinococcosis and brain metastasesJian Wang1, Ling Wu1, Juan Ma1, Chunhui Jiang1, Sailike Duishanbai2, Geng Dangmurenjiapu2, and Chen Liu2
1MRI Room,First Affiliated Hospital,Xinjiang Medical University, Urumqi 830011, China, Urumchi, People's Republic of China, 2Department of Neurosurgery,First Affiliated Hospital,Xinjiang Medical University, Urumqi 830011, China
Synopsis
Synopsis:This study aims to probe the role of the quantitative analysis of MR diffusion-weighted imaging in differentiating Cerebral Alveolar Echinococcosis (CAE) with Brain metastases (BM).There was significant difference of the mean ADC values and eADC values (P<0.05) of the solid region between CAE and BM. There was no significant difference of the mean ADC values (P>0.05) between CAE and BM,but there was significant difference that of the eADC values (P<0.05). MR-DWI was valuable for making diagnosis and differential diagnosis of patients with CAE and BM. EADC values is better than the ADC values.
1 Characters
Target audience Researchers and clinicians interested in brain imaging and diseases, with a particular interest in Cerebral Alveolar Echinococcosis (CAE) and Brain metastases (BM) . Introduction Alveolar Echinococcosis is regarded as one of the most deadly worm infections[1-2]. Cerebral Alveolar Echinococcosis is a disease that grows infiltratively like a malignant tumor, it is harmful to human body. CAE is similar to the brain metastases and tuberculoma on conventional MRI. As the imaging features of CAE are not typical and immunization examination of hydatid disease has false positive results, this kind of disease has a high rate of misdiagnosis before surgery. Diffusion-weighted imaging (DWI) is a widely applied advanced MRI technique which can noninvasively detect the motion of water molecule diffusion within living tissue. The ADC has been proven to be a biomarker of tumor cellularity in humans and is therefore an indicator of apoptosis and necrosis following effective cytotoxic therapy[3]. In this study, the ADC and exponential ADC (eADC) were introduced together as the quantitative indices of DWI. Compared with ADC, eADC reflects altered water diffusion with out T2 shine-through effects[4-5]. This study aims to probe the role of the quantitative analysis of DWI in differentiating CAE with Brain metastases. Methods This prospective study was approved by the institutional review board, and informed consents were obtained from all subjects. 32 patients underwent Conventional MR (T1flair,T2WI,T2flair), Contrast Enhanced -T1flair and DWI(b=1000 sec/mm2) with a 3.0T dual gradient superconducting MR scanner (GE, Signa HDx, GE Medical Systems, Milwaukee, WI) and 8 channel phased- array head coil. Scanned images were then transferred to a workstation (GE ADW4.4). 32 patients are composed of 16 CAE(mean age,27 years;range,19-46) and 16 BM(mean age,57 years;range,29-74). A spin echo- echo planar(SE-EPI)diffusion sequence was used. DWI sequence parameters were as follows: The slice thickness is 5.0cm, the number of slices is 26, FOV is 24cm, NEX is 2, the matrix is 128*128, TR is 6000ms, TE is 60ms. ADC and eADC maps were calculated with the build-in software using below mono-exponential model: eADC = exp(-ADC * b). ROI include the solid region, the peripheral edema and the relative contralateral part of the normal brain parenchyma area (control group) were manually drawn by an experienced radiologist(As shown in Figure 1). A NOVA test was used to compare in the solid region, the edema region and control group regarding ADC and eADC values of CAE and BM,respectively. SPSS17.0 software (SPSS Inc, Chicago, IL, USA) was used for all statistical analyses. Results The mean ADC values in solid region of CAE is higher than that of BM. There was significant difference of the mean ADC values and eADC values (P<0.05) of the solid region between CAE and BM. The mean ADC values in edema region of CAE is higher than that of BM. There was no significant difference of the mean ADC values (P>0.05) between CAE and BM,but there was significant difference of the mean eADC values (P<0.05) of the edema region between CAE and BM. There was no significant difference of the mean ADC values and eADC values (P>0.05) of the control group between CAE and BM(As shown in Table 1 and Table 2). Discussion The results showed that the mean ADC values in solid region of CAE is higher than that of BM. There was no significant difference of the mean ADC values of the edema region between CAE and BM,but there was significant difference that of the mean eADC values. BM is essentially a malignant tumor; the high density, high nuclear: cytoplasm ratio, obvious atypia, and enhanced membrane transport function of tumor cells can result in smaller extracellular space, limited water molecule diffusion, and lower mean ADC values. CAE is essentially an infectious granuloma despite its biological propensity of malignancy. Numerous dense vesicles and vesicular clusters constitute the main body of solid lesions during the proliferative stage of CAE. Lesions of the proliferative stage are rapidly growing and subject to inflammatory encapsulation by peripheral tissue. Cell density inside of the lesions is therefore increased, so that water molecule diffusion is moderate limited. Conclusions This study showed that MR-DWI could reflect pathological characteristics of CAE and BM in molecular level,and MR-DWI was valuable for making diagnosis and differential diagnosis of patients with CAE and BM. EADC values is more sensitive than ADC values.Acknowledgements
No acknowledgement found.References
Reference 1. Brunetti E, et al. Acta Trop 2010; 114: 1-16.2. Aydinli B, et al. Turkiye Parazitol Derg 2008; 32: 371-374. 3. Jakubovic R, et al. Clinical & Experimental Metastasis. 2016, 8(1):33-39. 4. Zhang Y L, et al. Applied Magnetic Resonance, 2013, 44(3):349-363. 5. Zhang Y L, et al. Applied Magnetic Resonance, 2013, 44(3):349-363.Figures
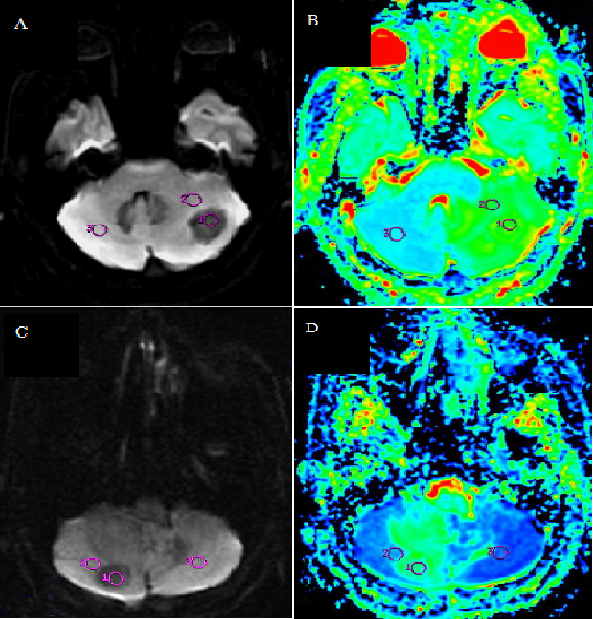
Figure
1. (A) DWI of Cerebral Alveolar
Echinococcosis(CAE). (B) ADC map of
CAE. (C) DWI of Brain metastases(BM). (D) ADC map of BM.
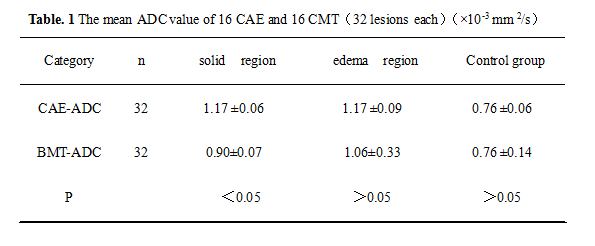
Note: The mean ADC value and eADC values were measured in the form of the
average±the standard deviation. CAE denotes Cerebral Alveolar
Echinococcosis . BM denotes Brain metastases. Control group is the
relative contralateral part of the normal brain parenchyma area.
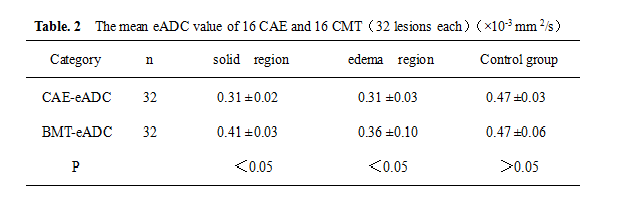
Note: The mean ADC value and eADC values were measured in the form of the
average±the standard deviation. CAE denotes Cerebral Alveolar
Echinococcosis . BM denotes Brain metastases. Control group is the relative contralateral part of the normal
brain parenchyma area.