2206
Whole tumor volume based histogram analysis of ADC for differentitating between WHO grade II and III glioma1First Affiliated Hospital of Dalian Medical University, Dalian, People's Republic of China, 2GE Healthcare,China,Beijing, 3GE Healthcare,Lifescience,China
Synopsis
In this study, the differential diagnostic value of histogram analysis of ADC signal value based on entire region of grade II and III tumor is investigated, and further aimed at revealing the microscopic changes of glioma in the evolution of low grade to high grade.Conclusion that,histogram analysis of ADC signal value based on entire tumor could provide more information in differentiation of grade II and III glioma. Several parameter showed superior diagnostic value.
Introduction
The therapeutic approaches and prognosis for gliomas differ considerably for different tumor grades, it is hence important to accurately assess glioma grade for treatment planning. In addition to the use of conventional mean value, several studies have reported the use of histogram analysis of ADC in glioma grading[1,2]. However only the differentiation between low grade and high grade was concerned, whereas differentiation between grade II and III remains challenging. A limitation in previous studies could be the use of multiple ROIs in a section of the tumor lesion, which may underestimate the heterogeneity of glioma cellularity. In this study, the differential diagnostic value of histogram analysis of ADC signal value based on entire region of grade II and III tumor is investigated, and further aimed at revealing the microscopic changes of glioma in the evolution of low grade to high grade.Method
Fourteen patients with grade II glioma and 22 patients with grade III glioma were enrolled in this retrospective study, tumor grades were pathologically confirmed. All the participants underwent DWI on GE Signa HDxt 3.0T MR whole body scanner. ROIs that contained the entire tumor and peripheral edema were drawn in each slice of the ADC maps. Then histograms voxel wise measurements of the entire tumor volume were obtained. Histogram related parameters including min intensity, max intensity, mean value, median intensity, the 10th,25th,50th,75th and 90th percentiles, range, voxel number, std deviation,variance,relative deviation,mean deviation, skewness,kurtosis and uniformity were recorded. The obtained parameters were compared between groups through the SPSS 18.0. Receiver operating characteristic curve (ROC) was used to assess the ability of parameters between grade II and III glioma. All statistical results were P<0.05 as statistically significant.Results
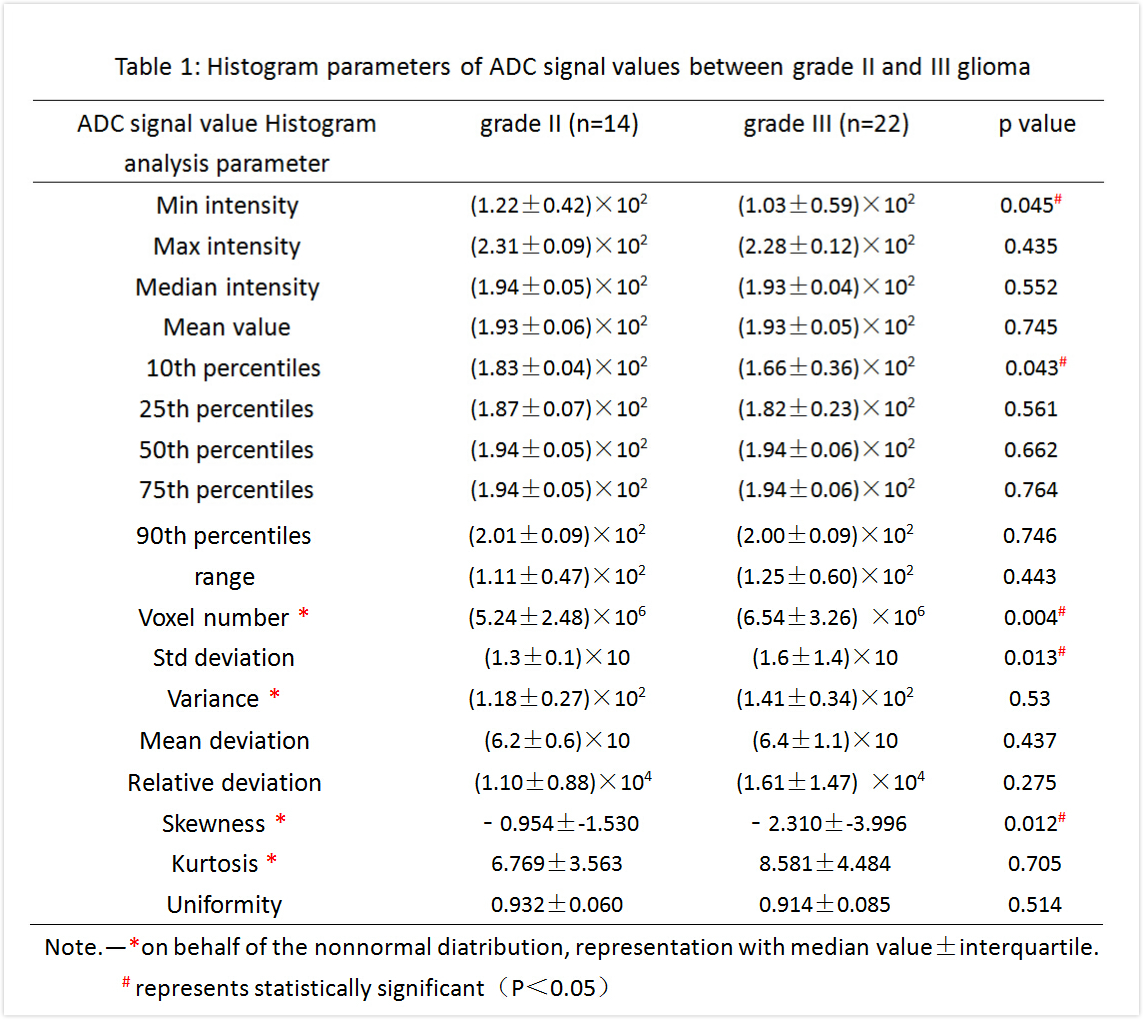
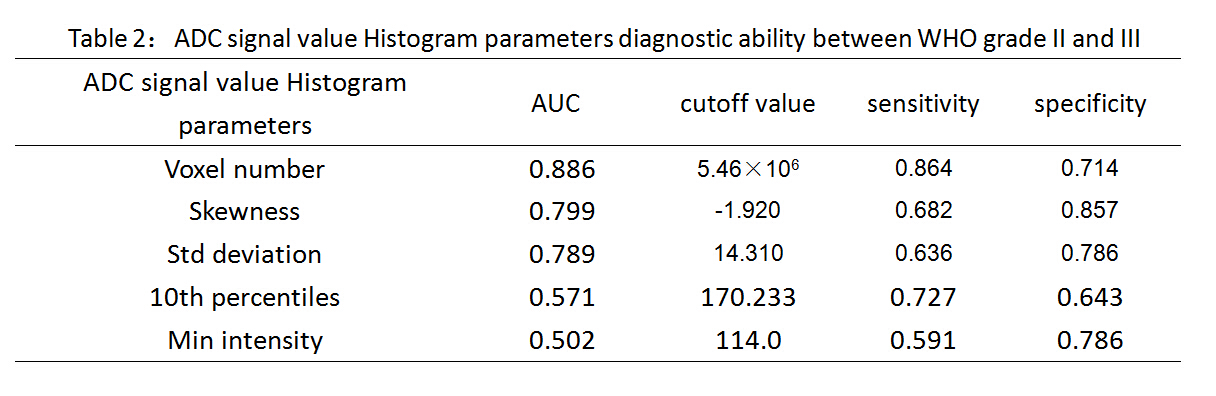
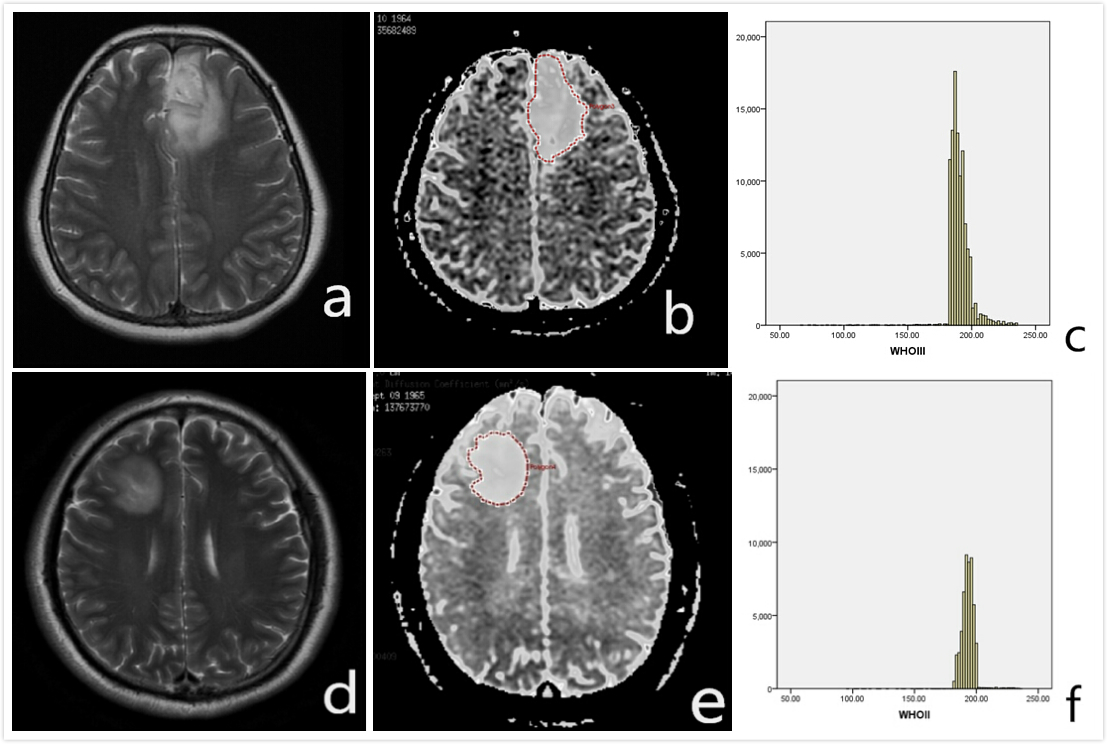
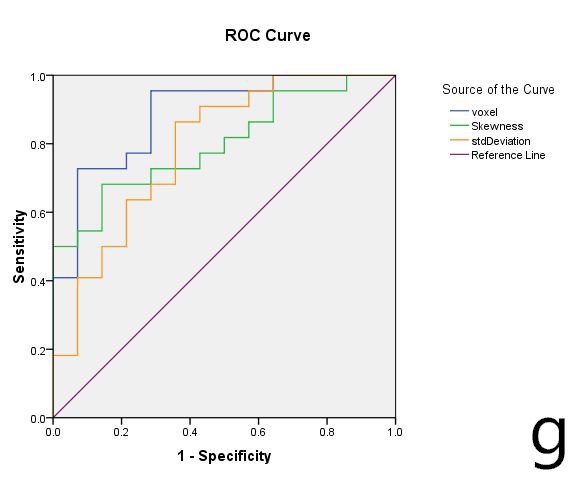
The ADC map and histogram of typical cases grade II and III glioma are shown in Fig.a-b,d-e. The histogram parameters of grade II and III and comparison results are summarized in Table 1.It can be seen that min intensity,max intensity,mean value,median intensity,the 10th,25th,50th,75th and 90th percentiles,skewness,kurtosis and uniformity are decreased in grade III than grade II,and on the contrary range, voxel number,std deviation,variance,relative deviation,mean deviation are increased. Among all, min intensity(p=0.045), 10th percentiles(p=0.043), voxel number(p=0.0041), std deviation(p=0.013), skewness(p=0.021)showed significant difference between two groups.The ROC showed that min intensity, 10th percentiles, voxel number, std deviation, skewness feature significant difference between grade II and III (Fig.g), The AUC,cutoff value,sensitivity and specificity of the parameters are summarized in Table 2.Discussion and conclusion
In this study, the ROIs encompassed the tumor parenchyma and peripheral edema, without avoiding cystic,necrosis and hemorrhage area, which are characteristics of grade III glioma, as compared to grade II. In addition, the boundaries of the tumor lesions may not be clear since the surrounding areas may be vascularized. Both facts support that the ROI based analysis should include the entire tumor volume rather than subsections. In this study, min intensity and 10th percentiles showed significant difference between grade II and III, suggesting that ADC value in low zone is more meaningful. In other words, the lower range of ADC better reflects the progress of higher cellularity. The difference of voxel number between grade II and III reflects the faster growth rate and more invasion range of grade III. Standard deviation shows the level of data dispersion, higher standard deviation of ADC indicates larger regions of cystic,necrosis or haemorrhage.Skewness describes the symmetry of the curve distribution.Compared with grade II, the ADC value of grade III concentrate on low zone,the center of the histogram curve was shifted to left.Overall, it is seen that histogram analysis of ADC signal value based on entire tumor could provide more information in differentiation of grade II and III glioma. Several parameter showed superior diagnostic value.Acknowledgements
No acknowledgement found.References
[1]Yusuhn Kang,Seung Hong Choi,Young-Jae Kim,et al.Gliomas:Histogram Analysis of Apparent Diffusion Coef?cient Maps with Standard- or High-b-Value Diffusion-weighted MR Imaging Correlation with Tumor Grade[J].Radiology,2011,261(3):883-884.[2]Lelande S.Hu,Shu luo Ning,Jennifer VM,et al.Muliti-Parametric MRIand Texture Analysis to Visualize Spatial Histologic Heterogeneity and Tumor Extent in Glioblastoma[J].PLOS ONE,2015,DOI:10.1371:2-9.
Figures