2205
Reproducibility of 3D short TE MRSI in patients with high-grade glioma1Department of Radiology and Biomedical Imaging, University of California San Francisco, San Francisco, CA, United States
Synopsis
The study evaluated the reproducibility of metabolite profiles within the normal appearing white matter that were acquired using automatic prescription of short echo time magnetic resonance spectroscopic imaging for ten patients with high grade glioma.
PURPOSE
The purpose of this study was to evaluate the reproducibility of brain metabolites obtained from 3D short echo time (TE) magnetic resonance spectroscopic imaging (MRSI) at 3T within a clinically feasible acquisition time. The 3D MRSI dataset were acquired using automatic prescription of both the volume of interest and outer volume suppression bands to facilitate the acquisition process [1-3]. The test-retest agreement of the MRSI parameters was evaluated in patients with high-grade glioma. This is especially important for providing reliable results for use in clinical management.METHODS
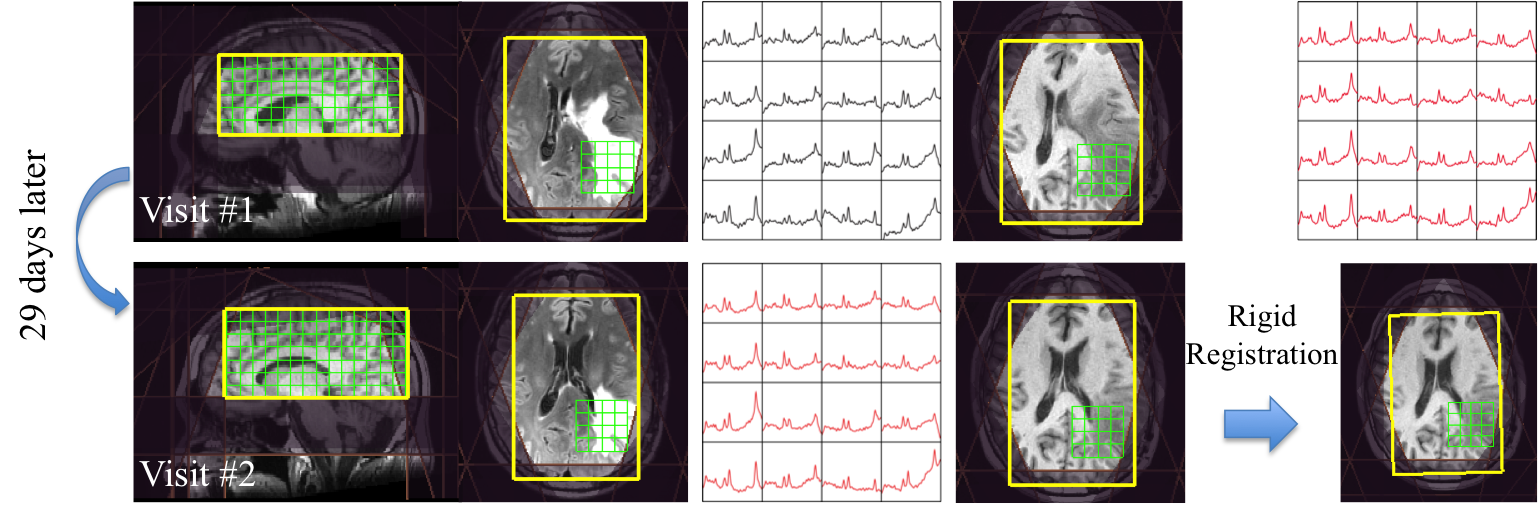
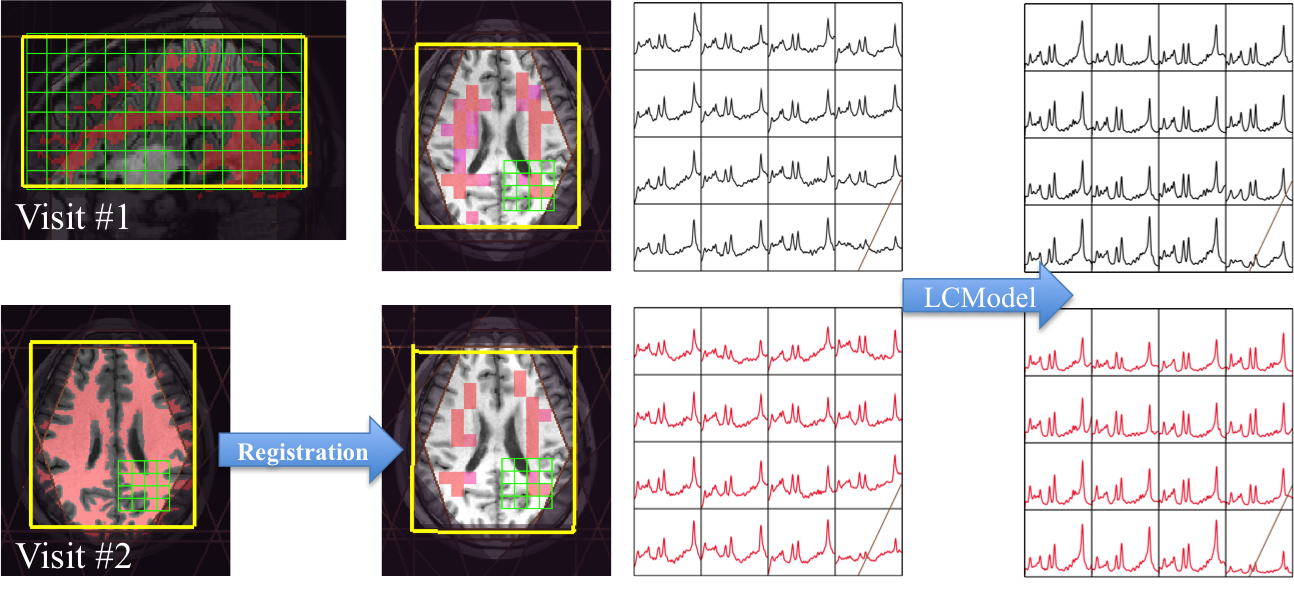
Ten patients (4F/6M; age = 52±15 y/o) were studied using a 3T MR scanner. Two patients were newly diagnosed as grade 3 astrocytoma and 8 patients had newly diagnosed glioblastoma. All patients had a second imaging session within a median (range) of 60 (29-80) days. During the MR studies, three patients received concurrent radiochemotherapy, and the others had tomozolomide only. Both MR examinations included pre- and post-contrast T1-weighted spoiled gradient echo, T2-weighted fluid attenuated inversion recovery, and 3D short TE MRSI data. The MRSI data were obtained using CHESS water suppression, VSS outer volume suppression and PRESS volume selection with an overPRESS factor of 1.5, TE/TR=35/1300ms, spectral array=18x22x16 and spatial resolution=1cm3. The PRESS volume and VSS suppression bands were automatically placed either by a method that calculates the masks of brain and lipid in real time [1] or predefining templates in the MNI152 standard space [3]. Flyback trajectories were applied in the S/I dimension to speed up the total acquisition time. The total acquisition time was about 8.5 minutes for 3D short TE MRSI. The 3D spectral data were combined and processed as described previously [4,5], and then quantified by LCModel [6] using a simulated basis-set. Metabolite levels were expressed relative to the creatine (Cr) peak. For MR data acquired at the 2nd visit, T1-weighted pre-contrast images were affinely registered to the images from the first visit for each subject and the corresponding transformation matrix was applied to the center of the excitation volume. The T2 hyperintense lesion (T2L) and normal-appearing white matter (NAWM) were segmented automatically and then down-sampled to the resolution of MRSI. The coefficients of variance (CVs) for reproducibility were calculated on a voxel-by-voxel basis for each metabolite between the two sessions.RESULTS
During the MR studies, no patients had confirmed tumor progression. The volume of the T2L for each MR session is shown in Table 1. Figure 1 and Figure 2 show examples of MRI and MRSI data from two patients. Although there were significant changes in the T2L for patient #1, the alignment for the images and spectroscopy worked well. The masks of NAWM are illustrated in the Figure 2. Considering that there were changes in the T2L for these patients, only the voxels overlapping by at least 75% for NAWM for both sessions were evaluated in the study. The CV for Cho/Cr, NAA/Cr, Glu/Cr and mI/Cr in the NAWM were 12.6±3.7%, 12.7±5.1%, 27.8±4.7%, and 19.2±4.7%, respectively, and the relative concentration ratios to Cr were 0.37±0.09, 1.56±0.34, 1.25±0.40, and 0.94±0.29, respectively.DISCUSSION
This study evaluated the reproducibility of metabolite profiles obtained using automatic prescription of short TE MRSI for patients with high grade glioma. The accuracy and reproducibility of the automatic placement of the excitation volume using the atlas-based templates has previously been evaluated in healthy volunteer and showed great consistence for intra- and inter-subject analysis [3]. Registration of the position of the PRESS localization volume between two scans worked well for patients with glioma. The spectra were quantified using LCModel and only voxels within the NAWM and satisfying CRLB criteria (CRLB<20) were included in the analysis. The average CVs for the major metabolites within the NAWM between sessions were similar to those observed in published data [7], but were relatively larger for Glu/Cr and mI/Cr, which could be due to treatment received for patients or variations in the different brain regions/tissues. Further studies will perform more detailed segmentation and analysis in a larger population.CONCLUSION
This study demonstrated the feasibility of using a fast acquisition process, reliable post-processing methods and established reproducibility, which are key factors for the application of MRSI in the clinical setting.Acknowledgements
This research was supported by NIH R01CA127612 and German Research Foundation research fellowship MA 7292/1-1.References
[1] Ozhinsky E, Vigneron DB, Chang SM and Nelson SJ. Automated prescription of oblique brain 3D magnetic resonance spectroscopic imaging. Magn Reson Med. 2013; 69:920-30.
[2] Ozhinsky E., Vigneron DB and Nelson SJ. Improved spatial coverage for brain 3D PRESS MRSI by automatic placement of outer-volume suppression saturation bands. J Magn Reson Imaging. 2011;33:792-802.
[3] Bian W, Li Y, Crane JC and Nelson SJ. Towards Robust Reproducibility Study for MRSI via Fully automated reproducible imaging positioning. ISMRM 2015.
[4] Nelson SJ. Analysis of volume MRI and MR spectroscopic imaging data for the evaluation of patients with brain tumors. Magn Reson Med 2001;46:228–239.
[5] Li Y, Osorio JA, Ozturk-Isik E, et al. Considerations in applying 3D PRESS H-1 brain MRSI with an eight-channel phased-array coil at 3 T. Magn Reson Imaging. 2006;24:1295 – 1302.
[6] Provencher SW. Estimation of metabolite concentrations from localized in vivo proton NMR spectra. Magn Reson Med 1993;30: 672–679.
[7] Veenith T, Mada M, Carter E, et al. Comparison of Inter Subject Variability and Reproducibility of Whole Brain Proton Spectroscopy. Plos One 2014; 9.
Figures