2204
Texture analysis of diffusion weighted imaging for the evaluation of tumor heterogeneity based on different regions of interestShan Wang1 and Jiangfen Wu2
1The affiliated hospital of xuzhou medical university, Xuzhou, People's Republic of China, 2GE healthcare china
Synopsis
Texture analysis of DWI based on different ROI can provide various significant parameters to evaluate tumor heterogeneity, which were correlated with tumor grade. Particularly, the inhomogeneity value derived from whole tumor ROI provided high diagnostic value in differentiating HGGs from LGGs and predicting the status of tumor proliferation.
Background and Purpose:
To explore the role of texture analysis with apparent diffusion coefficient (ADC) maps based on different regions of interest(ROI) in determining glioma grade.Materials and Methods:
Thirty patients with glioma (WHO grade II (n = 12), grade III (n = 9) and grade IV (n = 9)) underwent diffusion-weighted imaging (DWI) with corresponding ADC maps. ADC values were determined from the following three ROIs: whole tumor, solid portion and peritumoral edema. ROIs were drawn on every slice of the DWI to obtain volume-based 3D data. Texture analysis was performed on each ROI to obtain entropy, inhomogeneity, skewness and kurtosis parameters, as well as mean and median. These texture features were compared between high-grade gliomas (HGGs) and low-grade gliomas (LGGs) by using the non-parametric Wilcoxon rank-sum test or the unpaired student’s t-test. Receiver operating characteristic (ROC) curves were constructed to determine the optimum threshold for inhomogeneity values in discrimination of HGGs from LGGs using the whole tumor and solid portion values. The McNemar test was performed to compare the diagnostic accuracies of these two ROIs. With a spearman rank correlation model, the ADC inhomogeneity values described above were correlated with the Ki-67 labeling index.Results:
With whole tumor ROI, inhomogeneity values proved to be significantly different between HGGs and LGGs (0.315±0.093vs.0.184±0.036, P<0.001). With solid portion ROI, both inhomogeneity and median values showed significant difference between high and low grade gliomas (0.288±0.090vs.0.185±0.051, P=0.001, 1.186±0.214 vs. 1.368±0.252, P= 0.037, respectively). Howerever, with peritumoral edema ROI, entropy and edema volume demonstrated positive results in differentiating HGGs from LGGs (6.08±0.10 vs. 5.87±0.22 P=0.016, 28.74±21.20 vs. 6.36±3.19 P<0.001)f(igure 1). The whole tumor inhomogeneity parameter performed with better diagnostic accuracy(0.933vs.0.833, P=0.048) than selecting solid portion ROI in distinguishing HGGs from LGGs (figure 2). The relationship between inhomogeneity and Ki-67 labeling index was significantly positive both in whole tumor and solid portion ROI(R=0.628 P<0.001, R=0.470 P=0.009) (figure 3).Conclusion:
Texture analysis of DWI based on different ROI can provide various significant parameters to evaluate tumor heterogeneity, which were correlated with tumor grade. Particularly, the inhomogeneity value derived from whole tumor ROI provided high diagnostic value in differentiating HGGs from LGGs and predicting the status of tumor proliferation.Acknowledgements
First of all, I would like to extend my sincere gratitude to my supervisor, Xukai, for his instructive advice and useful suggestions on my thesis. I am also deeply indebted to Wu jiangfen teacher for her direct help to me.References
[1] Louis DN, Ohgaki H, Wiestler OD et al.The 2007 WHO classi?cation of tumours of the central nervous system, Acta Neuropahtol 2007;114(2):97-109. Review. 114(2):97–109. [2] Skogen K, Ganeshan B, Good C, Critchley G, Miles K. Measurements of heterogeneity in gliomas on computed tomography relationship to tumour grade. J Neurooncol 2013;111(2):213-9. doi: 10.1007/s11060-012-1010-5. [3] Weller M. Novel diagnostic and therapeutic approaches to malignant glioma. Swiss MedWkly 2011; 24;141:w13210. doi:10.4414/smw.2011.13210. [4] Server A, Kulle B, Gadmar OB et al. Measurements of diagnostic examination performance using quantitative apparent diffusion coef?cient and proton MR spectroscopic imaging in the preoperative evaluation of tumor grade in cerebral gliomas. Eur J Radiol 2011;80(2):462-70. doi: 10.1016/j.ejrad.2010.07.017 [5] T. L. Chenevert et al. Diffusion magnetic resonance imaging: An earlysurrogate marker of therapeutic efficacy in brain tumors. J. Natl. CancerInst 2000 ;20;92(24), 2029–2036.Figures
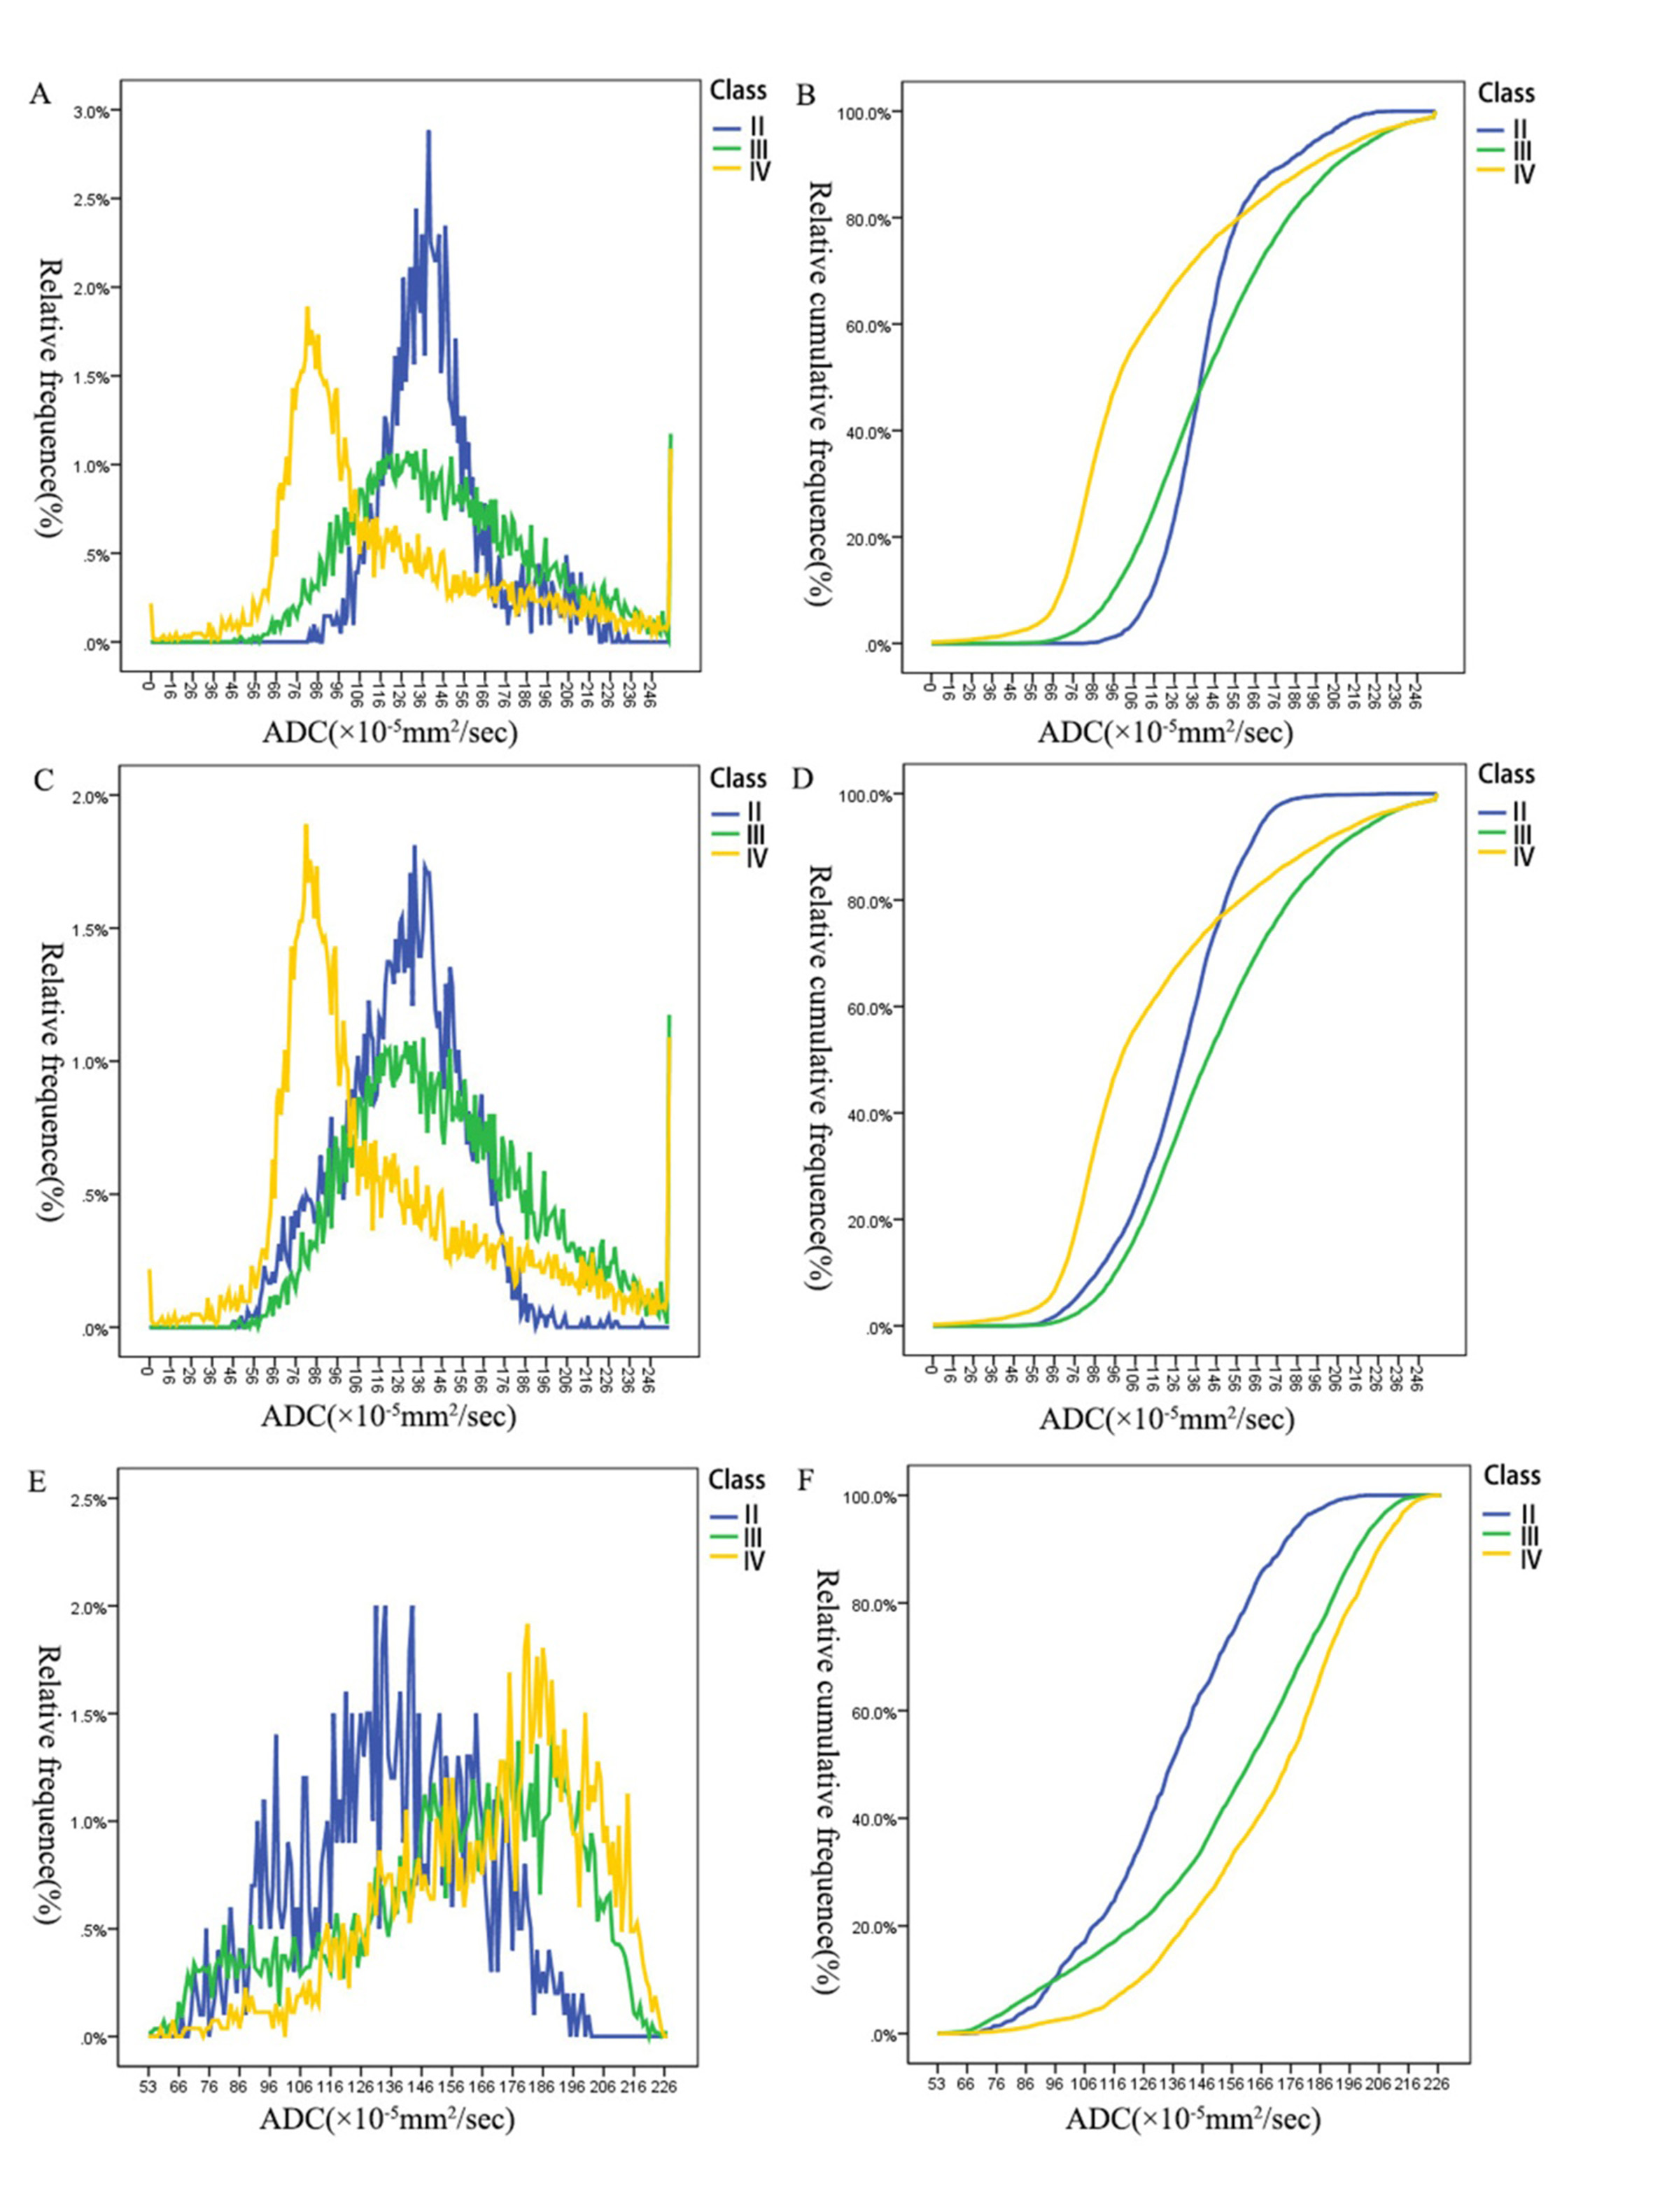
ADC histograms and
its corresponding cumulative histograms for grade II, III,
and IV gliomas obtained from (A,B)whole tumor ROI, (C,D)solid portion ROI, (E,F)
peritumoral edema ROI.
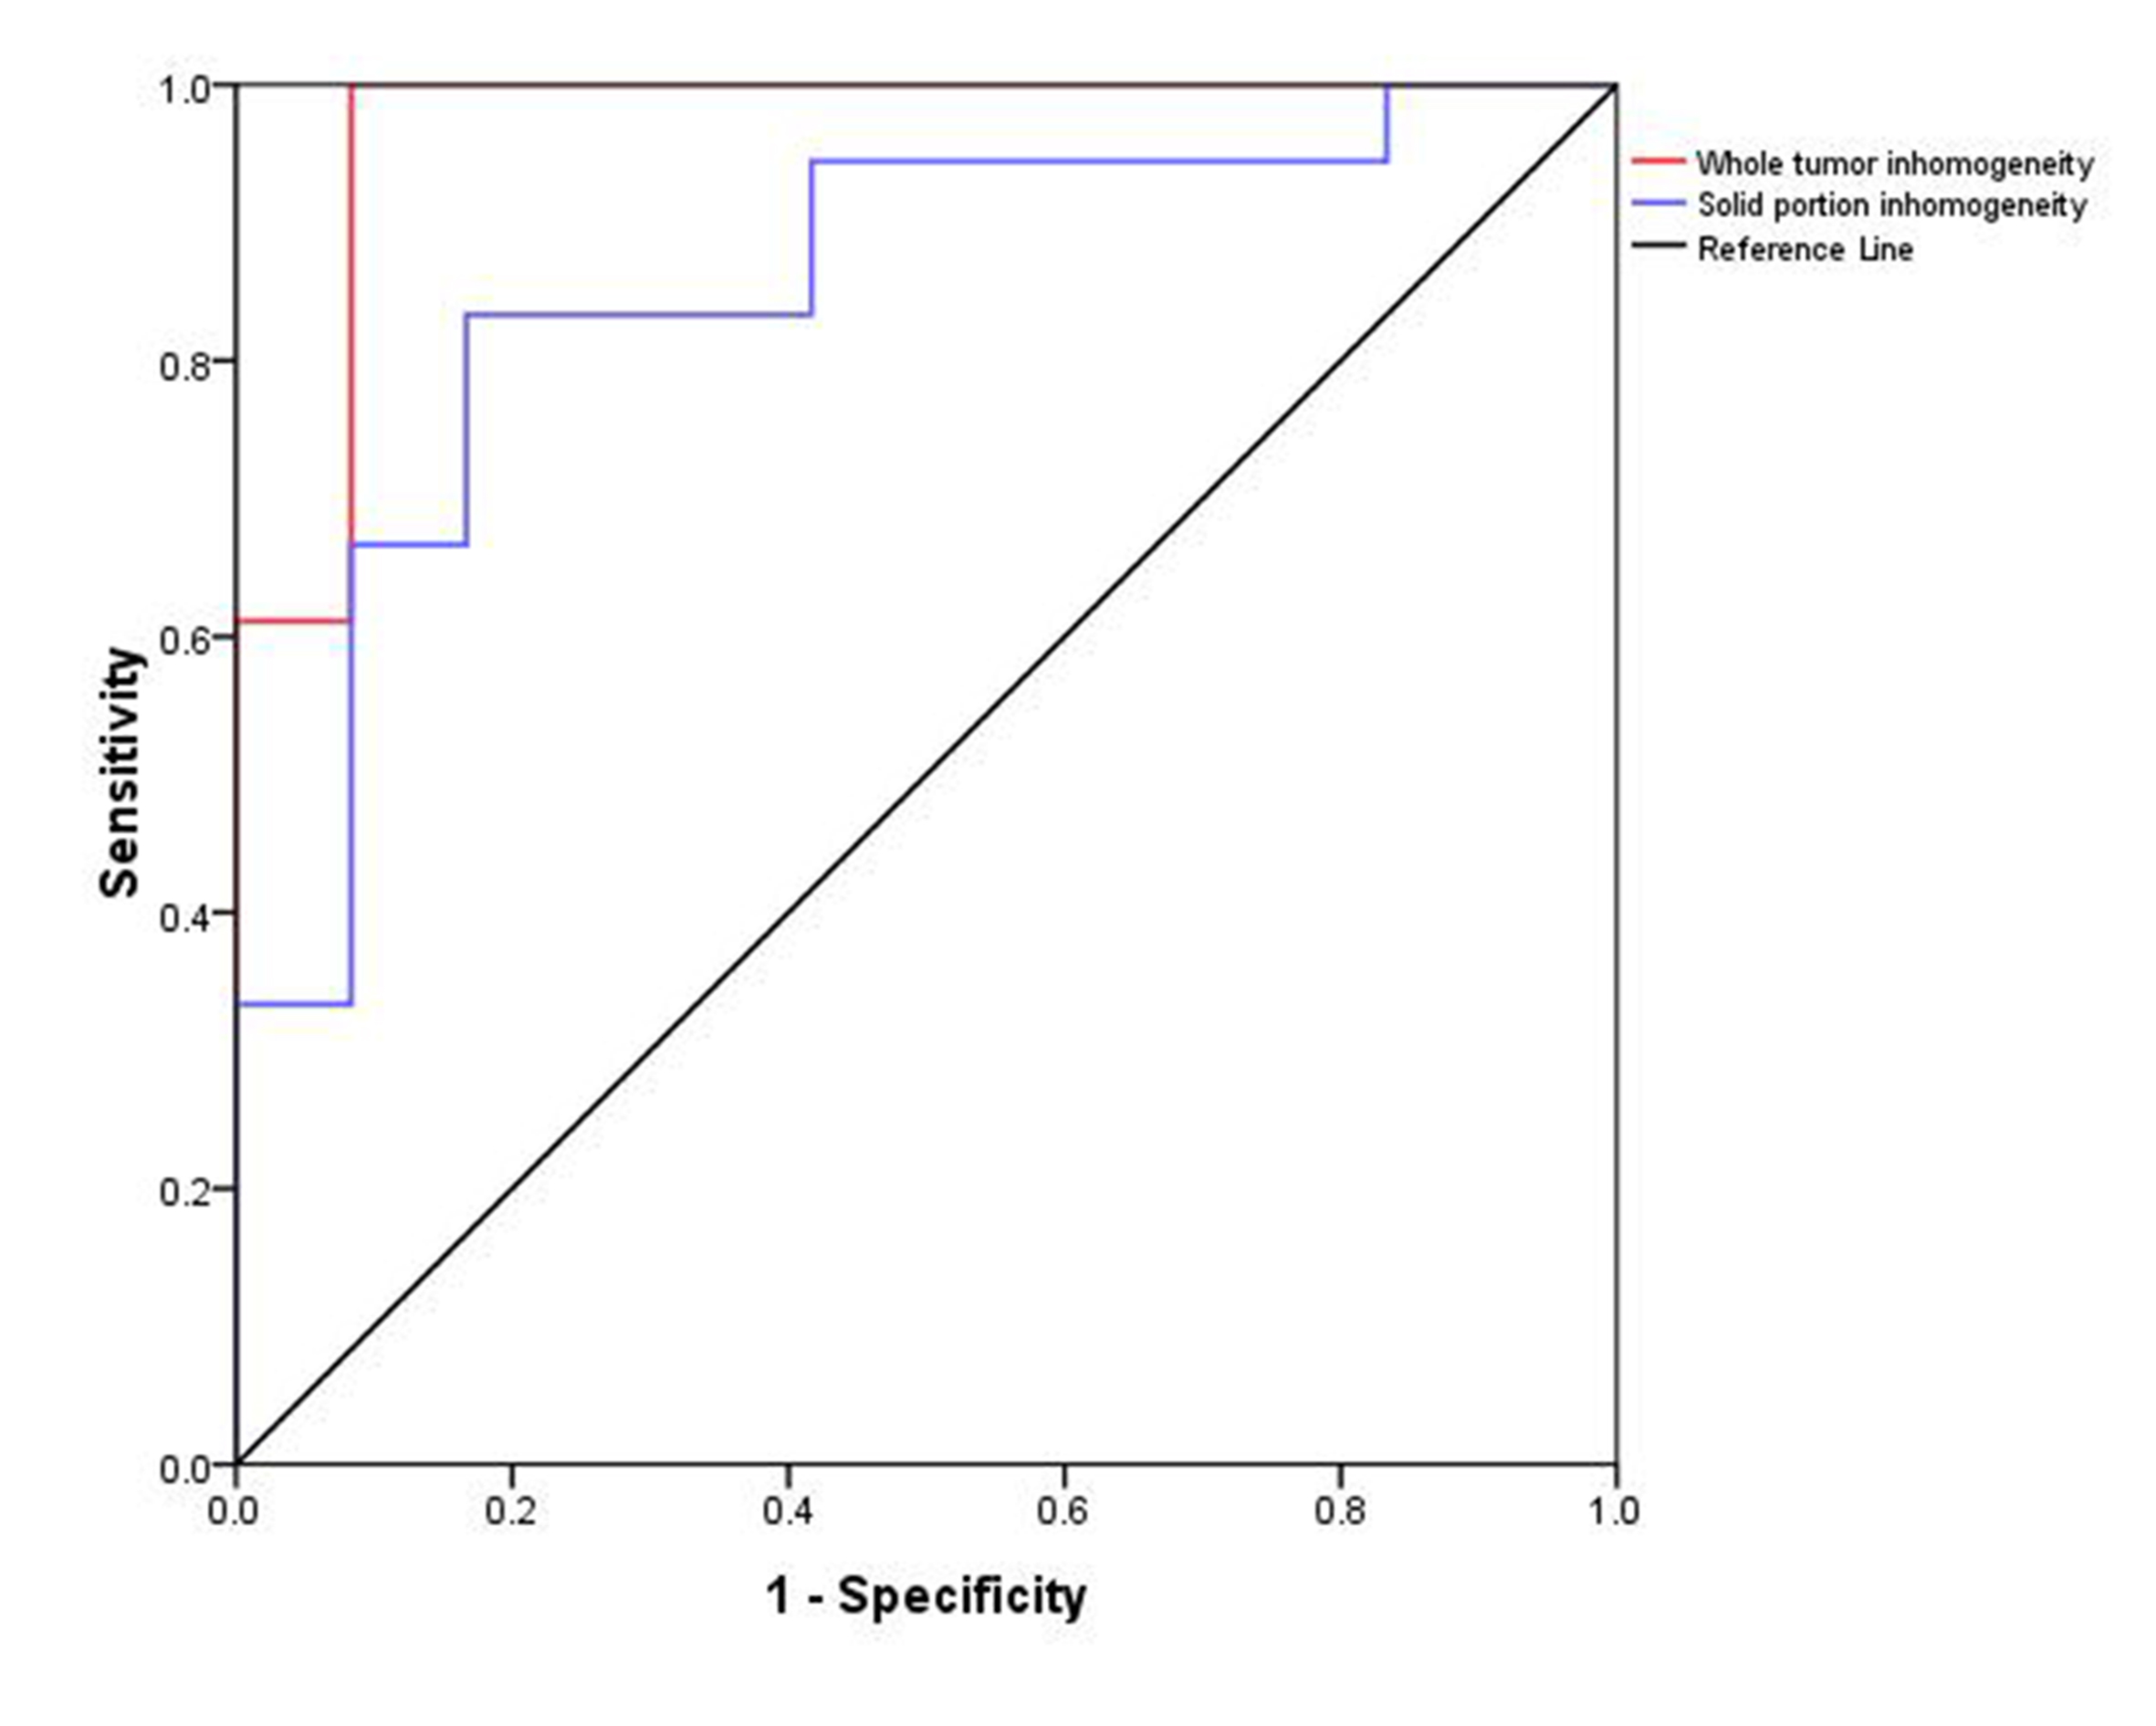
ROC
curves for inhomogeneity of glioma grading(high vs low).
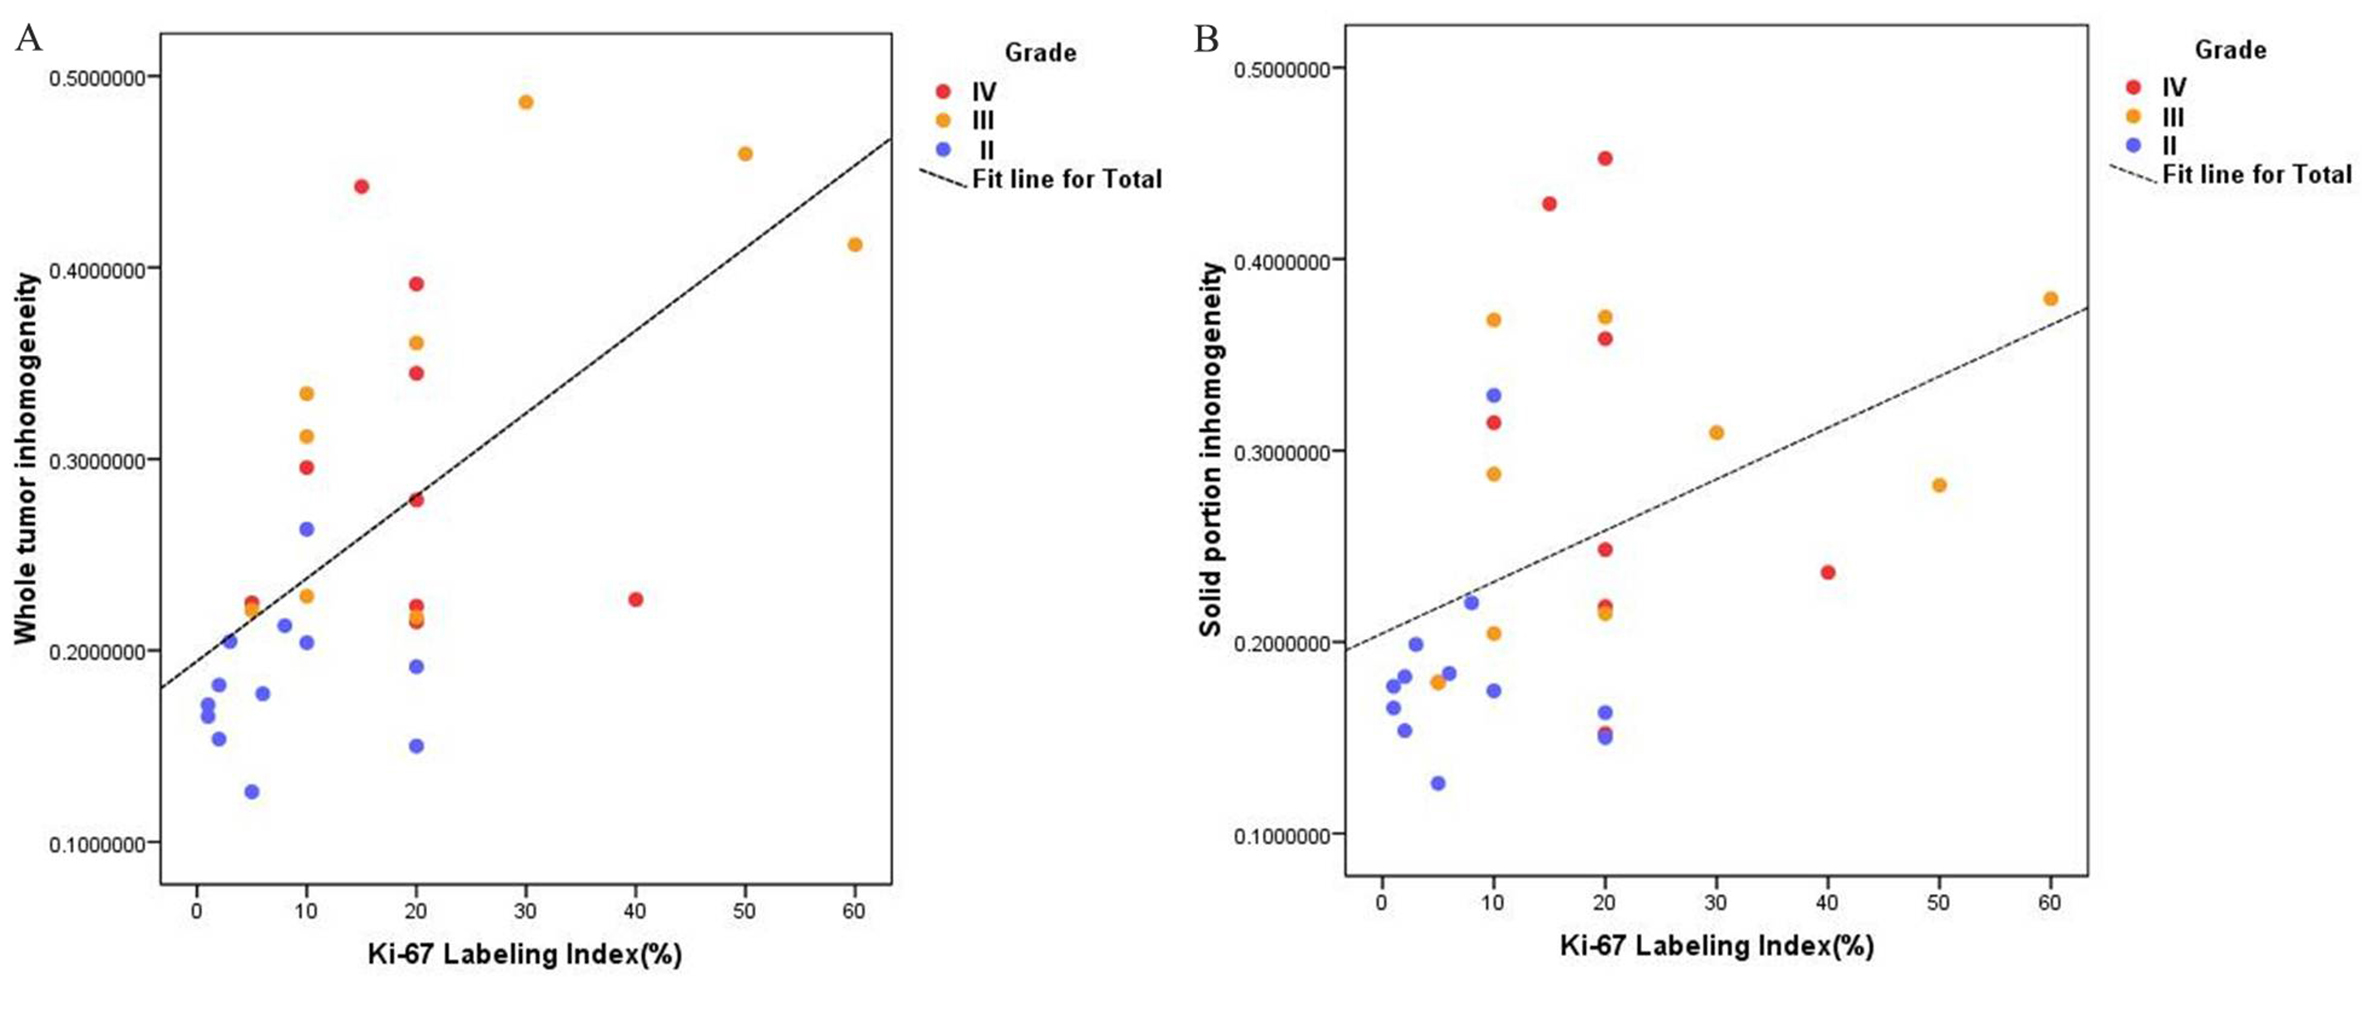
The relationship
between inhomogeneity value and Ki-67 labeling index labeling in whole-tumor
(A) and solid-portion ROI(B).