2203
In Vivo 3D Metabolic Correlation Mapping using 1H Echo Planar Spectroscopic Imaging in IDH-mutant Gliomas at 3T1Advanced Imaging Research Center, University of Texas Southwestern Medical Center, Dallas, TX, United States
Synopsis
We present a 3D high resolution 2HG and other metoblites imaging in gliomas with metoblic correlation mapping technique to differentiate areas with different metabolic activities.
PURPOSE
It is recent discovery that mutations in isocitrate dehydrogenase (IDH) 1 and 2 in gliomas associate with longer survival and better response to therapy than IDH wild-type tumors1,2. Elevated in IDH-mutated gliomas, 2-hydroxyglutarate (2HG) is well established as a biomarker for diagnosis and prognosis in brain tumors. Recently, single voxel 1H MRS has been proposed for in vivo detection of 2HG3,4,5. There is a high interest in high-spatial resolution spectroscopic imaging of 2HG and other important metabolites in brain tumors. 1H Echo Planar Spectroscopic Imaging (EPSI) is an effective tool for high-resolution imaging of brain metabolites at 3T and 4T6,7. On the other hand, as different metabolites indicates different metabolic information, a summarized metabolic profile generated from multiple metabolites would be highly informative for tumor segmentation especially in highly diffused gliomas. Here we report a high resolution 3D mapping of 2HG and other metabolites in gliomas with metabolic correlation mapping to differentiate areas with different metabolic activities.METHODS
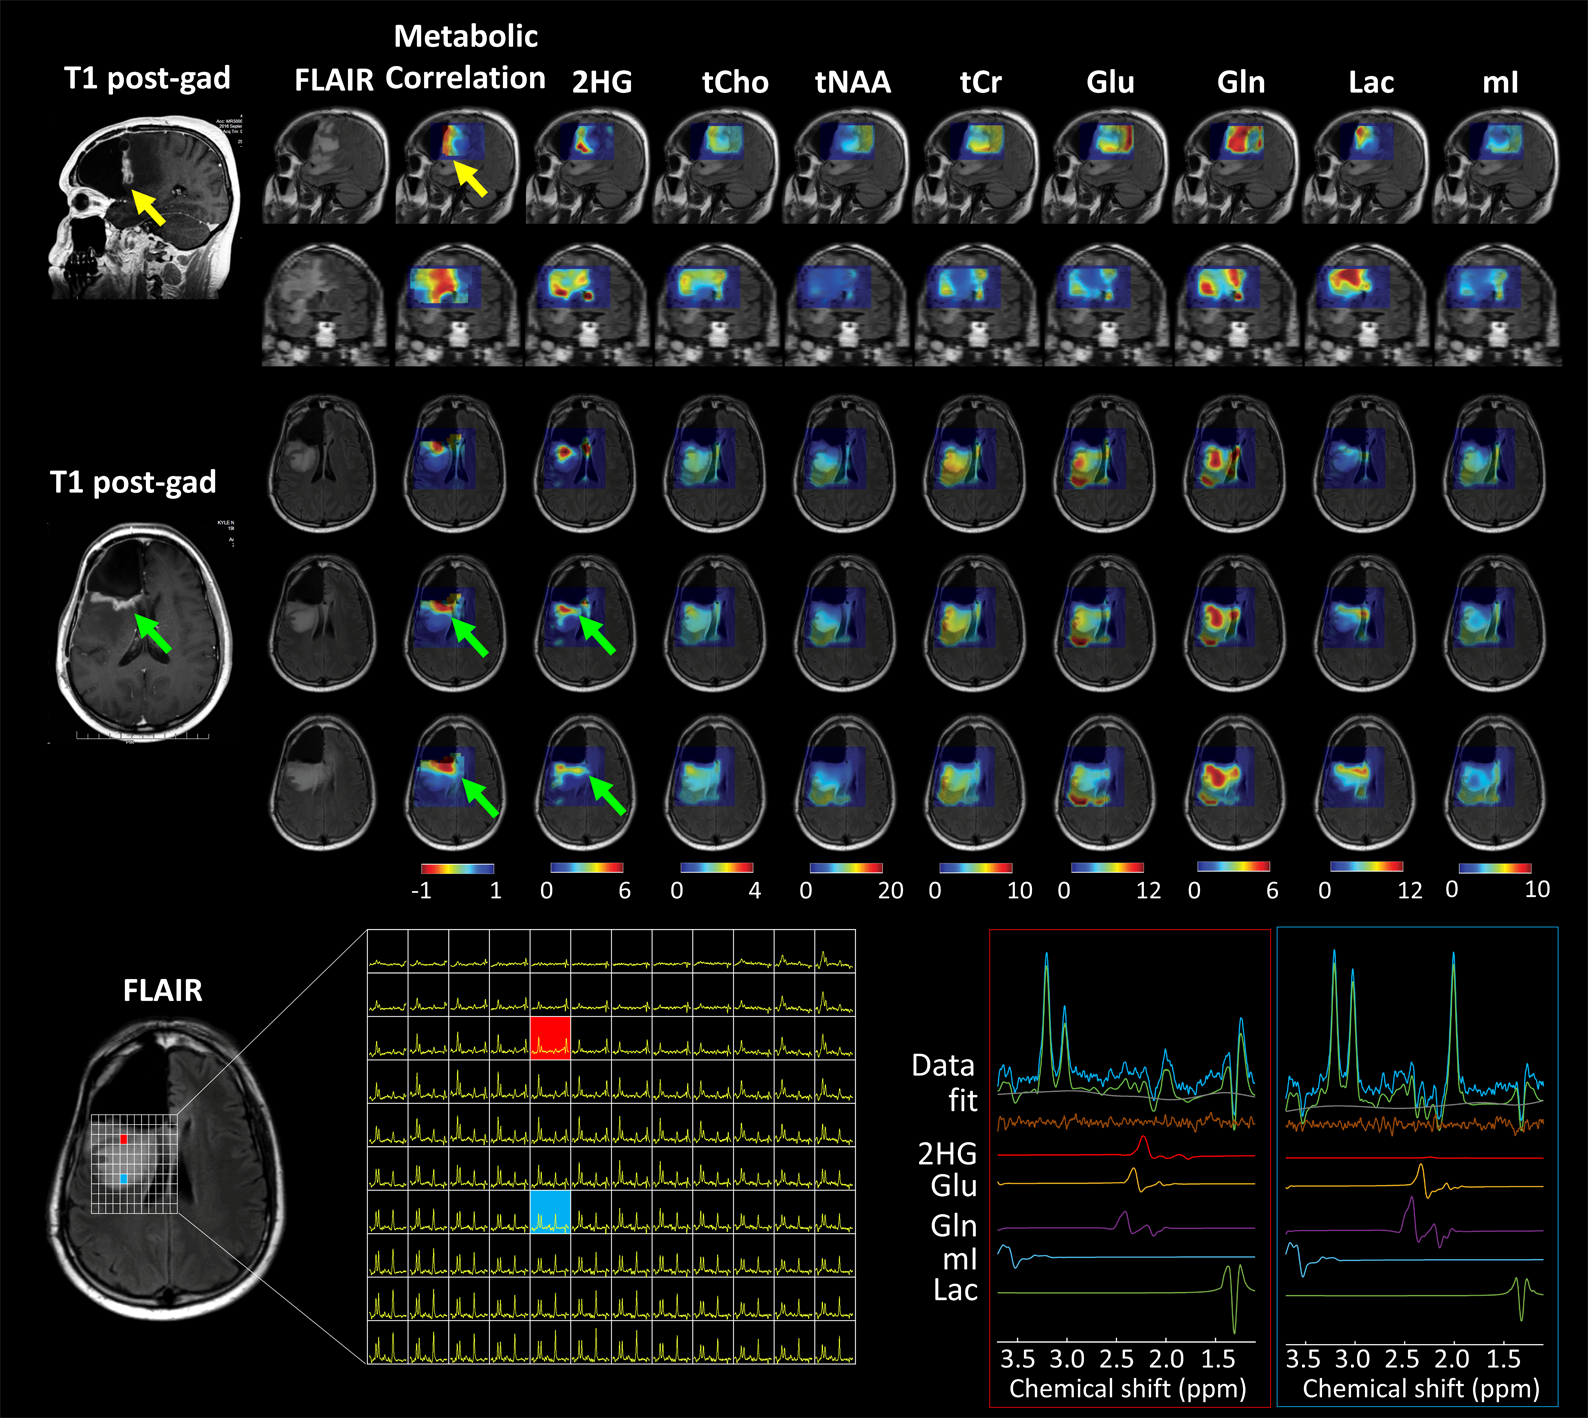
One IDH2 mutated secondary glioblastoma (GBM) patient and one IDH1 mutated Grade 2 oligodendroglioma patient were recruited for the study. The volume prescription for 3D EPSI acquisition was obtained with water-suppressed PRESS TE = 97 ms, which was optimized for 2-hydroxyglutarate (2HG), Glutamate (Glu) and Glutamine (Gln) detection. Water unsuppressed scan (15 min) includes the following parameters: (TE1,TE2) = (32,65) ms, TR = 1.6 s, NSA = 4, FOV = 240x180x80 mm3, excitation volume (VOI) = 90x90x65 mm3 or larger, voxel size = 10x10x10 mm3 (1ml), readout gradient strength = 5mT/m with 1024 lobes, spectral width = 8.2ppm. A previously reported gradient alternated read-out scheme was used to minimize readout gradient strength, acoustic noise and double the spectral width8. Data were acquired with a 32-channel head coil in a 3T whole-body scanner (Philips Medical Systems). Water unsuppressed 3D EPSI (1 min) was acquired with voxel size of 10x20x20 mm3 for eddy current compensation and multi-channel combination. The k-space data were zero-filled to 48*36*16, resulting in 0.125mL apparent voxel size. Data in the time domain were zero-filled to 2048 points and 2Hz exponential functions were applied to the time-domain data. Spectral fitting was performed, with LCModel software9, using in-house calculated basis spectra of 15 metabolites. Metabolite maps were quantified with reference to creatine in normal gray-matter region at 8mM. 8 metabolites, which are 2HG, total Choline (tCho), total N-acetylaspartate (tNAA), total Creatine (tCr), Glu, Gln, Lactate (Lac) and myo-inositol (mI), was selected for metabolic correlation mapping. Each metabolite map was normalized with its highest concentration, thus all eight metabolite maps were ranged from 0 to 1. Then a seed voxel from normally appearing T2w-FLAIR region was selected. A metabolic correlation map was generated using Pearson correlation between 8 normalized metabolite levels of each voxel and preselected seed voxel.RESULTS and DISCUSSION
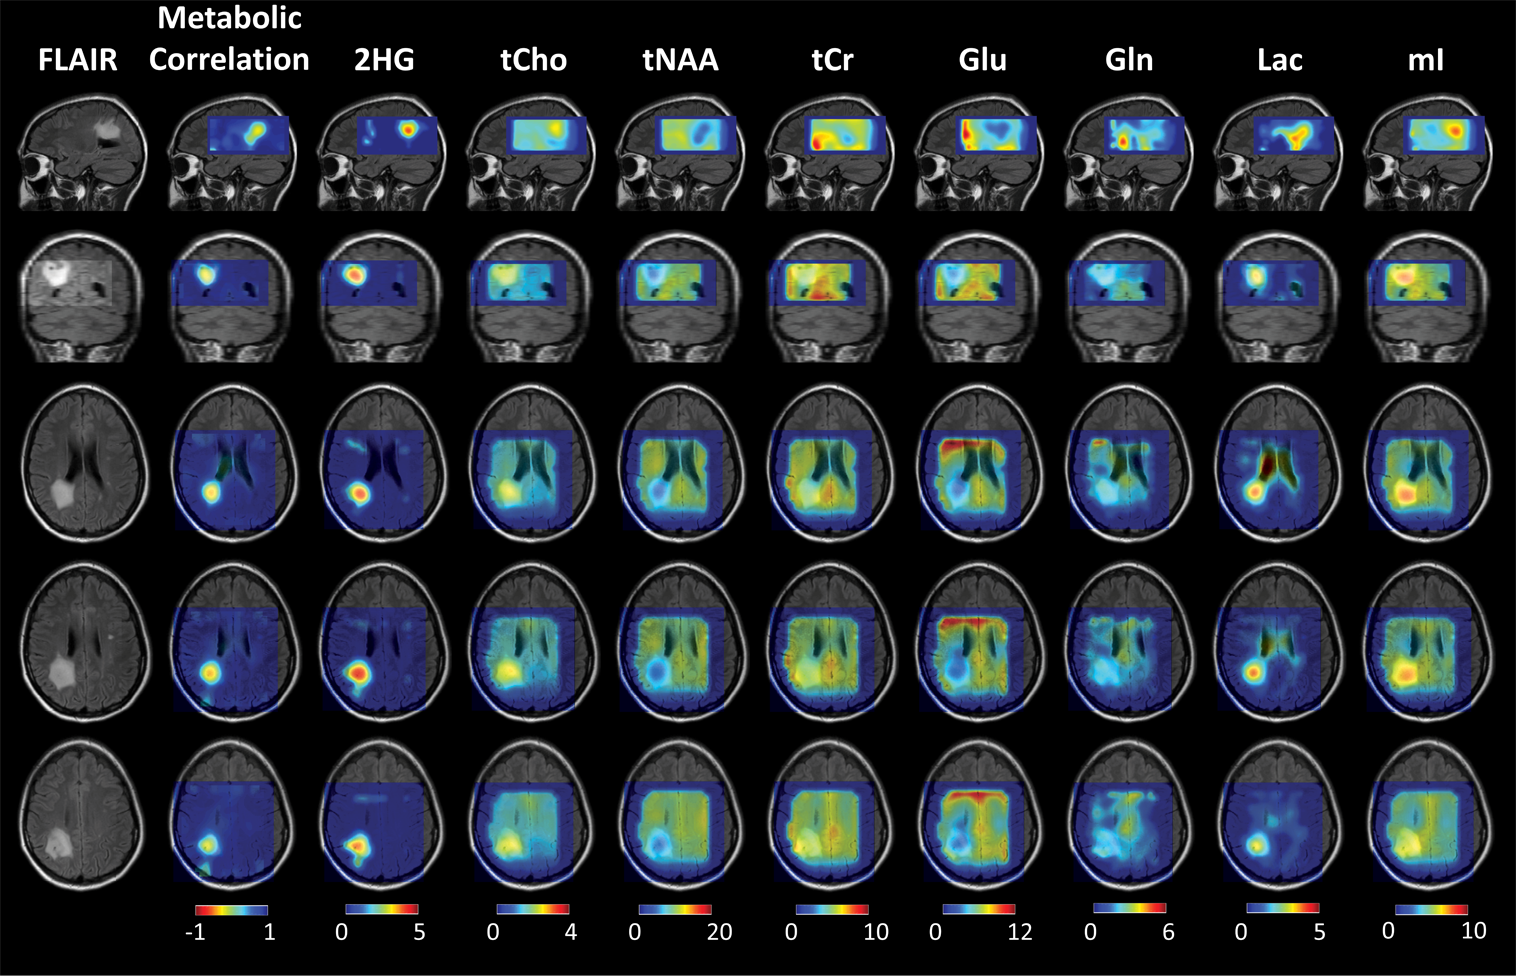
Figure 1 shows 3D EPSI data from a post-surgery IDH2 mutated secondary glioblastoma (GBM) patient. Gln and Lac were elevated and tNAA, tCr, Glu and mI were reduced in T2w-FLAIR high intensity region. However, 2HG was only elevated in anterior region of tumor mass, which partially overlaps with T1 post-gad region. The metabolic correlation map showed a great overlap with T1 post gadolinium enhanced region, with averaged metabolic correlation of -0.92 in this area, which may indicated a dramatically changed metabolic activity in this area. The seed voxel was selected in the normally appearing posterior region of VOI. Spectrum profile from VOI are shown with two representative spectra and LCModel fittings. Spectra from the anterior tumor region shows higher 2HG and Lac, and lower tNAA signal than medial region. Figure 2 shows 3D metabolic correlation map from IDH1 mutated low-grade oligodendroglioma patient. 2HG, tCho, Lac and mI was increased and tNAA, tCr, Glu was decreased in T2w-FLAIR high intensity region. The low correlation region (yellow) from metabolic correlation map shows good overlap with T2w-FLAIR high intensity region with averaged correlation of -0.2, which was much higher than the metabolic correlation calculated from patient 1 with IDH2 mutated glioblastoma. This suggests that the metabolic correlation map may give information about tumor heterogeneity and malignancy.CONCLUSION
We demonstrated 3D high resolution imaging of 2HG and other metabolites in IDH-mutated gliomas with metabolic correlation mapping. This technique would provide an important tool for tumor diagnosis.Acknowledgements
This work was supported by NIH R01CA184584 and CPRIT RP130427.References
1. Dang L, White DW, Gross S, et al. Cancer-associated IDH1 mutations produce 2-hydroxyglutarate. Nature 2009; 462(7274): 739-44.
2. Christensen BC, Smith AA, Zheng S, et al. DNA methylation, isocitrate dehydrogenase mutation, and survival in glioma. J Natl Cancer Inst. 2011; 103(2): 143-53
3. Choi C, Ganji SK, DeBerardinis RJ, et al. 2-hydroxyglutarate detection by magnetic resonance spectroscopy in IDH-mutated patients with gliomas. Nat Med. 2012; 18(4): 624-629.
4. Pope WB, Prins RM, Albert Thomas M, et al. Non-invasive detection of 2-hydroxyglutarate and other metabolites in IDH1 mutant glioma patients using magnetic resonance spectroscopy. J Neurooncol. 2012; 107(1): 197-205.
5. Andronesi OC, Kim GS, Gerstner E, et al. Detection of 2-hydroxyglutarate in IDH-mutated glioma patients by in vivo spectral-editing and 2D correlation magnetic resonance spectroscopy. Sci Transl Med 2012; 4(116): 116ra4.
6. Posse S, Otazo R, Caprihan A, et al. Proton echo-planar spectroscopic imaging of J-coupled resonances in human brain at 3 and 4 Tesla. Magn Reson Med. 2007; 58(2): 236-44.
7. Sabati M, Sheriff S, GuM, et al. Multivendor implementation and comparison of volumetric whole-brain echo-planar MR spectroscopic imaging. Magn Reson Med. 2015; 74(5): 1209-20.
8. Zhongxu An, Sandeep Ganji, et al. 1H Echo Planar Spectroscopic Imaging of 2-hydroxyglutarate in brain tumors at 7T in vivo. ISMRM 24th Annual Meeting & Exhibition. 2015; p 1360.
9. Provencher SW. Estimation of metabolite concentrations from localized in vivo proton NMR spectra. Magn Res Med. 1993; 30(6): 672-9.
Figures