2200
Parameter Estimation in a Mathematical Model of Murine Glioma from MR Imaging1Mathematical & Statistical Sciences, Arizona State University, Tempe, AZ, United States, 2Mathematics, North Carolina State University, Raleigh, NC, United States, 3Mathematics, University of Arizona, Tucson, AZ, United States, 4Biological and Health Systems Engineering, Arizona State University, Tempe, AZ, 5Neuro-Oncology Research, Barrow Neurological Institute, Phoenix, AZ, United States, 6BNI-ASU Center for Preclinical Imaging, Barrow Neurological Institute, Phoenix, AZ, United States, 7Neurosurgery Research, Barrow Neurological Institute, Phoenix, AZ, United States
Synopsis
This study assesses the feasibility of estimating and quantifying the uncertainty in growth parameters for a mathematical model of glioma growth from MR imaging. Five immunocompetent albino mice were inoculated intracranially with syngeneic GL261 tumor cells and followed by serial imaging for 25 days. We simulated the growth of the tumor from the known initial conditions using a popular two-parameter reaction-diffusion model and compared the results with the imaging. Our simulations show that the growth and diffusion rates in the model cannot be identified from imaging data alone. Uncertainty quantification in model predictions of the tumor is problematic.
Introduction
A commonly used reaction-diffusion model of the growth of human glioblastoma can be expressed in terms of a normalized tumor cell density by $$\partial u/\partial t = \nabla\cdot(D\nabla u) + \rho u(1-u).$$
The model implies that the tumor boundary in a uniform medium propagates as a traveling wave at speed $$$c=2\sqrt{\rho D}$$$. Previous studies have suggested that, under suitable assumptions, "patient-specific" estimates of the ratio $$$D/\rho$$$ obtained from preoperative imaging can predict overall survival of individual patients following initial resection1 and quantify the survival benefit of resection in certain cases2. Radio- and chemotherapy complicate efforts to quantify the the model parameters.
The objective of this study is to quantify the parameters $$$\rho$$$ and $$$D$$$ from a controlled laboratory study using serial MR imaging over a period of 25 days of 5 immunocompetent mice that received identical intracranial inoculations of syngeneic GL261-luc2 glioma cells and no further treatment. The experimental protocol provides good estimates of the initial conditions, from which the model can be integrated numerically to compare the simulated tumors with the observed ones. We seek estimates of $$$D$$$ and $$$\rho$$$, and their associated uncertainties, from simulations. Our results may be relevant to future efforts to quantify analogous growth parameters in mathematical models of human glioblastoma growth from MR imaging.
Methods
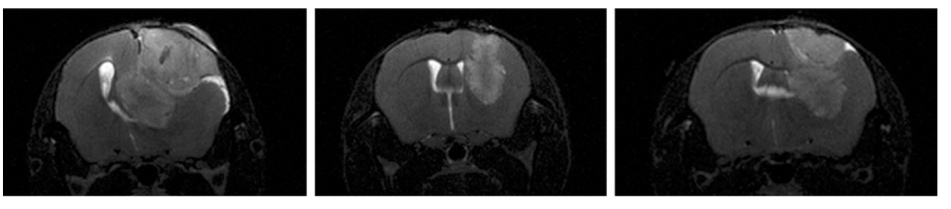
Five immunocompetent albino C53BL/6 mice received identical intracranial inoculations of approximately $$$2\times 10^4$$$ cultured GL261-luc2 cells using previously published methods3. Tumor bioluminescence and MR imaging were performed under isoflurane anesthesia on days 11, 15, 18, 22, and 25 following implantation. MR images were acquired using a Bruker BioSpin 7T system. High-resolution T2-weighted (T2W), diffusion weighted, T1-weighted, dynamic contrast-enhanced, and post-contrast T1W images were obtained in this order at each session. Figure 1 shows representative T2W images at day 25 for 3 of the mice.
The brain, ventricle, and tumor spaces were segmented from the high-resolution T2W images and the associated brain volumes co-registered to the day-18 imaging time point. The transformed data points and imaging intensity values were interpolated onto a uniform $$$0.1\mbox{mm}\times 0.1\mbox{mm}\times 0.5\mbox{mm}$$$ grid for simulation and comparison purposes.
For given values of $$$D$$$ and $$$\rho$$$, time integration of the model produces a simulated tumor cell population that can be compared to the visible tumor on the associated T2W MR images under some assumptions regarding the cell density threshold corresponding to enhancing regions. We quantify the goodness of fit by computing the Jaccard distance (overlap) between the simulated tumor (set $$$A$$$) and the MR image (set $$$B$$$), $$J(A,B) = 1 - \frac{|A\cap B|}{|A\cup B|}.$$
We have $$$J(A,B)=1$$$ if $$$A$$$ and $$$B$$$ are disjoint and $$$J(A,B)=0$$$ if $$$A=B$$$. Using a suitable optimization algorithm, we obtain estimates of $$$D$$$ and $$$\rho$$$ for each mouse that minimize $$$J$$$ at each imaging time point.
Results
We are able to produce computationally useful grids from 3 of the 5 mice. The volume of enhancing tumor for these 3 mice at day 25 (Figure 1) ranges from approximately $$$12 \mbox{mm}^3$$$ to $$$62 \mbox{mm}^3$$$. Optimized estimates of $$$D$$$ vary by more than a factor of 10 between the mice and of $$$\rho$$$ by more than a factor of 2. The parameter estimates are relatively insensitive to initial conditions and to the choice of cell density thresholds assumed to correspond to enhancing regions on T2W imaging.
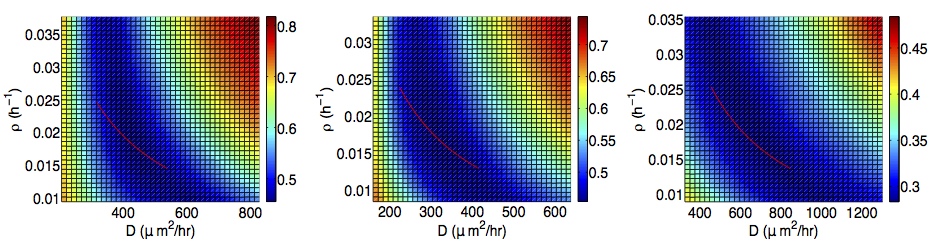
To further characterize the uncertainty in the parameters, we define the the average Jaccard distance $$$E(\rho, D)$$$ between the simulated tumor and the observed enhancing tumor volume over all imaging time points. Figure 2 shows a color plot of $$$E(\rho,D)$$$ as a function of $$$\rho$$$ and $$$D$$$ for each mouse. Dark blue colors indicate parameters giving simulated tumors with maximal overlap with observations. A plot of $$$\rho$$$ as a function of $$$D$$$ corresponding to the observed speed of the tumor is plotted in red over each dark blue region in Figure 2.
Discussion
The results in Figure 2 suggest that the parameters $$$\rho$$$ and $$$D$$$ in the tumor growth model are not identifiable from the available imaging data: no unique choice minimizes $$$E(\rho, D)$$$. They cannot be identified from the estimated wave speed, either. Additional data, such as glioma cell density estimates from tissue histology samples taken throughout the tumor, are needed to quantify the simulation errors and produce reliable estimates of the model parameters.Conclusion
Our results suggest that efforts to identify "patient specific" tumor growth parameters solely from MR imaging data may not be possible. Confidence intervals for nonidentifiable parameters cannot be defined. The reliability of associated numerical forecasts is questionable.Acknowledgements
The authors would like to thank Shane Lubold for assistance in writing code. EMR was partially funded by Graduate Assistance of Areas in National Need (GAANN) Grant Number P200A120120. BJA was partially supported by the NSF grant number DMS-1148771. JDP was partially supported by NSF grant number DGE-1311230. Funding for the experimental work was provided by the Barrow Neurological Foundation and Arizona State University.References
1. Swanson KR, Rostomily RC, and Alvord EC, Jr. A mathematical modeling tool for predicting survival of patients following resection of glioblastoma: A proof of principle. Br J Cancer 2008; 98:113.
2. Baldock AL, Ahn S, Rockne R, Johnston S, et al. Patient-specific metrics of invasiveness reveal significant prognostic benefit Of resection in a predictable subset of gliomas. PLoS One 2014; 9:e99057.
3. Abdelwahab MG, Tejas S, Preul MC, and Scheck AC. Intracranial implantation with subsequent 3d in vivo bioluminescent imaging of murine gliomas. J Vis Exp 2004; 57:3403.
Figures