2198
Changes of metabolite levels with low SNR in brain tumours measured by hybrid FET PET and 3D MRSI1Institute of Neuroscience and Medicine, Medical Imaging Physics (INM-4), Forschungszentrum Jülich, Jülich, Germany, 2Department of Nuclear Medicine, Faculty of Medicine, RWTH Aachen University, Aachen, Germany, 3Miller School of Medicine, University of Miami, Miami, FL, United States, 4Department of Neuroradiology, Faculty of Medicine, RWTH Aachen University, Aachen, Germany, 5Department of Neurology, Faculty of Medicine, JARA, RWTH Aachen University, Aachen, Germany
Synopsis
The specificity of MR based diagnosis of gliomas may be improved by O-(2-[18F]fluoroethyl)-L-tyrosine (FET) uptake measured with PET and metabolite changes obtained from simultaneously acquired volumetric MR spectroscopic imaging. In order to cope with low SNR of the metabolites, the MR spectra of 25 patients were subject-specifically averaged within the tumour borders transferred from FET PET and compared to non-affected white matter of the contra lateral side. Strongest signal drops were found for GLU (0.58±0.43, WHO II) and NAA (0.33±0.13, WHO II-IV), strongest increase for CHO/NAA (3.9±2.4). The metabolite changes showed no dependency on tumour grade.
Purpose
Diagnosis of gliomas is commonly based on MR imaging, but its specificity remains limited. Additional information may be obtained by using metabolic data from PET using O-(2-[18F]Fluorethyl)-L-Tyrosine (FET) 1 and MR spectroscopy. FET specifically accumulates in gliomas and depicts the metabolically active tumour centre owing to the increased expression of amino acid transporters 2. Metabolites such as myo-inositol (MINO), creatine/phosphocreatine (CR), choline (CHO), N-acetyl aspartate (NAA), and glutamine (GLN) and glutamate (GLU) 3 give evidence of gliosis, energy balance, cell membrane turnover, neuronal loss and signalling in tumour progression 4, respectively. These different metabolic properties can be simultaneously acquired, but the large voxel sizes imposed by the low signal-to-noise ratio and MR-based positioning of the acquisition voxel/slice cause strong partial volume effects with signal contributions from healthy, peritumoural, and proliferating tumour tissue, which hinders reasonable tumour delineation. Sampling of the tumour can be improved using volumetric MR spectroscopic imaging (MRSI), which can be run in parallel to PET data acquisition using hybrid MR-PET scanners. In the present hybrid MR-PET study, metabolite intensities averaged over the tumour volume defined by FET uptake were acquired from a series of 25 patients with brain tumours of grade WHO II-IV. Moreover, possible metabolite level changes are investigated for the dependency on tumour grade.Methods
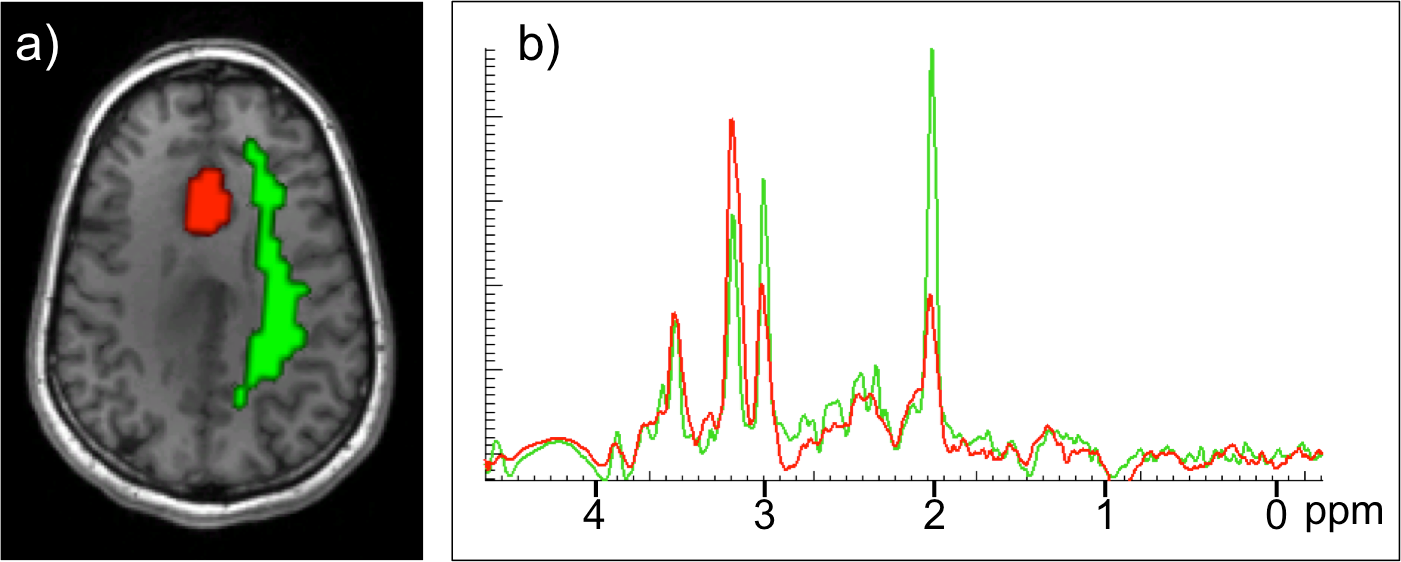
The local ethical committee approved the study. All patients gave written informed consent prior to the measurement. Out of a series of 117 patients with brain tumours investigated by FET PET and MRSI in a hybrid PET MR scanner 5, 25 subjects (9 female, 16 male) of 47 ±16 years average age with histologically confirmed gliomas (5 WHO II, 14 WHO III, 6 WHO IV) were included in this analysis before treatment. Because of negative findings in FET PET and unsuitable tumour location/bad data quality, 35 and 36 patients, respectively, were rejected. 11 patients were excluded due to missing histology or carried out treatment. 190±15 MBq of FET was administered to every patient. Parallel to PET data acquisition in list mode over 50 min, T1-weighted MPRAGE data and a MR spectroscopic image data set with full brain coverage by means of a volumetric echo planar SI (EPSI) sequence with TE=17.6 ms and 16 min total acquisition time 6 were simultaneously acquired. All measurements were carried out on a Siemens (Erlangen, Germany) 3T TIM TRIO with the Siemens BrainPET built-in in the magnet bore. 3D volumes representing the distribution of the metabolites were determined by employing the MIDAS software package 7. The FET data were down-sampled to the resolution of the MRSI data set (64x64x32 vxl, 5.6x5.6x10 mm3 each) and the tumour volumes with enhanced FET uptake were delineated based on uptake values greater than 1.6 times the unspecific uptake 1. On the contralateral side, voxels with white matter content greater than 80 % were selected from the cranial 4 cm of the brain to form the non-affected white matter (NAWM) volume as the reference region. In both volumes of interest, the tumour and the NAWM, the MR spectra were averaged over all voxels (Fig. 1) with sufficient spectral linewidth of 2-12 Hz. The resultant spectra were analysed to obtain the relative metabolite concentrations.Results
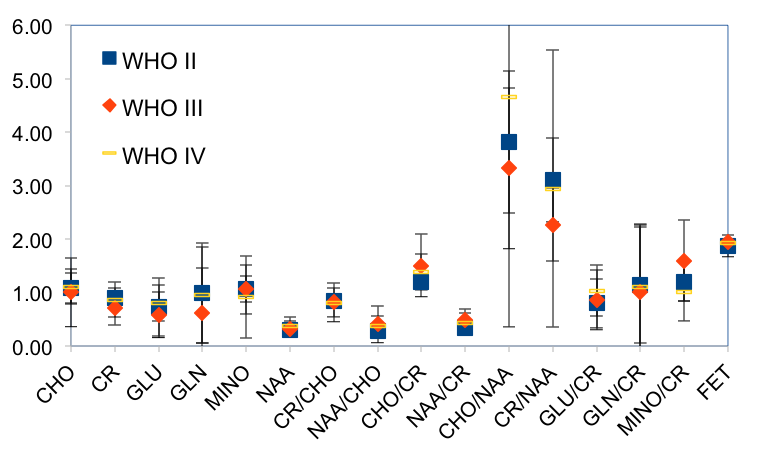
On average, the spectra were calculated from 183±180 tumour voxels and 151±73 NAWM voxels. The metabolite levels and the corresponding ratios changed as shown in Fig. 2. Strongest reductions were found for GLU (0.58±0.43, WHO II) and NAA (0.33±0.13). Ratios of Cho/NAA and Cr/NAA were greatly increased over NAWM values. The ratio of CHO/NAA (3.9±2.4) showed the largest rise. The metabolite changes showed no dependency on tumour grade.Discussion
The results show reductions of GLU and NAA as well as an increase in CHO/NAA and CR/NAA in gliomas. Further changes are within the standard deviation of the small size of the patient population, which does not allow for a more meaningful subdivision. Different histological types of gliomas may show different metabolite patterns, which may be mixed in the coarse tumour grade classification.Conclusions
Decreased GLU and NAA as well as increased CHO/NAA and CR/NAA signal levels were detectable after averaging the MR spectra over the FET enhancing tumour volumes. The sensitivity of such studies may be improved if more cases, which provide a histological subdivision of the gliomas, are included.
Acknowledgements
We thank Sulaiman Sheriff for his excellent technical support and Cornelia Frey, Silke Frensch and Suzanne Schaden for the reliable support of the data acquisition.References
1. Pauleit D, Floeth F, Hamacher K, et al. O-(2-[18F]fluoroethyl)-L-tyrosine PET combined with MRI improves the diagnostic assessment of cerebral gliomas. Brain 128, 678-687, 2005.
2. Langen K-J, Hamacher K, Weckesser M, et al. O-(2-[18F]fluoroethyl)-L-tyrosine: uptake mechanisms and clinical applications. Nucl Med Biol 33, 287-294, 2006.
3. de Groot J, Glutamate and the biology of gliomas. Glia 59, 1181-9, 2011.
4. de Graaf, RA. In Vivo NMR Spectroscopy: Principles and Techniques. Wiley-Interscience, 2nd ed.
5. Mauler J, et al. Spatial correlation of brain tumour volume delineated by 3D MRSI-PET, ISMRM 2016, Toronto.
6. Ebel A, Maudsley A A, Detection and correction of frequency instabilities for volumetric 1H echo-planar spectroscopic imaging. MRM 53, 465-469, 2005.
7. Maudsley A A, Darkazanli A, Alger J R, et al. Comprehensive processing, display and analysis for in vivo MR spectroscopic imaging. NMR Biomed 19, 492-503, 2006.
Figures