2197
Fast macromolecular proton fraction mapping validated in the murine model of cuprizone induced demyelination1Laboratory of Neurobiology, Tomsk State University, Tomsk, Russian Federation, 2N.N.Vorozhtsov Novosibirsk Institute of Organic Chemistry, Russian Federation, 3Institute of Cytology and Genetics, Novosibirsk, Russian Federation, 4N.N.Vorozhtsov Novosibirsk Institute of Organic Chemistry, Novosibirsk, Russian Federation, 5Siberian State Medical University, Tomsk, Russian Federation, 6Department of Radiology, University of Washington, Seattle, WA, United States
Synopsis
A recently developed quantitative MRI method, fast macromolecular proton fraction mapping (MPF) has shown a promise as a biomarker of myelin in human and animal studies with a particular advantage of sensitivity to grey matter (GM) demyelination. This study aimed to histologically validate the capability of MPF mapping using the cuprizone demyelination model. MPF strongly correlated with quantitative histology in all animals (r=0.95, p<0.001) as well as in treatment and control groups taken separately (r=0.97, p=0.001 and r=0.95, p=0.003, respectively). Close agreement between MPF and histology suggests that fast MPF mapping enables robust and accurate quantitative non-invasive assessment of demyelination.
Purpose
MPF is a key parameter determining the magnetization transfer (MT) effect based on the two-pool model1. Resent years, MPF has attracted remarkable attention as a quantitative biomarker of myelin due to high sensitivity to demyelination and strong correlations between MPF and myelin content in neural tissues reported in a number of studies2-12. Cuprizone-induced model of multiple sclerosis (MS) in mice is a widely used and reproduces certain pathological aspects of the disease including both white (WM) and grey (GM) demyelination. The study aimed to validate the fast synthetic-reference MPF mapping method using quantitative histology in the murine cuprizone demyelination model.Methods
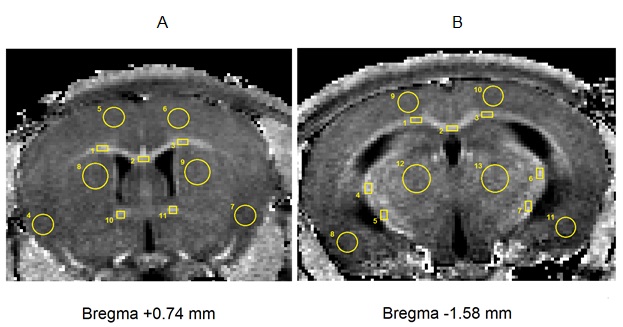
Animal procedures and histology. Seven mice were treated 0.3% cuprizone solution in drinking water during 8 weeks to induce demyelination, and seven control mice received regular vivarium chow and water. After scanning, brain sections were stained histologically using Luxol Fast Blue (LFB) colorant. Image Acquisition. Mice were imaged on an 11.7 T small animal MRI scanner (BioSpec 117/16 USR). A fast high-resolution 3D MPF mapping protocol was implemented according to the previously described single-point method with synthetic reference image normalization13,14. MPF maps were reconstructed using the recently proposed single-point synthetic-reference method which requires only three source images for MPF determination. Image Analysis. MPF maps and microphotographs of LFB stained histological sections were analyzed in two brain locations (-1.58 mm and +0.74 mm from bregma) defined according to a mouse brain atlas15. MPF values and LFB optical densities were measured for a series of WM and GM structures including corpus callosum, anterior commissure, internal capsule, thalamus, caudoputamen, and cortex. Regions-of-interest (ROIs) of a standard size and shape were manually placed on MPF maps and photographs of LFB stained sections within investigated brain structures (Fig. 1) and quantified using the procedure modified from that described by Underhill, at al.11. Mean values of MPF and LFB optical density were calculated for each anatomical structure. MPF values and quantitative histology data were compared between cuprizone-treated and control animals using independent-samples t-test. Pearson’s correlation coefficient (r) and linear regression analysis were used to determine associations between MPF values and LFB optical densities across anatomical structures and animals. Differences between Pearson’s correlation coefficients between groups were tested using Fisher’s r-to-z transformation. Slopes and intercepts of regression equations were compared between groups using ANCOVA16.Results
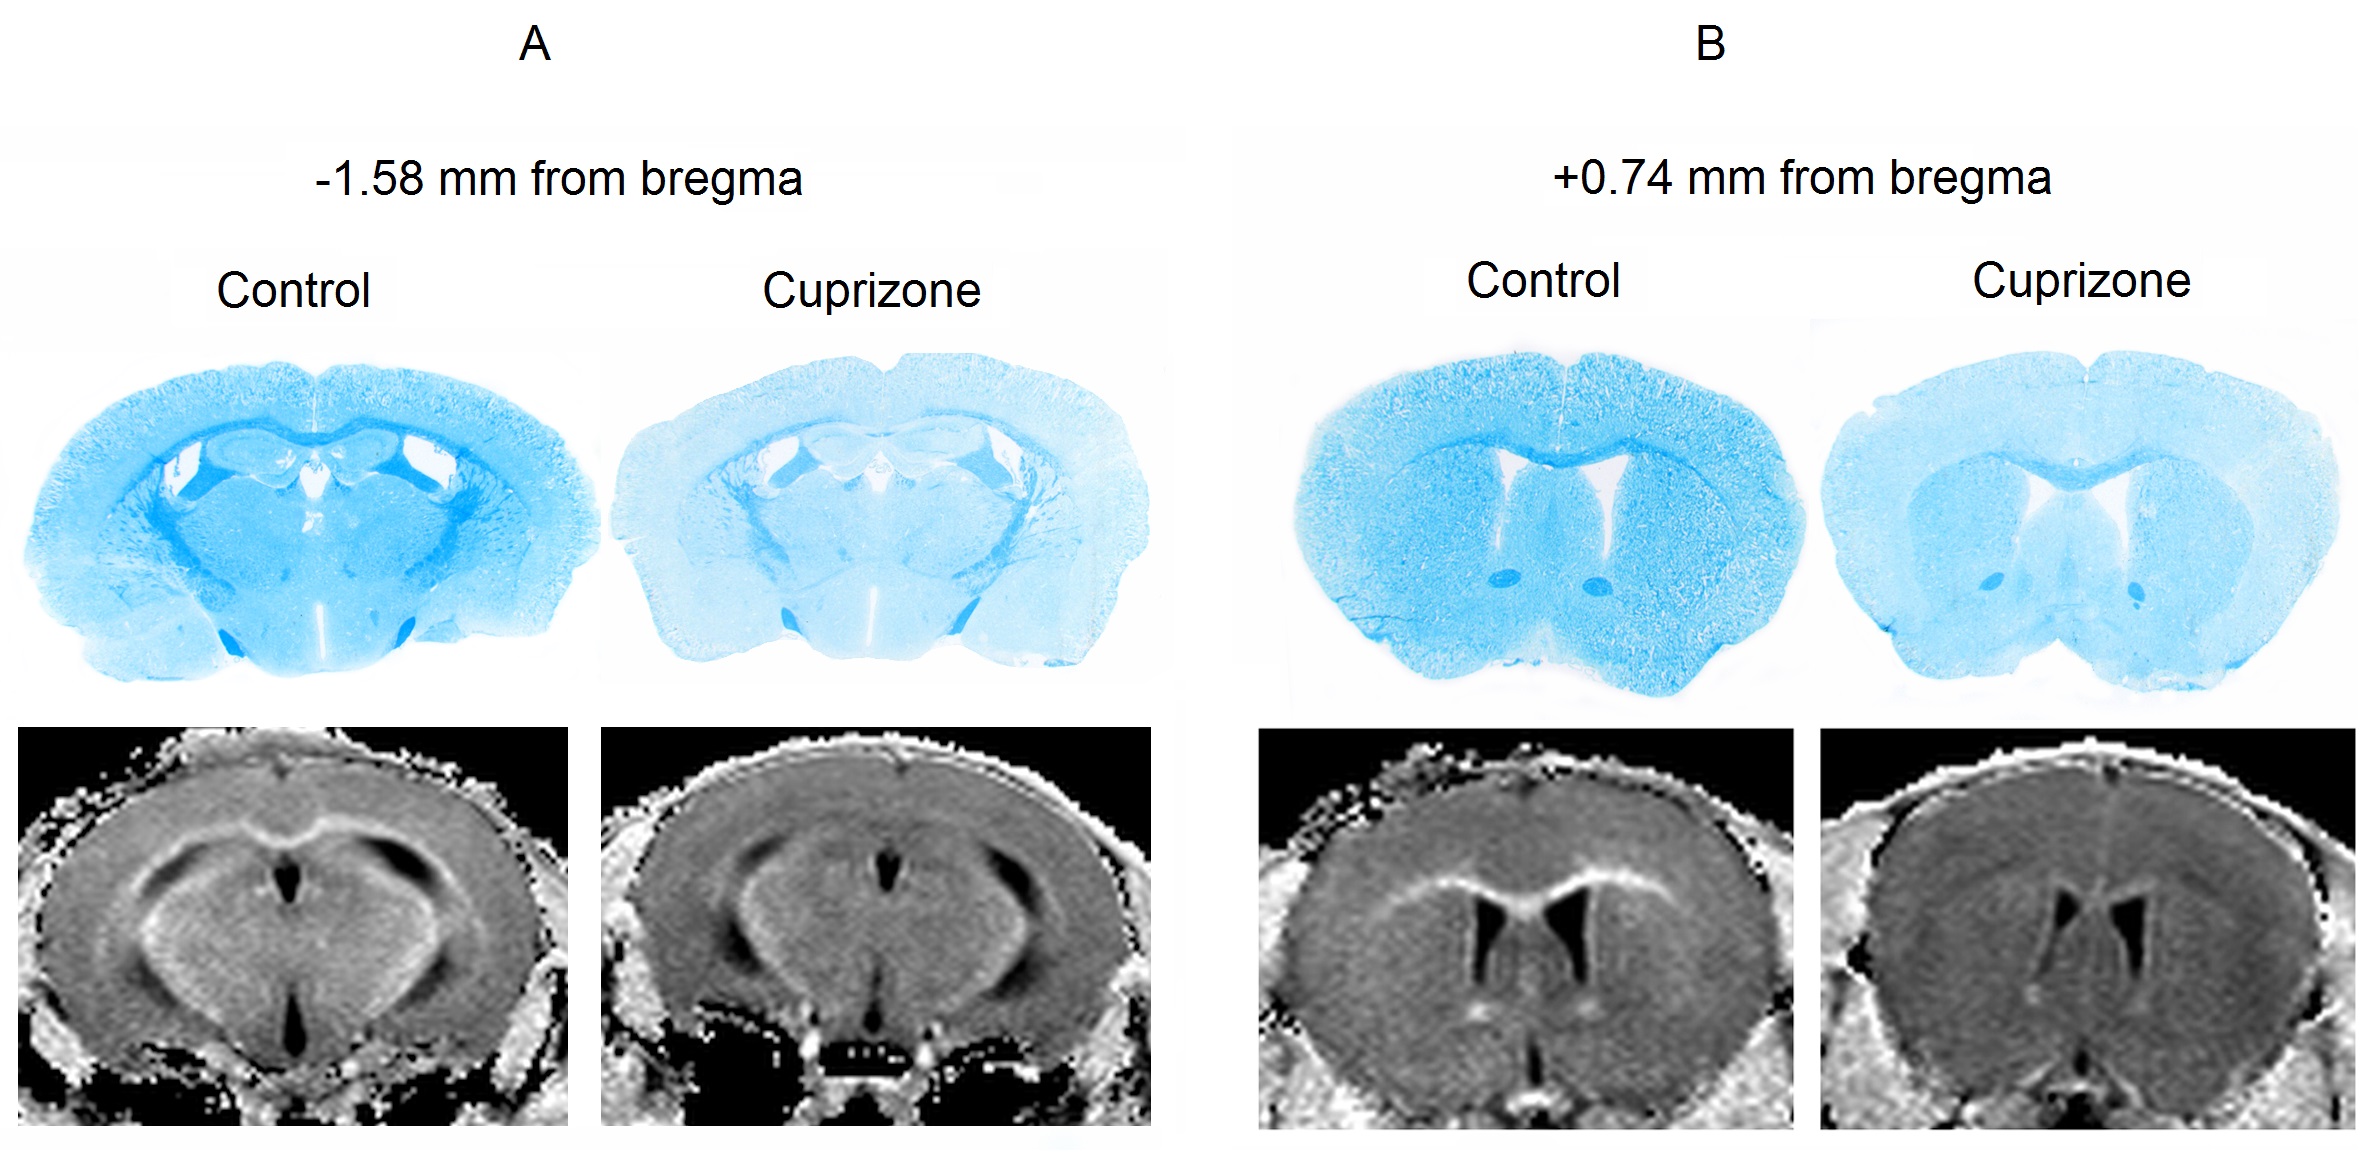
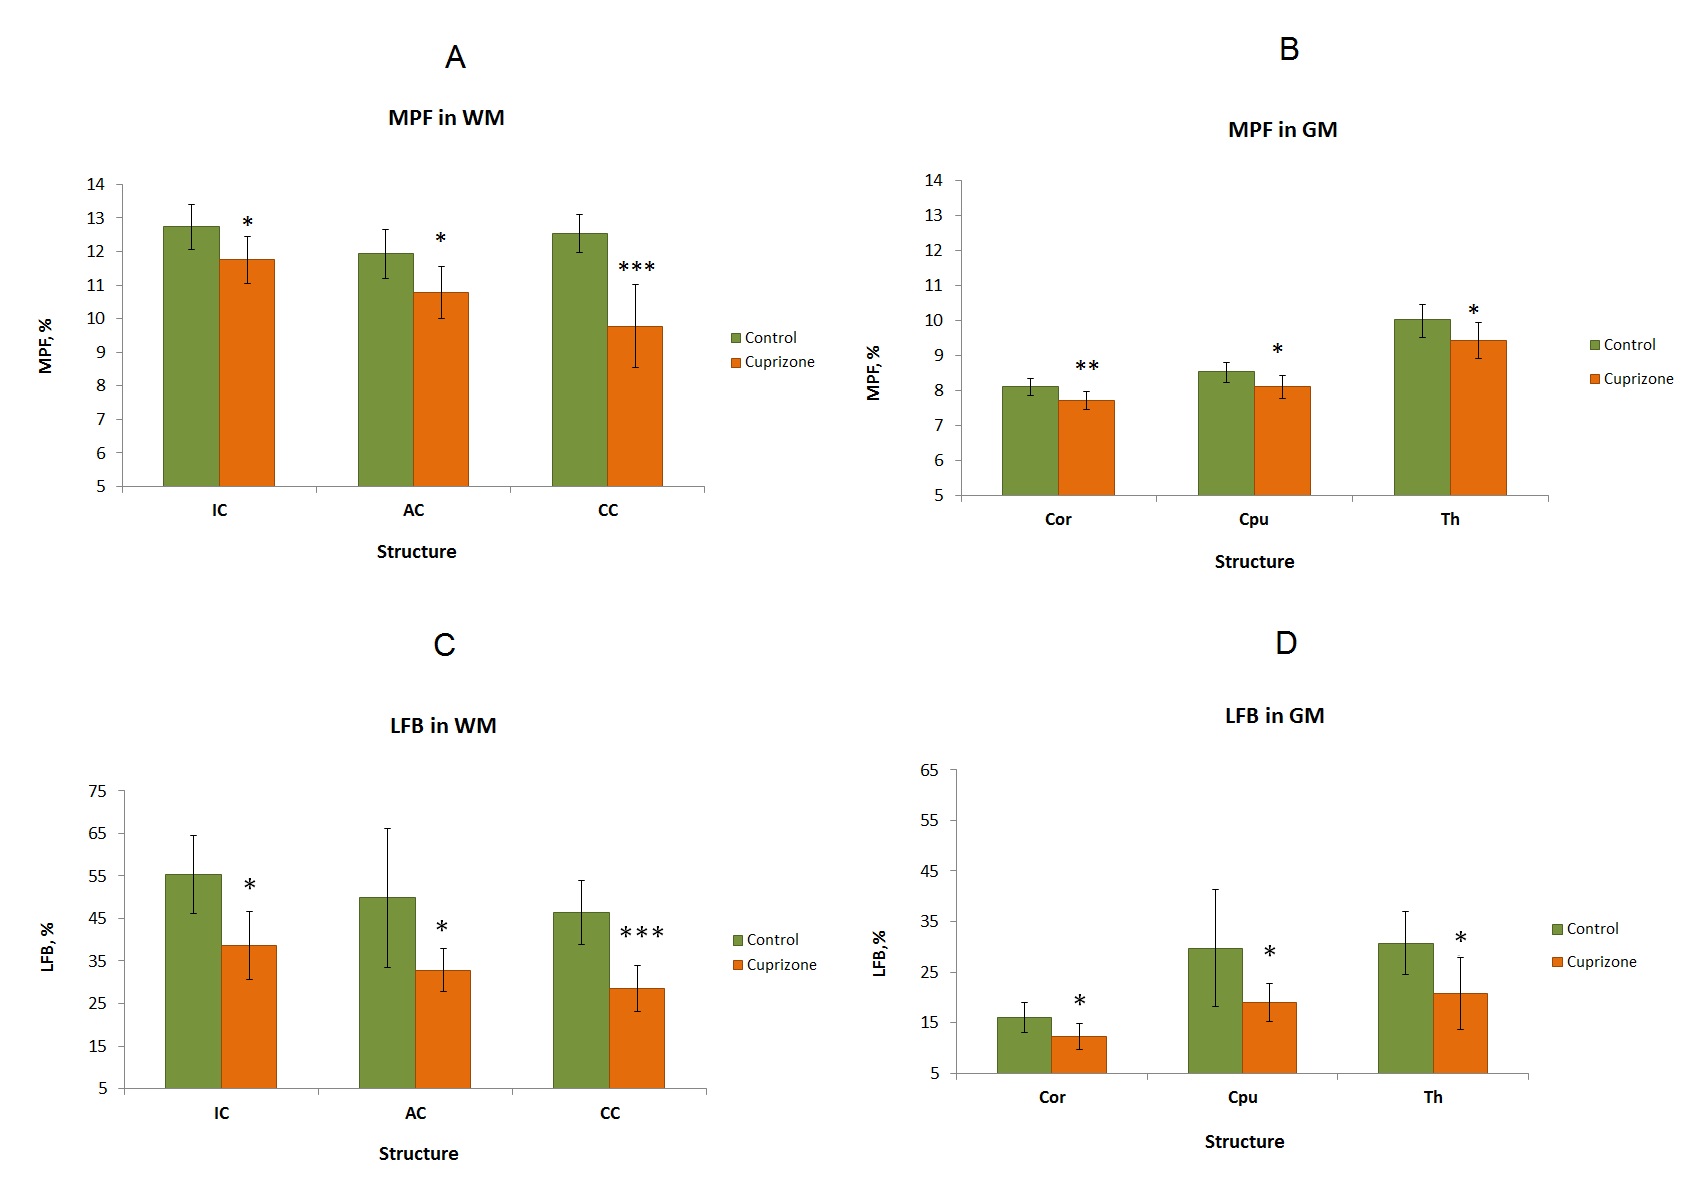
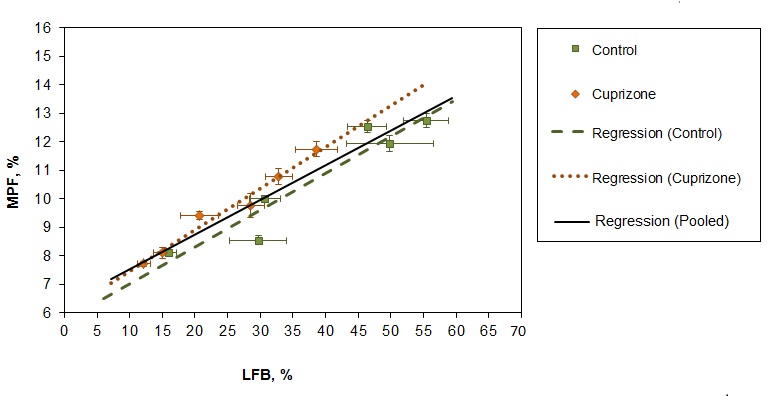
Example MPF maps and LFB stained sections of control and cuprizone-treated murine brains are presented in Fig. 2. Cuprizone-treated mice had visually reduced tissue contrast on MPF maps, especially in the corpus callosum and a slight overall reduction of the image intensity that can be appreciated when compared to control maps presented in the same absolute scale (Fig. 2). A visible reduction in the optical density on LFB stained brain sections of mice treated with cuprizone also can be appreciated in both WM and GM structures (Fig. 2). Quantitative comparison of MPF values and LFB optical densities in a series of anatomical regions between cuprizone-treated and control animals is presented in Fig 3. Both MPF and LFB staining intensity in all WM and GM anatomical structures demonstrated a statistically significant decrease in the cuprizone group. Results of linear regression analyses of MPF values as a function of LFB optical density for individual and averaged across anatomical structures data are presented in Fig. 4. In the pooled sample including data for each anatomical structure in each animal, MPF values and LFB optical densities were strongly correlated (r = 0.95, p < 0.001) (Fig. 4). Regression analyses for separate groups of cuprizone-treated and control animals demonstrated remarkably similar results in terms of correlation strengths and coefficients of regression equations (Fig. 4). Very strong correlations were observed in both groups (r = 0.97, p = 0.001 for cuprizone-treated animals and r = 0.95, p = 0.003 for control animals) with no significant differences in regression coefficients (p = 0.59 for slopes and 0.60 for intercepts) and correlation strengths (p = 0.76).Conclusion
Fast 3D MPF mapping provides a robust clinically-targeted quantitative myelin imaging modality that showed the capability to detect demyelination in normal-appearing brain tissues in recent MS and mild traumatic brain injury studies. This study provides the first quantitative histological validation of the fast MPF mapping method in the animal demyelination model. Very strong correlations between histological myelin staining and MPF suggest that the method enables accurate quantitative assessment of the myelin content in both WM and GM and that demyelination is a major or even sole pathological substrate of MPF changes in demyelinating diseases.Acknowledgements
Russian Science Foundation (project #14-45-00040).References
1. Henkelman RM, et al. Quantitative interpretation of magnetization transfer. Magn Reson Med. 1993;29:759–766.
2. Odrobina EE, et al. MR properties of excised neural tissue following experimentally induced demyelination. NMR Biomed. 2005;18:277–284.
3. Schmierer K, et al. Quantitative magnetization transfer imaging in postmortem multiple sclerosis brain. J Magn Reson Imaging. 2007;26:41–51.
4. Rausch M, et al. Characterization of white matter damage in animal models of multiple sclerosis by magnetization transfer ratio and quantitative mapping of the apparent bound proton fraction f. Mult. Scler. 2009;15:16–27.
5. Ou X, et al. The MT pool size ratio and the DTI radial diffusivity may reflect the myelination in shiverer and control mice. NMR Biomed. 2009;22:480–487.
6. Ou X, et al. Quantitative magnetization transfer measured pool-size ratio reflects optic nerve myelin content in ex vivo mice. Magn Reson Med. 2009;61:364–371.
7. Janve VA, et al. The radial diffusivity and magnetization transfer pool size ratio are sensitive markers for demyelination in a rat model of type III multiple sclerosis (MS) lesions. Neuroimage. 2013;74:298–305.
8. Samsonov A, et al. Quantitative MR imaging of two-pool magnetization transfer model parameters in myelin mutant shaking pup. Neuroimage. 2012;62:1390–1398.
9. Thiessen JD, et al. Quantitative MRI and ultrastructural examination of the cuprizone mouse model of demyelination. NMR Biomed. 2013;26:1562–1581. 10. Turati L, et al. In vivo quantitative magnetization transfer imaging correlates with histology during de- and remyelination in cuprizone-treated mice. NMR Biomed. 2015;28:327–337.
11. Underhill HR, et al. Fast bound pool fraction imaging of the in vivo rat brain: Association with myelin content and validation in the C6 glioma model. Neuroimage. 2011;54:2052–2065.
12. Dula AN, et al. Multiexponential T2, magnetization transfer, and quantitative histology in white matter tracts of rat spinal cord. Magn Reson Med. 2010;63:902–909.
13. Yarnykh VL. Time-efficient, high-resolution, whole brain three-dimensional macromolecular proton fraction mapping. Magn. Reson. Med. 2016;75:2100–2106.
14. Naumova AV, et al. High-resolution three-dimensional macromolecular proton fraction mapping for quantitative neuroanatomical imaging of the rodent brain in ultra-high magnetic fields. Neuroimage. 2016; 10.1016/j.neuroimage.2016.09.036. [Epub ahead of print]
15. Paxinos G, Franklin K. The mouse brain in stereotactic coordinates. London: 2nd ed. Academic Press; 2001.
16. McDonald JH. Handbook of Biological Statistics. Baltimore, Maryland: 3rd ed. Sparky House Publishing; 2014.
Figures