2195
Morphological growth patterns in common marmoset developing brain1Department of Physiology, Keio University, Tokyo, Japan, 2Central Institute of Experimental Animals, 3Laboratory for Marmoset Neural Architecture, RIKEN BSI, 4Okinawa Institute of Science and Technology Graduate University
Synopsis
The postnatal brain development at the macroscale in common marmoset has been studied based on the volume measurement, as is not well-studied despite its importance. Maximizing the feature that it takes only 2 years to reach adulthood, the longitudinal MRI was conducted for 23 subjects. The volume of gray matter was inverted U curve trajectories, while increase of white matter became stable around 12 months old. Developmental patterns of regions in cerebral cortex were similar to gray matter but different in developmental timing. The study can demonstrate overall growth patterns were similar to patterns previously reported in humans and other monkeys.
Background
For the purpose of studying higher cognitive function deficit in common marmosets, the research framework has been prepared such as development of transgenic models1. One of the appropriate evaluations of such disease models is marmoset MRI. Various techniques have been applied to marmoset as well such as diffusion MRI2 and functional MRI3–6. To enrich marmoset MRI database, their brain development has been studied such as construction of the MRI atlas of embryo and fetal stages7 and analysis of its fetal sulcation/gyrifaction pattern8. However, the postnatal brain development has not been well studied yet. For deeper understanding marmoset’s brain development, estimation of the growth trajectory at the whole scale is essential. Towards this goal the volume of the gray matter (GM) and white matter (WM) were measured for typical developing marmosets. In addition, the volume of the regions in the cerebral cortex was measured to investigate whether regional specific features were observable.Methods
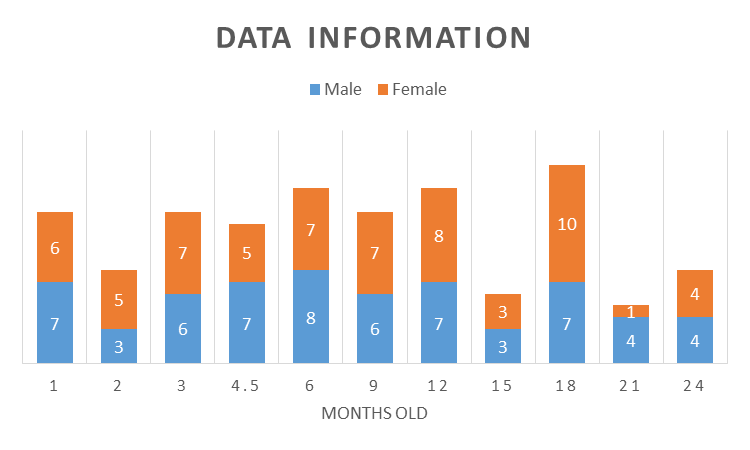
The number of subject was 23 (male 11, female 12). MRI was performed at least 4 times per subject at multiple timepoints, ranged from 1 months old (m.o.) to 24 m.o.. The total number of data was 125 (figure1). Data were taken until 24 m.o., given this age is considered to be adulthood9. T1 weighted images were acquired on 7.0 T scanner, with 0.26 mm x 0.26mm in plane resolution and 0.27 mm in slice thickness. For volume measurements, individual images were segmented into GM, WM, and cerebrospinal fluid using probability maps made using age-specific templates. They were constructed for optimal segmentation of developing brain with low contrast. Regions in the cerebral cortex was defined using the parcellation atlas10 by registration to the native space of individual images. The data of volume measurements were used for estimating growth trajectories in each tissue/region. Mixed non-linear models were applied because this was optimal for longitudinal data11.Results
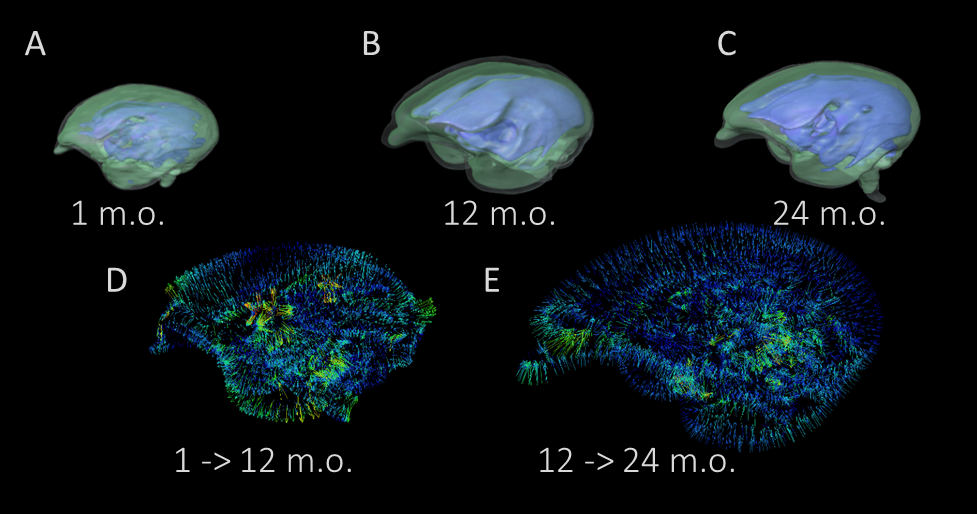
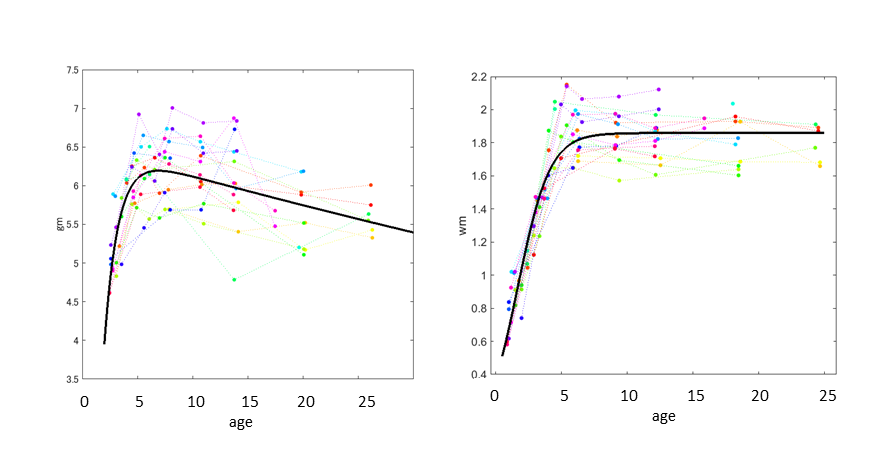
Overall pattern of gray matter development was inverted U shaped trajectories: the volume decreased after rapid increase. Its tendency was confirmed by 3D rendered images in figure2. Meanwhile the pattern of white matter development was best fitted to the logistic growth model. The volume increased rapidly until 6months old, and its increase was unchanged after slow increase (figure3). The volume development of the cerebral cortex was similar to the gray matter, but the regional features were observed in terms of the timing of reaching the peak, the time length of its decrease, and steepness of the volume decrease. For instance, the primary visual cortex reached the earliest volume peak at 3.8 months old among other regions, and the volume soon decreased until 24 months old. On the other hand, it took 6.8 months old to reach the volume peak in the third visual cortex, and it decreased at a slow rate.Discussion
We characterized the postnatal brain volume development at the whole scale using the longitudinal design covering from infants to adults first time ever. The inverted U shaped patterns in GM was observed previously in human12–14 or macaque monkeys15–17, which were features of non-human primates. The developmental patterns differ from mouse in a way which the significant volume decrease are not observed after reaching the peak18,19. The rapid volume increase of white matter was observed until 6 months old and stable afterwards. It was different from human brain, in that their volume increase continues even after adulthood20. WM development needs to be further characterized using various parameters measurements such as diffusion tensor imaging to investigate whether WM properties change after the peak. Region-specific volume changes of regions in cerebral cortex were relatively similar to the patterns of rhesus monkey. Several regions in temporal lobe decrease slowly in marmoset, which were similar in rhesus monkey15 but different in human21. Careful comparison in this respect may reveal human-specific features. Current data were limited to the 24 m.o., which was considered to be the beginning of the adulthood9. Considering their morphological changes may continue after 24 m.o., it was difficult to infer whether the brain was matured in terms of volume measurement in this study. It is necessary to keep acquiring data to investigate when their morphological changes would be stable and whether regions differ in speed of their brain maturation in this analysis.Conclusion
In this study the typical brain development was documented by estimating the growth trajectories in gray matter and white matter by longitudinal analysis. Characterization of brain development in volume measurement would be the foundation for investigation using different parameters as well as differentiating from atypical brain development due to a neurodevelopmental disease.Acknowledgements
This research was supported by RIKEN Junior Research Associate Program.
This research is partially supported by the program for Brain Mapping by Integrated Neurotechnologies for Disease Studies (Brain/MINDS) from Japan Agency for Medical Research and development, AMED.
References
1. Sasaki E, Suemizu H, Shimada A, et al. Generation of transgenic non-human primates with germline transmission. Nature. 2009;459(7246):523-527. doi:10.1038/nature08090.
2. Hikishima K, Ando K, Yano R, et al. Parkinson Disease: Diffusion MR Imaging to Detect Nigrostriatal Pathway Loss in a Marmoset Model Treated with 1-Methyl-4-phenyl-1,2,3,6-tetrahydropyridine. Radiology. 2015;275(2):430-437. doi:10.1148/radiol.14140601.
3. Liu J V, Hirano Y, Nascimento GC, Stefanovic B, Leopold DA, Silva AC. fMRI in the awake marmoset: Somatosensory-evoked responses, functional connectivity, and comparison with propofol anesthesia. Neuroimage. 2013;78:186-195. doi:10.1016/j.neuroimage.2013.03.038.
4. Belcher AM, Yen CC, Stepp H, et al. Large-Scale Brain Networks in the Awake, Truly Resting Marmoset Monkey. J Neurosci. 2013;33(42):16796-16804. doi:10.1523/jneurosci.3146-13.2013.
5. Hung C-C, Yen CC, Ciuchta JL, et al. Functional Mapping of Face-Selective Regions in the Extrastriate Visual Cortex of the Marmoset. J Neurosci. 2015;35(3):1160-1172. doi:10.1523/JNEUROSCI.2659-14.2015.
6. Belcher AM, Yen CC-C, Notardonato L, et al. Functional Connectivity Hubs and Networks in the Awake Marmoset Brain. Front Integr Neurosci. 2016;10. doi:10.3389/fnint.2016.00009.
7. Hikishima K, Sawada K, Murayama AY, et al. Atlas of the developing brain of the marmoset monkey constructed using magnetic resonance histology. Neuroscience. 2013;230:102-113. doi:10.1016/j.neuroscience.2012.09.053.
8. Sawada K, Hikishima K, Murayama AY, Okano HJ, Sasaki E, Okano H. Fetal sulcation and gyrification in common marmosets (Callithrix jacchus) obtained by ex vivo magnetic resonance imaging. Neuroscience. 2014;257:158-174. doi:10.1016/j.neuroscience.2013.10.067.
9. Schultz-Darken N, Braun KM, Emborg ME. Neurobehavioral development of common marmoset monkeys. Dev Psychobiol. 2016;58(2):141-158. doi:10.1002/dev.21360.
10. Hashikawa T, Nakatomi R, Iriki A. Current models of the marmoset brain. Neurosci Res. 2015;93:116-127. doi:10.1016/j.neures.2015.01.009.
11. Vijayakumar N, Allen NB, Youssef G, et al. Brain development during adolescence: A mixed-longitudinal investigation of cortical thickness, surface area, and volume. Hum Brain Mapp. 2016;37(6):2027-2038. doi:10.1002/hbm.23154. 12. Giedd JN, Blumenthal J, Jeffries NO, et al. Brain development during childhood and adolescence: a longitudinal MRI study. Nat Neurosci. 1999;2(10):861-863.
12. Giedd JN, Blumenthal J, Jeffries NO, et al. Brain development during childhood and adolescence: a longitudinal MRI study. Nat Neurosci. 1999;2(10):861-863. doi:10.1038/13158.
13. Lenroot RK, Gogtay N, Greenstein DK, et al. Sexual dimorphism of brain developmental trajectories during childhood and adolescence. Neuroimage. 2007;36(4):1065-1073. doi:10.1016/j.neuroimage.2007.03.053.
14. Raznahan A, Shaw P, Lalonde F, et al. How Does Your Cortex Grow? J Neurosci. 2011;31(19):7174-7177. doi:10.1523/JNEUROSCI.0054-11.2011.
15. Liu C, Tian X, Liu H, et al. Rhesus monkey brain development during late infancy and the effect of phencyclidine: A longitudinal MRI and DTI study. Neuroimage. 2015;107:65-75. doi:10.1016/j.neuroimage.2014.11.056.
16. Scott J a., Grayson D, Fletcher E, et al. Longitudinal analysis of the developing rhesus monkey brain using magnetic resonance imaging: birth to adulthood. Brain Struct Funct. 2015;221(5):2847-2871. doi:10.1007/s00429-015-1076-x.
17. Malkova L, Heuer E, Saunders RC. Longitudinal magnetic resonance imaging study of rhesus monkey brain development. Eur J Neurosci. 2006;24(11):3204-3212. doi:10.1111/j.1460-9568.2006.05175.x.
18. Zhang J, Miller MI, Plachez C, et al. Mapping postnatal mouse brain development with diffusion tensor microimaging. Neuroimage. 2005;26(4):1042-1051. doi:10.1016/j.neuroimage.2005.03.009.
19. Chuang N, Mori S, Yamamoto A, et al. An MRI-based atlas and database of the developing mouse brain. Neuroimage. 2011;54(1):80-89. doi:10.1016/j.neuroimage.2010.07.043.
20. Lebel C, Beaulieu C. Longitudinal Development of Human Brain Wiring Continues from Childhood into Adulthood. J Neurosci. 2011;31(30):10937-10947. doi:10.1523/JNEUROSCI.5302-10.2011.
21. Aubert-Broche B, Fonov VS, García-Lorenzo D, et al. A new method for structural volume analysis of longitudinal brain MRI data and its application in studying the growth trajectories of anatomical brain structures in childhood. Neuroimage. 2013;82:393-402. doi:10.1016/j.neuroimage.2013.05.065.
Figures