2192
Developmental morphometry of the marmoset brain from infancy to adulthood1Behavioural and Clinical Neuroscience Institute, University of Cambridge, Cambridge, United Kingdom, 2Wolfson Brain Imaging Centre, University of Cambridge, Cambridge, United Kingdom, 3Dept of Physiology, Development and Neuroscience, University of Cambridge, 4Dept of Psychology, University of Cambridge, 5Dept of Psychiatry, University of Cambridge
Synopsis
Understanding the development of brain circuits through infancy to adulthood is crucial in determining the causes of mental health disorders, half of which are established before early adulthood. We use MRI to track the development of >200 discrete brain regions in a longitudinal primate brain study of 41 marmosets. Tensor-based morphometry indicated key regions of myelination from 3-6 months of age, and clustering of growth trajectories fitted with cubic splines allowed parcellation of regions based on growth patterns. We present maps of development showing differing patterns and rates of growth not only across lobes but between primary and associative areas.
Target audience
Neuroscientists and clinicians interested in neurodevelopment in animal models.Purpose
Disorders of mental health affect up to half the population at some point in their lifetime but half of these will already be established by age 14, rising to 75% by age 241: strongly suggestive of a developmental component. The detailed cause of most mental health disorders remains elusive but it is likely to be related to disruption of brain circuits underlying attention, decision making, mood and emotion. Understanding the development of these circuits will be pivotal in creating the sophisticated interventions required to address the burden these disorders place on individuals, their families and society. The marmoset, Callithrix jacchus, is a small primate with a compact lifespan (10-15 years) for studying all stages of development. Here, we use MRI to track the growth of each cortical brain region and use this to parcellate cortical and subcortical regions by their growth rate patterns. These data are crucial for planning studies targeting the developmental processes underlying mental dysfunction.Methods
41 marmosets were scanned in 141 sessions, with the youngest
animals scanned at 3 months of age. A 4.7T Bruker Pharmascan 47/16 system was
used with an in-house built quadrature transmit-receive coil. Anaesthesia was induced and maintained with
isoflurane (1-3% in 0.25-0.4l/min O2) after sedation with ketamine (20mg/kg).
A RARE sequence was used for imaging (TR/TEeff 11750m/24ms; 3 NEX,
125 slices of 250µm, FOV 64mm×50mm, final resolution 250 µm).
Structural images were aligned and registered using SPM8
(UCL, UK) with the SPMMouse toolbox2 to produce tissue class maps for grey matter, white matter and cerebrospinal
fluid. DARTEL was used for high-resolution warping3 to create templates at each age point. Tensor-based morphometry was used to
highlight the most significant volume changes from 3-6 months. A cortical atlas
of the marmoset brain based on histological sections4 was adapted to the MRI data and inverse-transformed to each scan to provide
measurements at each time point. Additional subcortical regions were added by
an expert with reference to a standard atlas.
Cubic splines were fitted to the growth curves
in an additive mixed model exploiting the repeated-measures design. These
curves were clustered based on their normalised shape using a k-means approach
trialling from 5-10 clusters. Six clusters were found to be optimal based on
minimal within-to-between cluster distance ratio (Matlab R2016, Mathworks,
Inc.).
Results
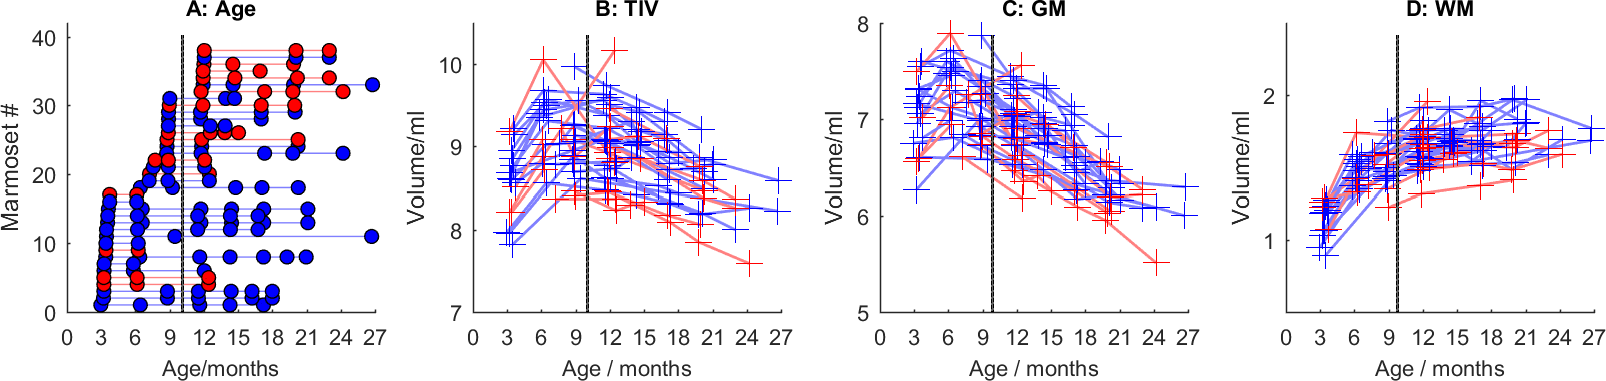
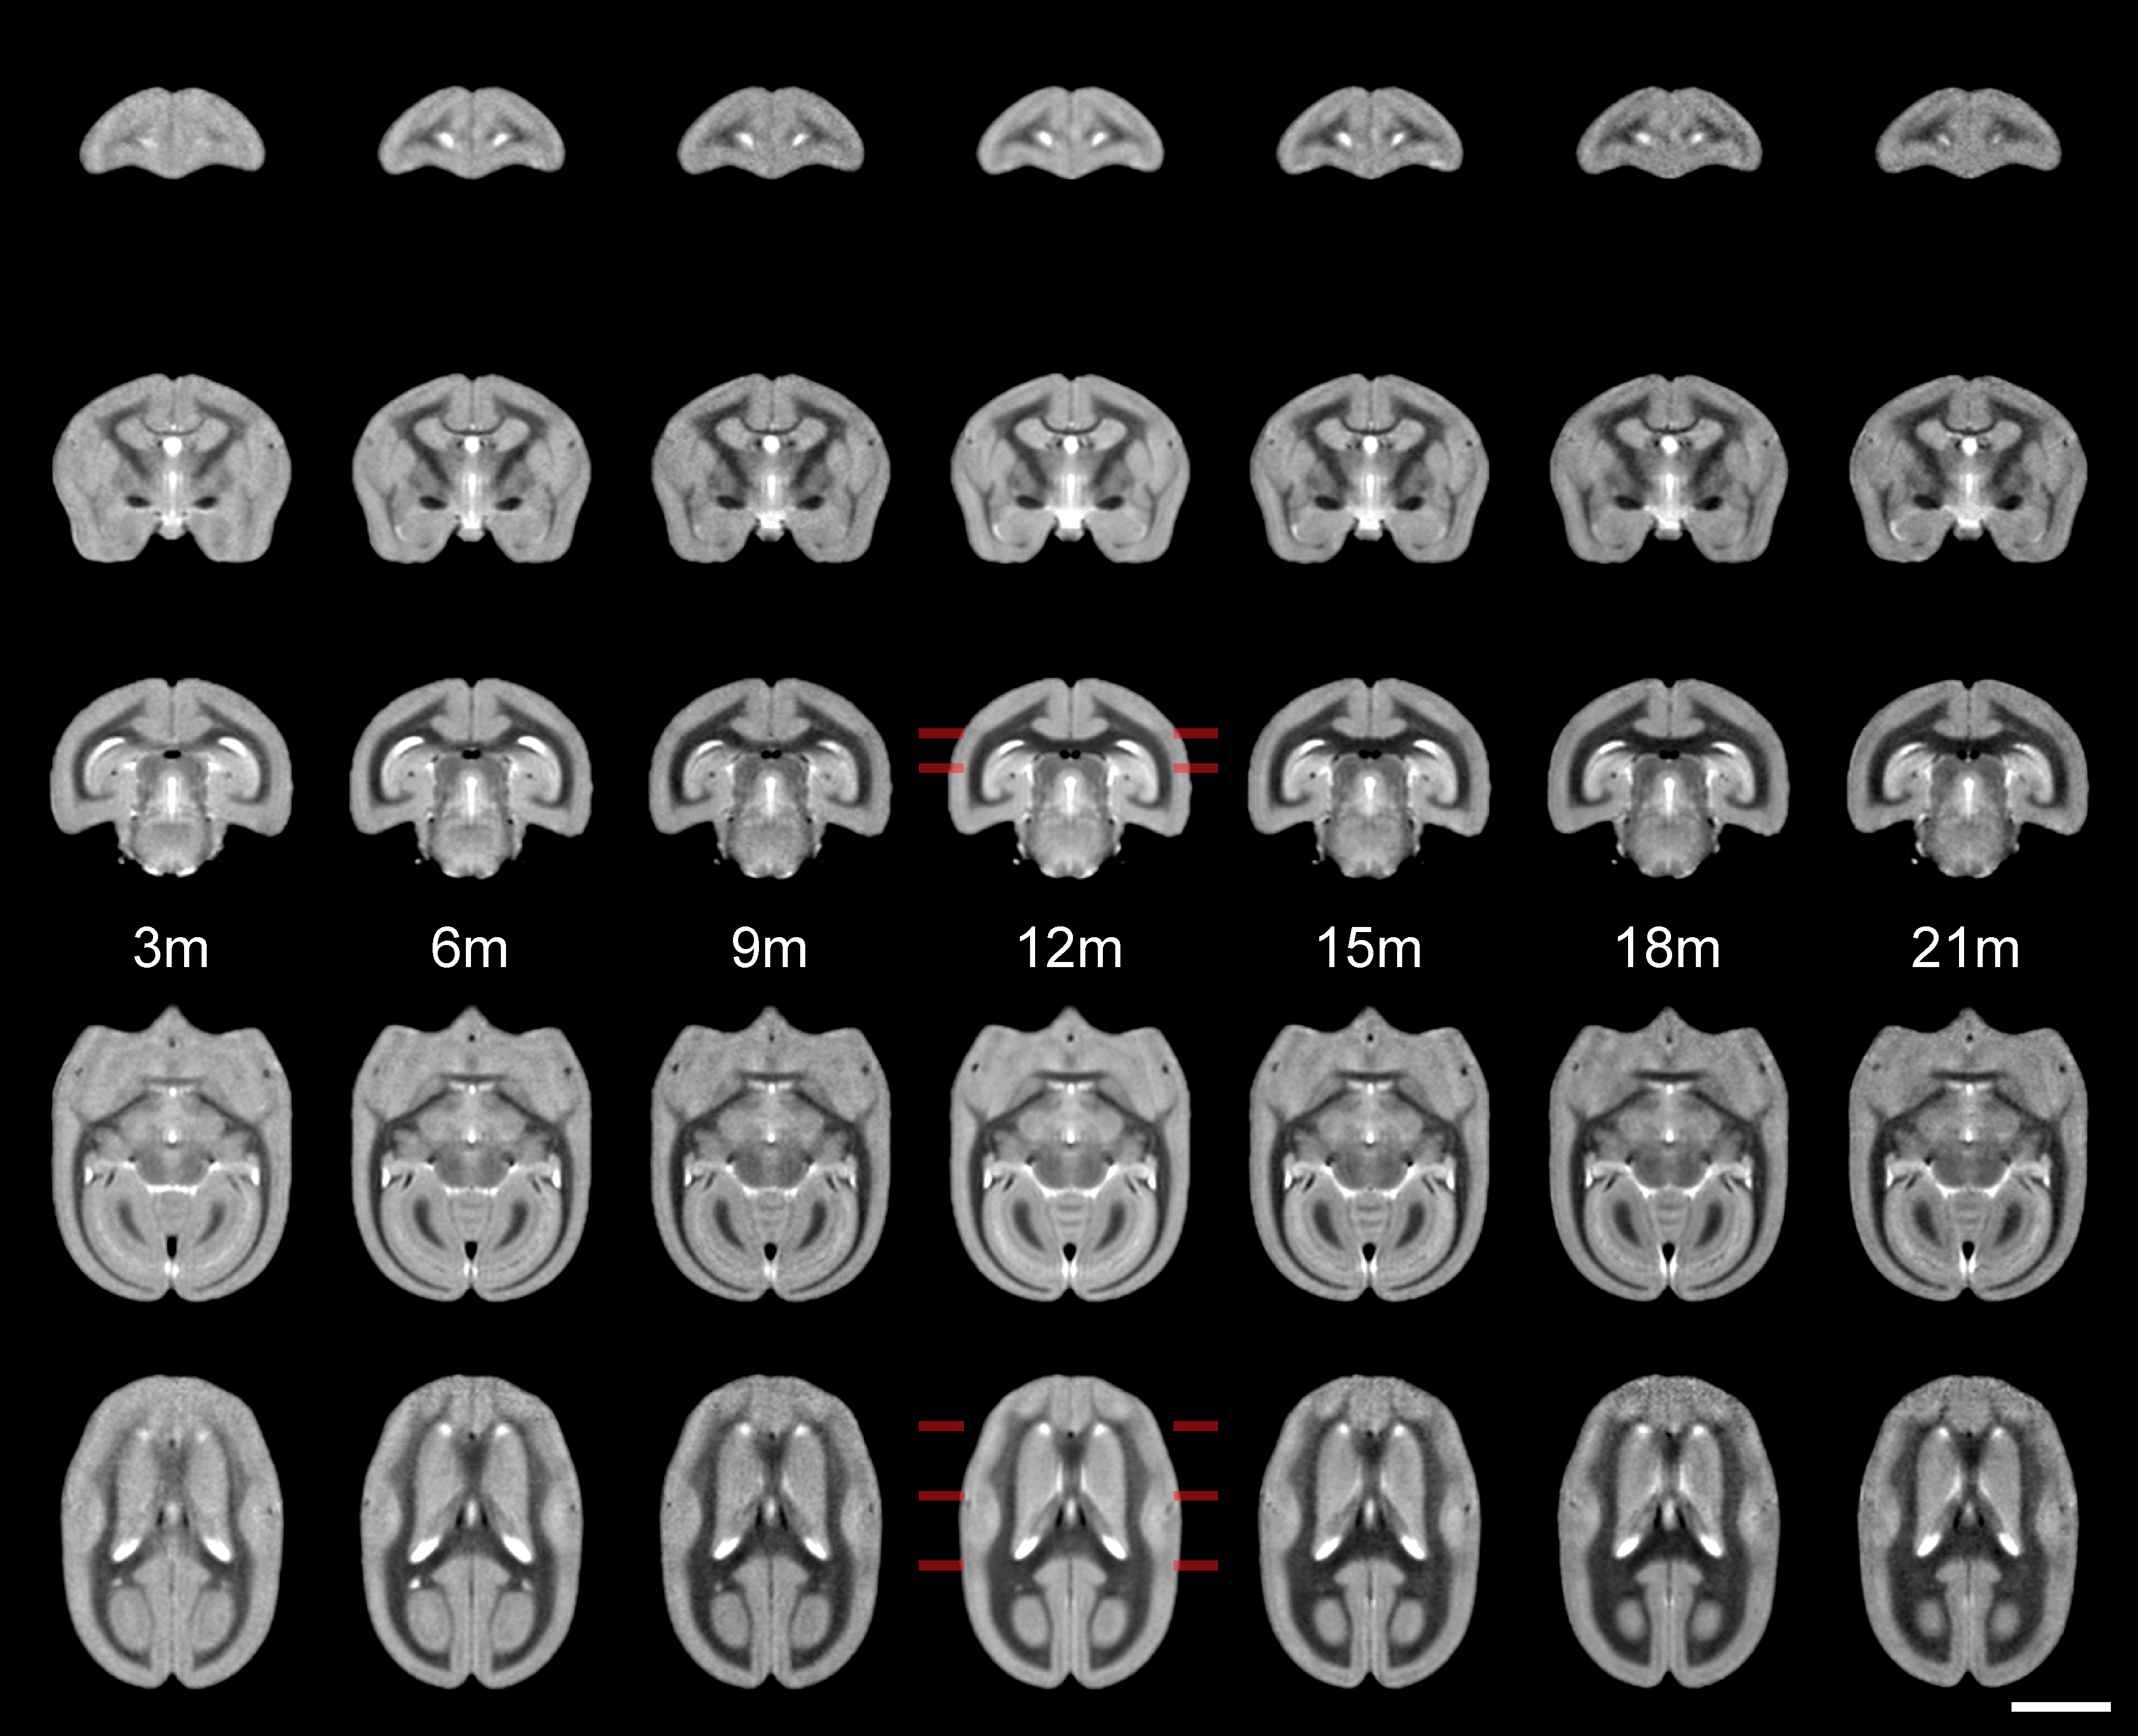
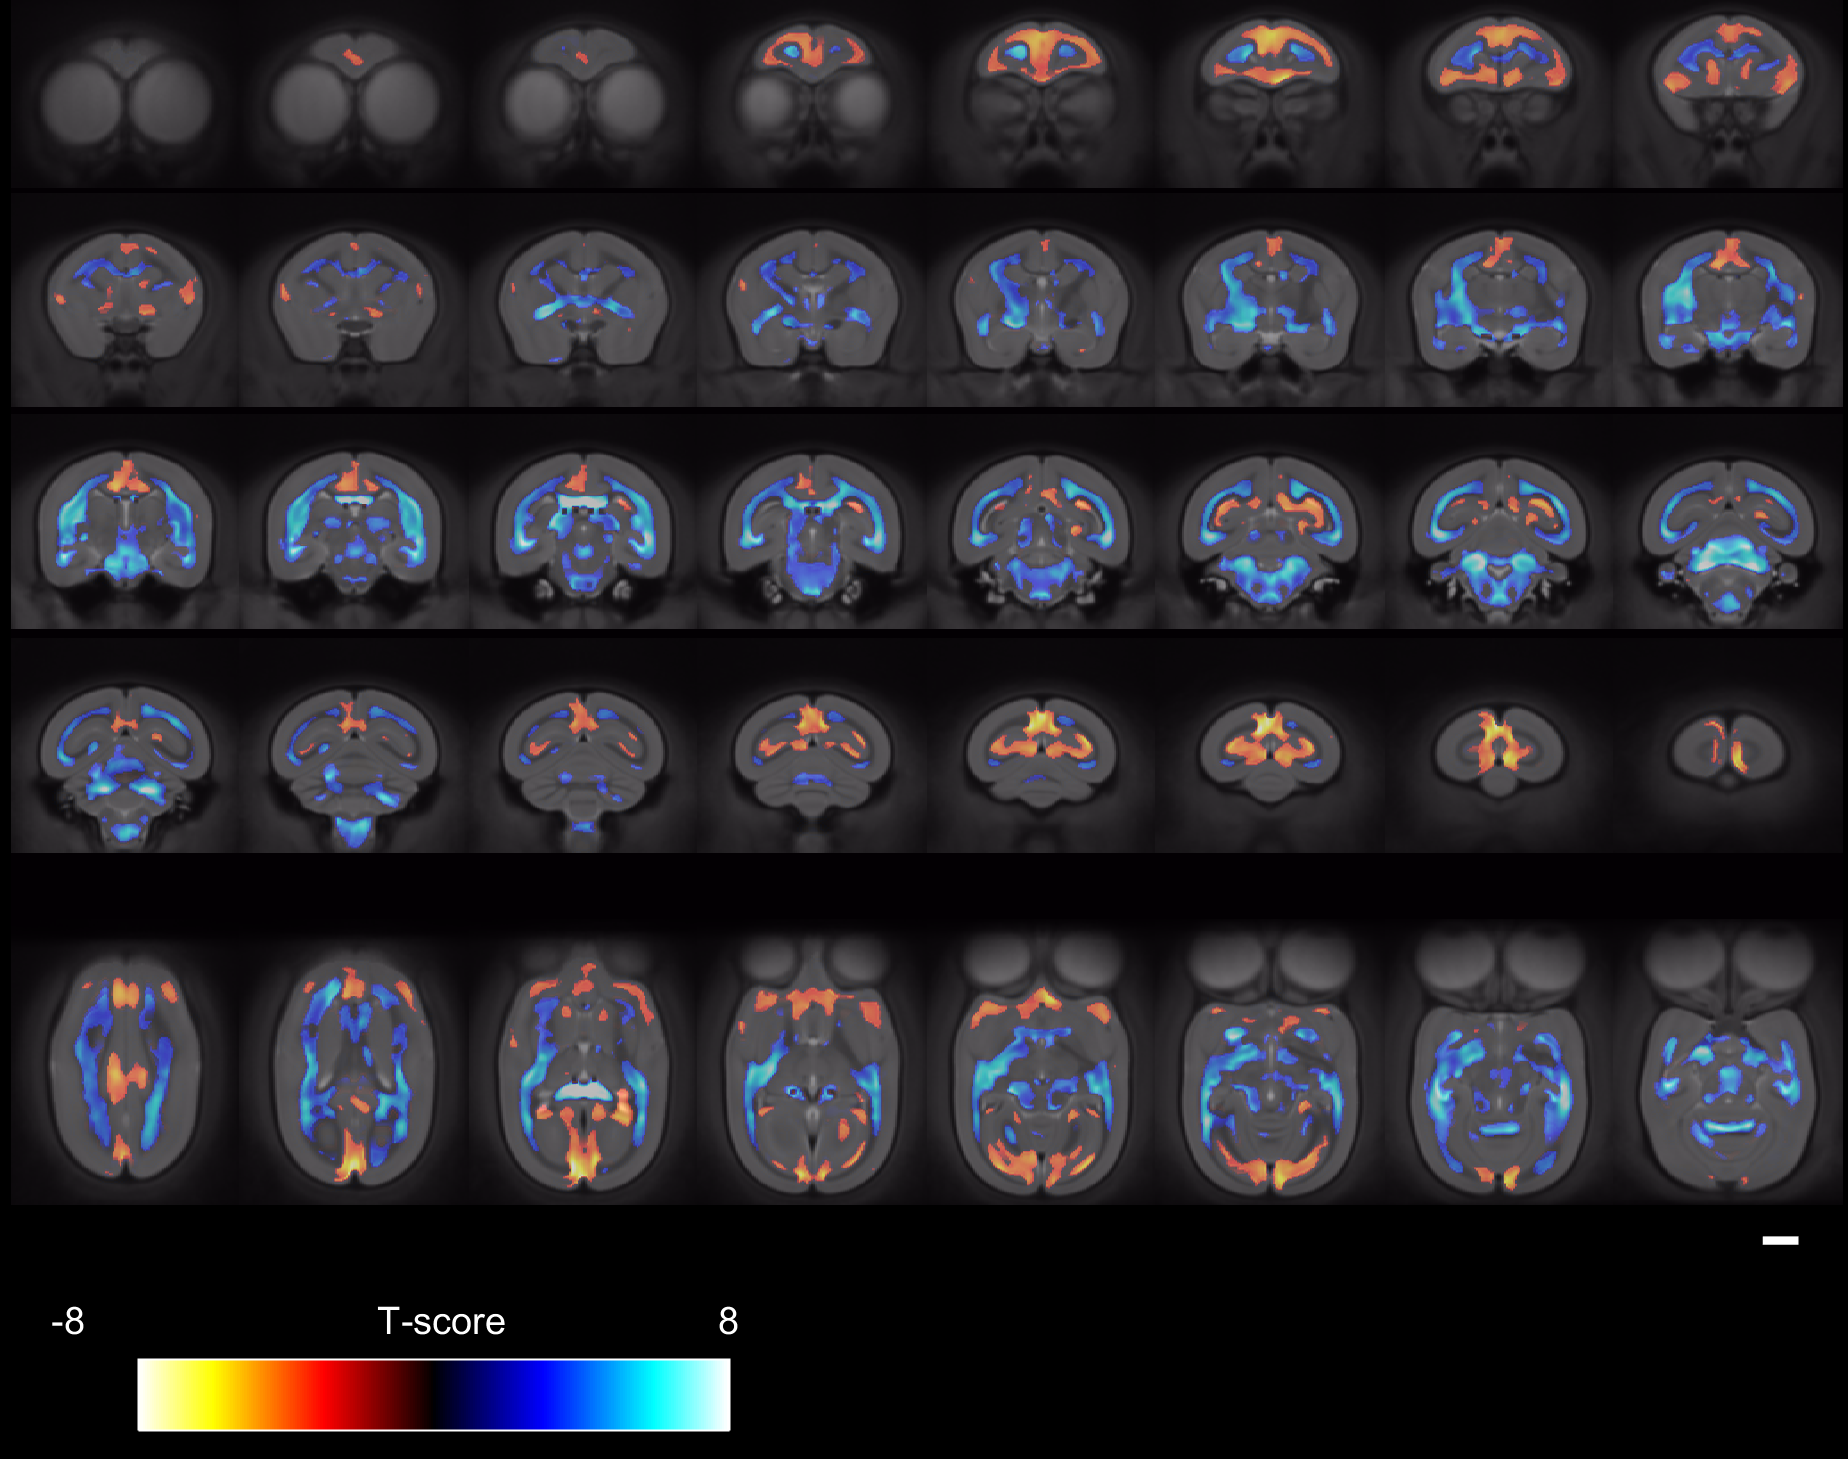
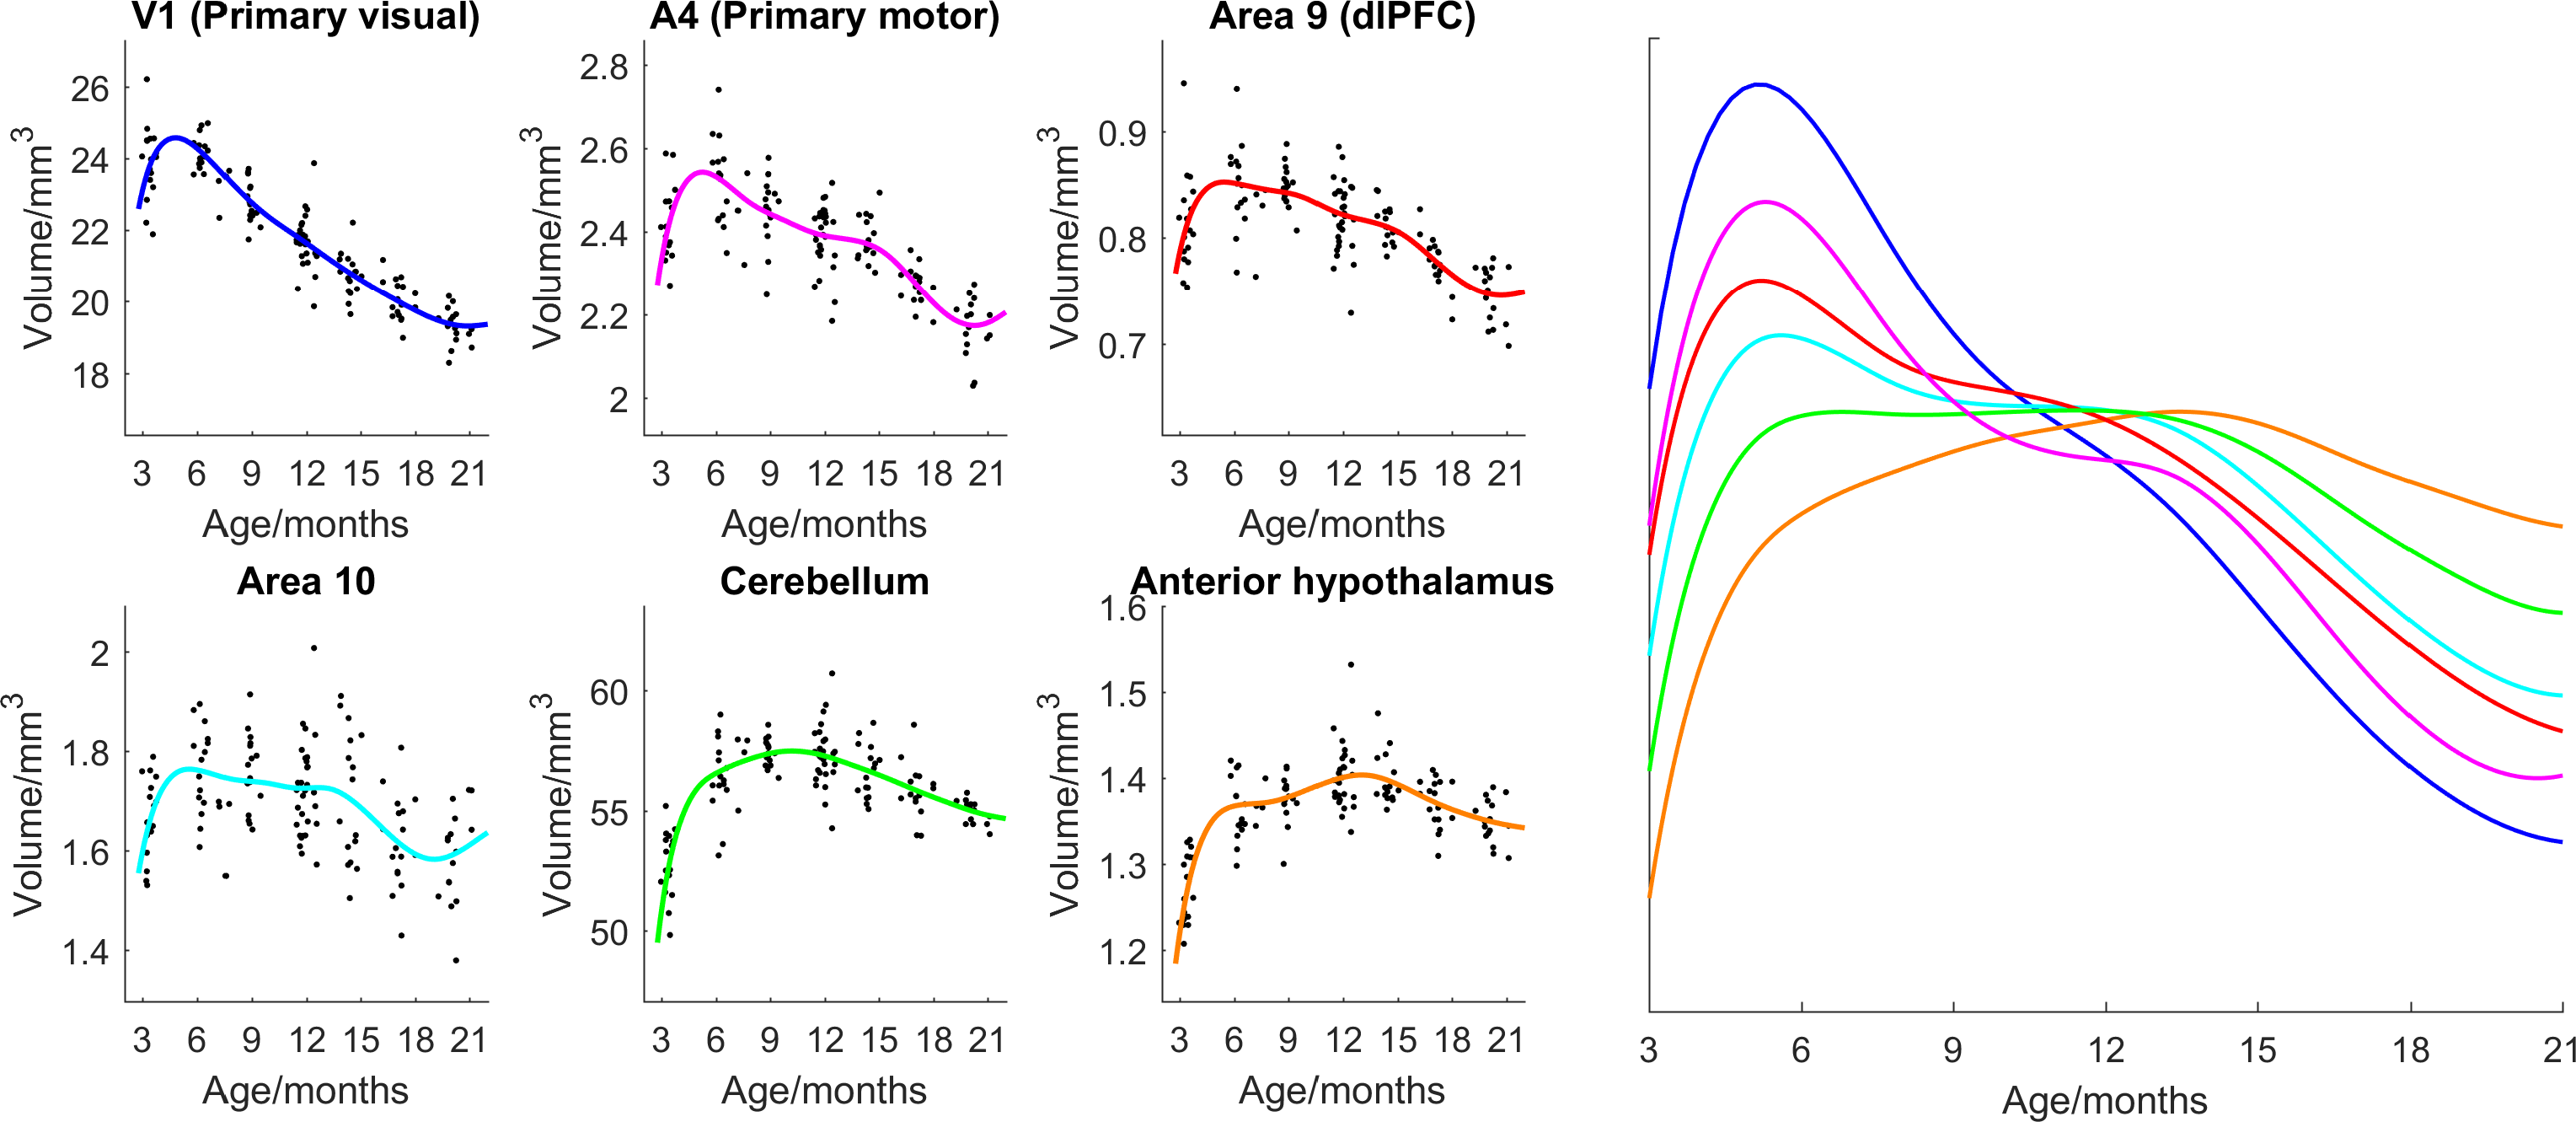
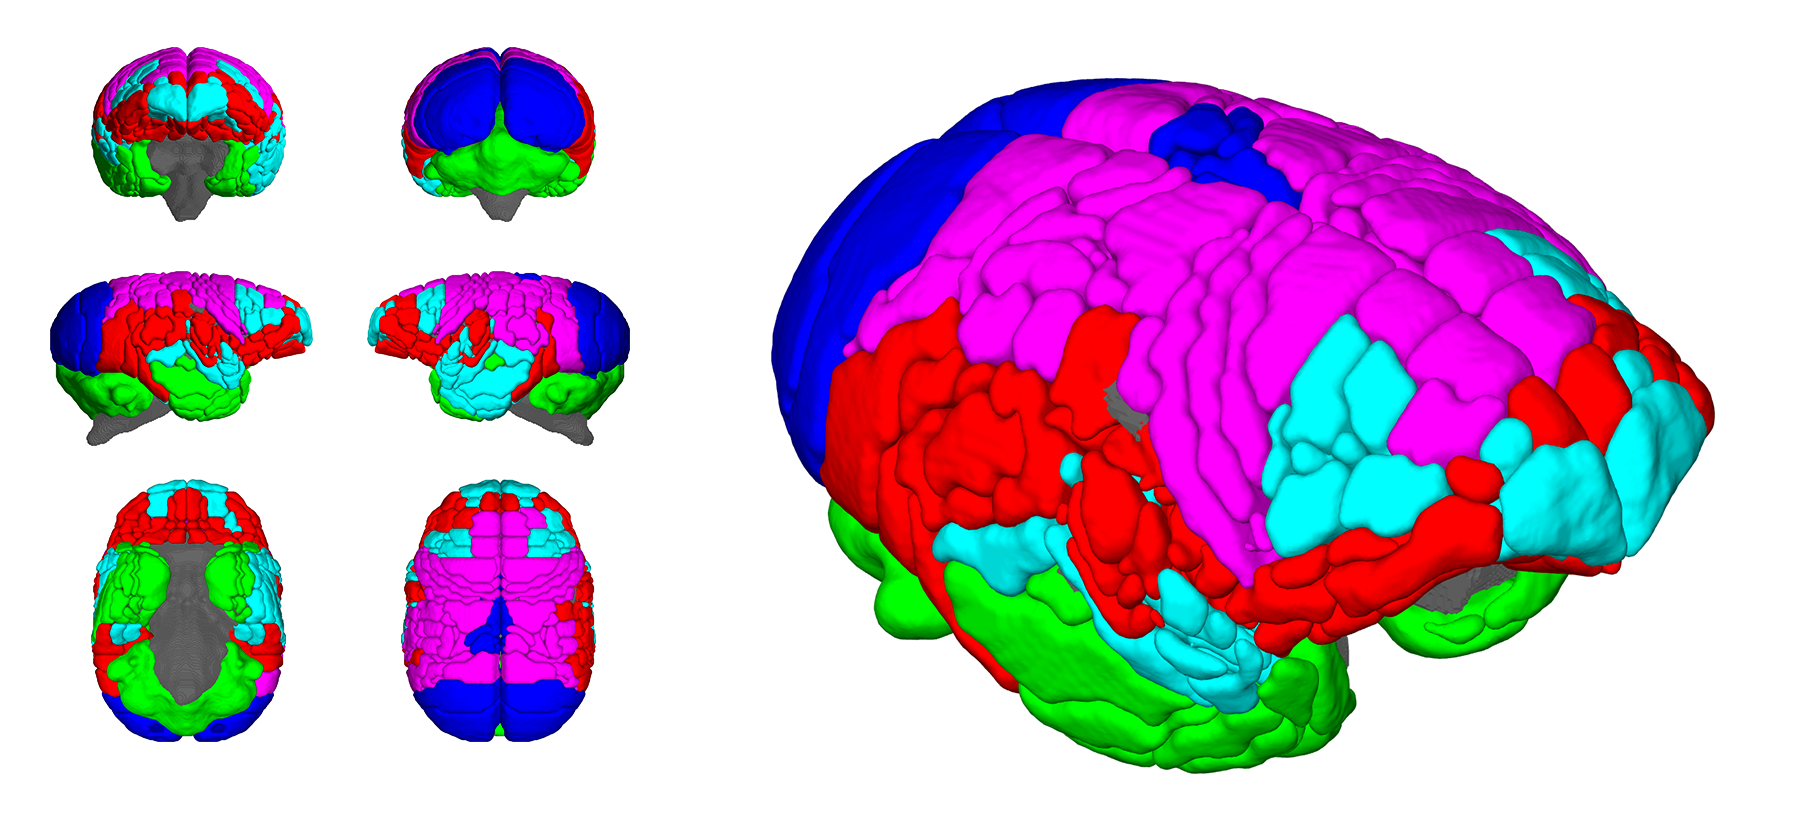
Figure 1 shows the ages of the marmosets scanned alongside total intracranial, grey matter and white matter volumes with the onset of puberty marked. Templates at each age point are shown in Figure 2. Gross WM changes can be seen clearly, as tracts thicken, with decreased signal, over time. TBM results, in Figure 3, highlight in particular striking changes in WM tracts. Although the brain as a whole is still growing in this period, the differences of Figure 3 cannot be explained by overall brain volume. Regional growth trajectories of the six clusters are shown with typical regions in Figure 4. The parcellated cortex is shown in Figure 5.Discussion
Previous reports have examined pre-natal marmoset brain development5 and early behavioural development6 but this study gives the first account of regional growth profiles of detailed brain regions and parcellation of the cortex based on regional development. No studies have been published at this level of detail from birth to adulthood to date in any primate brain, including humans.
Growth curves for each brain region are presented for the marmoset throughout infancy and adolescence showing a marked volume change from 3 to 6 months that continues at differential rates across brain regions. Gross changes in myelination are visible in the images and shown in the TBM results, suggesting that variation in the onset time and rate of myelination is likely to be the largest factor differentiating the cortical regions seen. Relative to primary cortical areas, association areas show a protracted shrinkage throughout adolescence which is compatible with their known role in psychiatric disorders presenting at homologous ages in patients. In sum, these findings provide an atlas of structural growth with milestones of development that we will now use to design functional studies to identify changing patterns of activity occurring as the brain matures.
Acknowledgements
Grant support: Wellcome Trust Investigator award (108089/Z/15/Z) (ACR). The Behavioural and Clinical Neuroscience Institute is supported jointly by the Wellcome Trust and Medical Research Council. ETB is employed 50% by GlaxoSmithKline (GSK) and holds stock in GSK.References
1. Kessler, R.C., et al., Lifetime prevalence and age-of-onset distributions of DSM-IV disorders in the National Comorbidity Survey Replication. Arch Gen Psychiatry, 2005. 62(6): p. 593-602.
2. Sawiak, S.J., et al., Voxel-based morphometry with templates and validation in a mouse model of Huntington's disease. Magn Reson Imaging, 2013. 31(9): p. 1522-31.
3. Ashburner, J., A fast diffeomorphic image registration algorithm. Neuroimage, 2007. 38(1): p. 95-113.
4. Majka, P., et al., Towards a comprehensive atlas of cortical connections in a primate brain: Mapping tracer injection studies of the common marmoset into a reference digital template. J Comp Neurol, 2016. 524(11): p. 2161-81.
5. Hikishima, K., et al., Atlas of the developing brain of the marmoset monkey constructed using magnetic resonance histology. Neuroscience, 2013. 230: p. 102-13.
6. Schultz-Darken, N., K.M. Braun, and M.E. Emborg, Neurobehavioral development of common marmoset monkeys. Dev Psychobiol, 2016. 58(2): p. 141-58.
Figures