2191
Longitudinal Analysis of Rhesus Monkey Brain Development Using Tensor-Based Structural Morphometry1Radiology Informatics and Image Processing Laboratory, Wake Forest School of Medicine, Winston Salem, NC, United States, 2Department of Radiology, Wake Forest School of Medicine, Winston Salem, NC, United States, 3Department of Biomedical Engineering, Wake Forest School of Medicine, Winston Salem, NC, United States, 4Clinical and Translational Sciences Institute, Wake Forest School of Medicine, Winston Salem, NC, United States
Synopsis
Translational research models using brain MRI to study non-human primates (NHPs) can provide insight into normal/abnormal human neurodevelopment. In particular, voxel-wise longitudinal imaging designs can characterize the trajectory of change in brain structure among individual subjects. This study analyzes morphometric changes among a cohort of rhesus monkeys during late infancy, revealing total brain volume decreases driven by local volumetric contraction in frontal, parietal and temporal lobes. Characterizing NHP neurodevelopment may facilitate our understanding of complex normal and delayed human brain development, and provide a model to evaluate the influence of postnatal experiences on brain structure, cognitive ability and social behaviors.
Purpose
This study analyzes the trajectory of developmental change among a cohort of rhesus monkeys using longitudinal structural MRI and its tensor-based morphometry. We focus on structural mechanisms of total brain volume (TBV) decrease between months 6 and 10 after birth.Methods
Longitudinal brain MRI data acquired from a cohort of normally developing rhesus monkeys were downloaded from a freely available database (UNC-Wisconsin Neurodevelopmental Rhesus Data at https://data.kitware.com). For longitudinal analyses, twenty-eight NHPs (12 Female) scanned at least three times between the age of 5 and 22 months were selected for analyses. Preprocessing steps included file conversion to NIFTI format, anterior commissure-posterior commissure alignment, non-local mean denosing1, N3 bias correction and manual skull stripping. Within-subject registration was performed across the data acquisition time points using Advanced Normalization Tools (ANTs)’s SyN nonlinear registration algorithm2. Based on the deformation field between a pair of images, the voxel-wise volume change ratio (Jacobian Determinant, JD) was derived using an in-house tensor-based morphometry algorithm. For statistical analyses, age-specific templates derived from 14 rhesus monkeys between the age of 6 and 12 months were used3. A linear mixture effects model was then applied to investigate the effects of age and sex on the trajectory of brain developmental change. Finally, to identity brain regions that drive TBV decreases between months 6 and 10, the volumetric growth rate was defined as: 100x(JD-1.0)/scan interval in days.Results
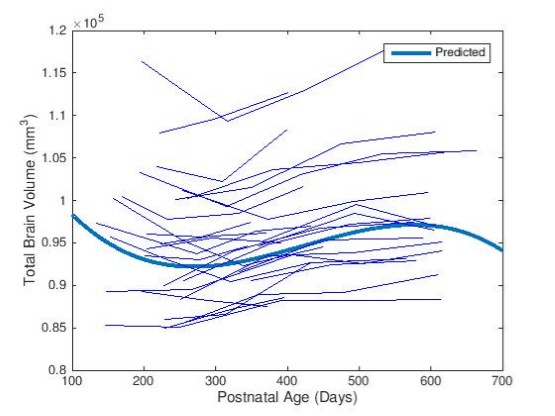
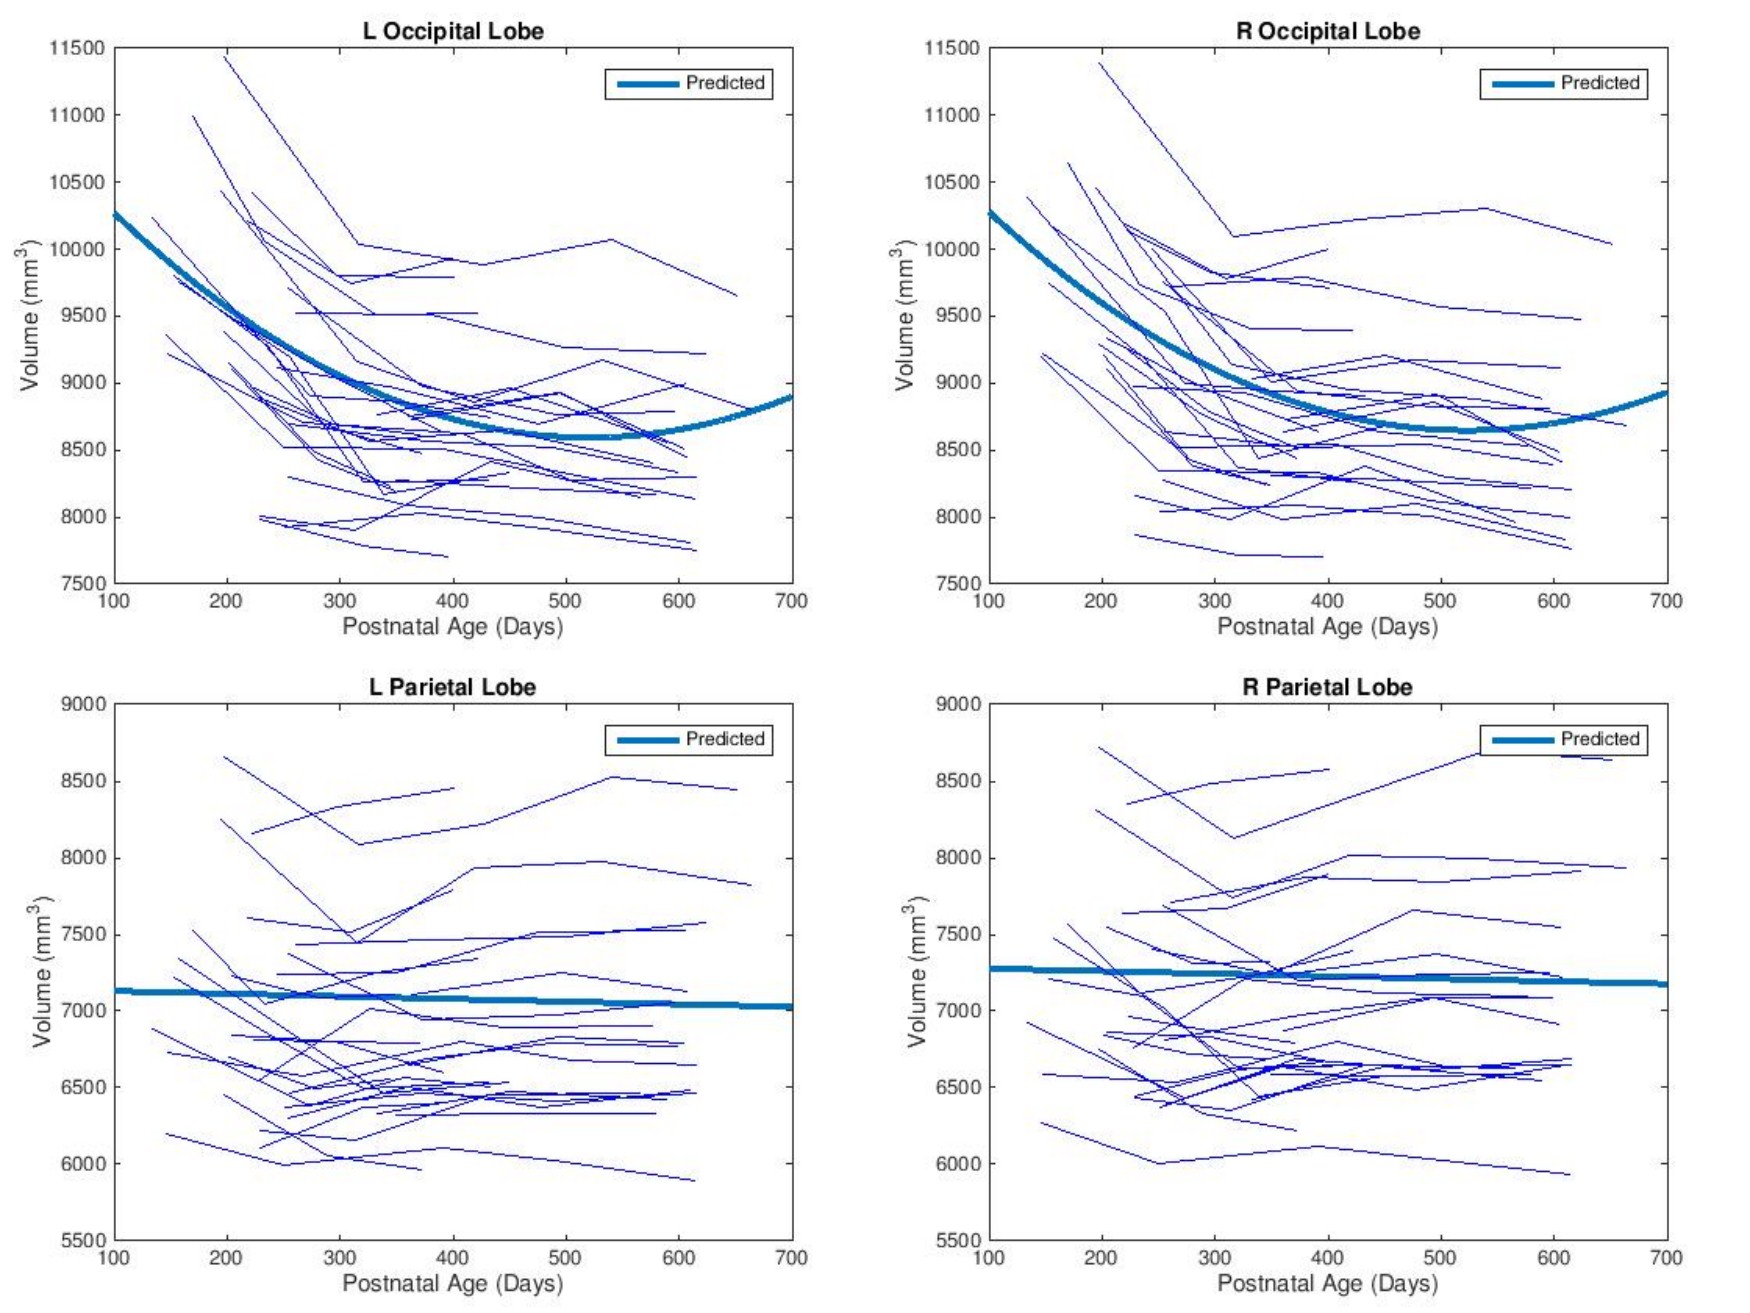
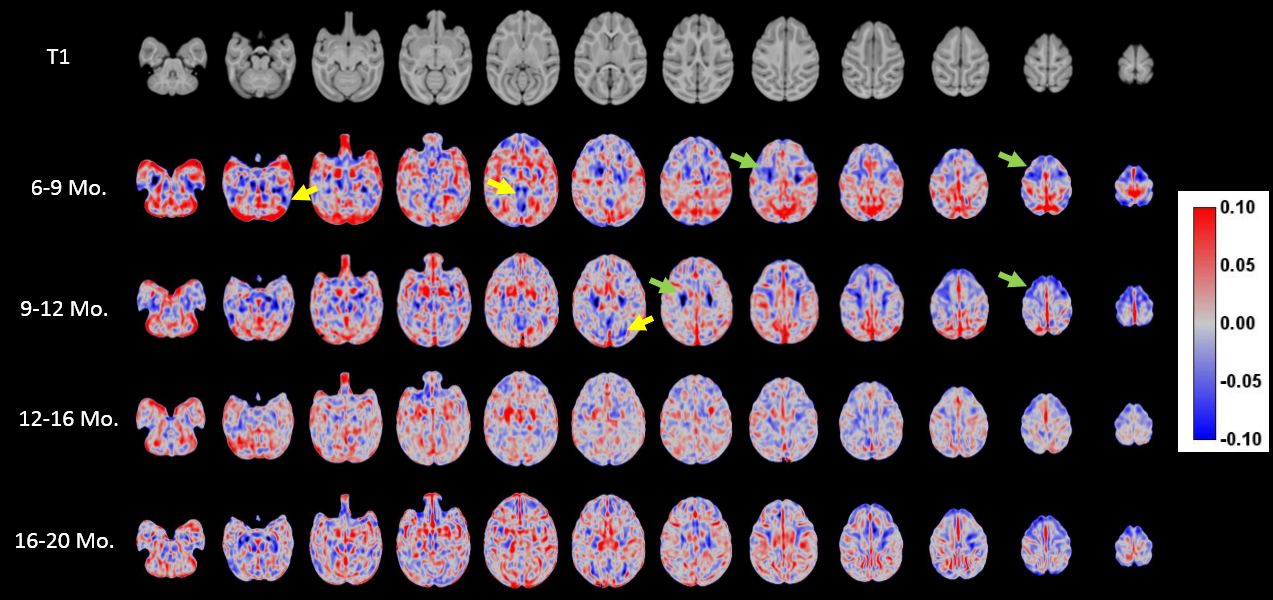
As shown in Fig. 1, slight decreases in TBV were observed between months 6 and 10, with third order polynomial demonstrating a better goodness of fit compared to a linear model. Volumetric region-of-interest (ROI) analyses revealed decreases in occipital and parental lobes during this time period (Fig. 2). While occipital lobes continued to decease in volume after 12 months, the parietal lobe demonstrated slight volumetric decreases during this period. Voxel-wise analysis results (Fig. 3) demonstrate that some frontal, parietal and occipital areas contribute to TBV decreases between months 6 and 10. Linear mixed effect model analysis also revealed a strong effect of age, but not sex, on volumetric brain changes during the study period.Discussion
Volumetric decreases associated with brain maturation have been reported for dorso-lateral prefrontal cortex among humans during puberty4, and similar mechanisms may be involved in volumetric decreases that have been previously described in the setting of early brain maturation among this cohort of NHPs at birth and during infancy5. Our study extends these previous findings by identifying structural mechanisms for these TBV decrease using ROI-based volumetric analysis and voxel-based morphometry to characterize the trajectory of developmental change during this time period.Conclusion
Longitudinal MRI analyses of brain structure revealed patterns of quantitative volumetric changes in the trajectory of brain development during late infancy. Total brain volume decreases during late infancy that have been previously described in rhesus monkey are likely due to local volumetric contractions of some regions in the frontal, parietal and occipital lobes, which appear to be best modeled by non-linear polynomials.Acknowledgements
No acknowledgement found.References
1. Tristan-Vega A, Garcia-Perez V, Aja-Fernandez S, Westin CF. Efficient and robust nonlocal means denoising of MR data based on salient features matching. Comput Methods Programs Biomed. 2012;105(2):131-44.
2. Avants B, Gee JC. Geodesic estimation for large deformation anatomical shape averaging and interpolation. Neuroimage. 2004;23 Suppl 1:S139-50.
3. Liu C, Tian X, Liu H, Mo Y, Bai F, Zhao X, et al. Rhesus monkey brain development during late infancy and the effect of phencyclidine: a longitudinal MRI and DTI study. Neuroimage. 2015;107:65-75.
4. Scott JA, Grayson D, Fletcher E, Lee A, Bauman MD, Schumann CM, et al. Longitudinal analysis of the developing rhesus monkey brain using magnetic resonance imaging: birth to adulthood. Brain Struct Funct. 2016;221(5):2847-71.
5. Gogtay N, Giedd JN, Lusk L, Hayashi KM, Greenstein D, Vaituzis AC, et al. Dynamic mapping of human cortical development during childhood through early adulthood. Proc Natl Acad Sci U S A. 2004;101(21):8174-9.
Figures