2188
Anatomical and diffusion MRI fetal brain templates for the rhesus macaque at gestation days 85, 110, and 1351Advanced Imaging Research Center, OHSU, Portland, OR, United States, 2Pediatrics, Bioengineering, and Radiology, University of Washington
Synopsis
In utero T2-weighted (T2W) and diffusion MR images were acquired from control rhesus macaque fetuses at gestation days 85, 110, and 135. High-resolution T2W volumes and diffusion MR volumes were reconstructed using retrospective motion-correction techniques. Population-averaged T2W templates and fractional anisotropy (FA) templates were generated for each time point. Development of fetal tissue zones and gyrification of cerebral cortex were assessed using the T2W templates. In addition, morphogenesis of cortical neurons and maturation of white matter tracts were also characterized using the FA templates.
Purpose
Converging evidence shows that deficits found in many neurodevelopmental disorders, characterized by abnormal brain maturation, originate prenatally1. Non-human primates serve as crucial animal models for studying neurodevelopmental disorders due to their highly convoluted cerebral cortex, complex cognitive functions, as well as the relative timing of birth compared to central nervous system development is similar to that of humans. Recent motion-correction reconstruction techniques have made possible high resolution in utero diffusion MR imaging. Constructing templates from anatomical and diffusion MR images of the rhesus brain at multiple gestational stages is of importance for characterizing the normal growth trajectory as well as deviations from normal growth in the context of experimental models of neurodevelopmental disorders.Methods
As previously described2, in utero T2-weighted (T2W) and diffusion MR images were acquired from control rhesus macaque fetuses using a Siemens 3T Tim Trio system. A total of 20 fetuses were used to generate brain templates reported in this study. Seventeen fetuses were scanned at gestation day (G) 83-87 (G85 group), 8 fetuses were scanned at G110-111 (G110 group), and 16 fetuses were scanned at G133-137 (G135 group). T2W images and FA maps were reconstructed at isotropic resolutions of 0.5 mm and 0.75 mm, respectively, for each of the studies3. At each age, an unbiased T2W brain template was constructed from individual skull-stripped T2W volume using registration methods from ANTS toolbox4. First, the individual T2W volume was aligned to a standard space using rigid-body registration and the average of aligned volumes was used as the initial reference. Second, an iterative process was performed in which individual T2W volumes were aligned to the reference using non-linear registration and the reference was replaced by the average of the latest obtained aligned volumes. Once the iterative registration procedure converged5, the average T2W volume was considered as the final template. For FA template construction, each individual's b0 volume was first registered to its T2W volume, and then using the registration parameters for the T2W image to the T2W template, each individual FA map was warped to T2W template space. FA templates were then obtained by averaging the aligned FA maps for each age. Cortical surfaces were generated from manual segmentations of each of the three T2W templates using CARET.Results
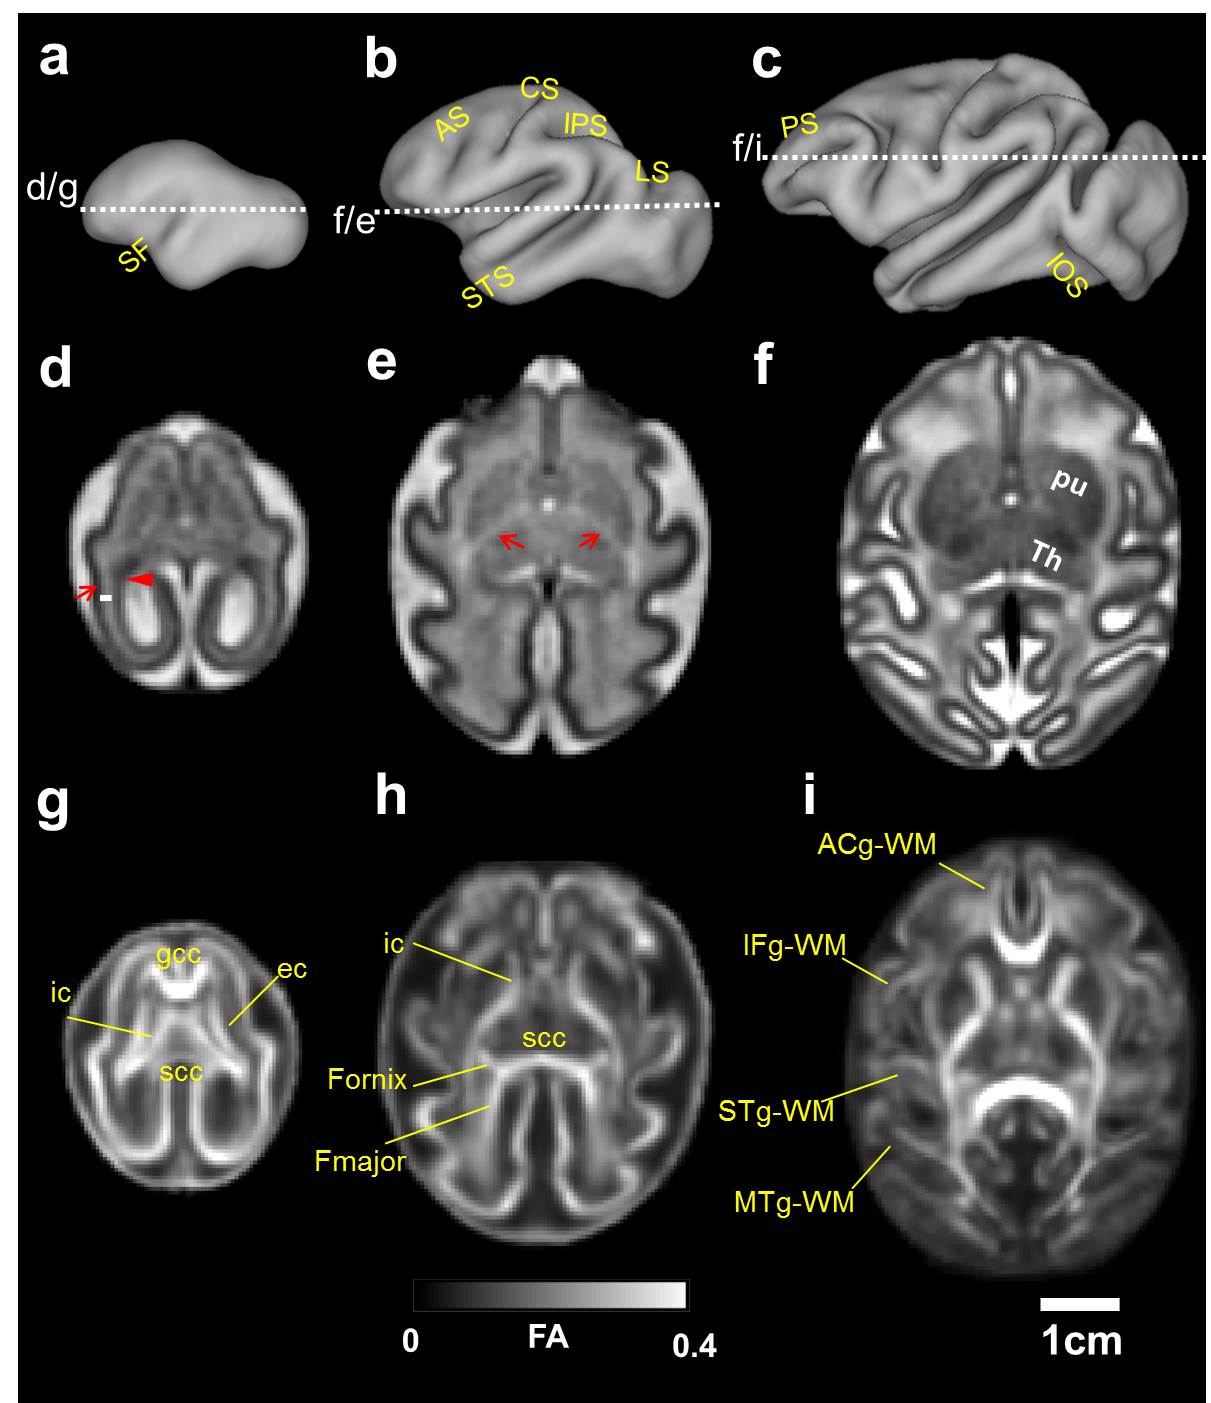
Cerebral cortical folding occurs between G85 and G135. At G85, the sylvian fissure (SF) is relatively shallow and the superior-temporal sulcus (STS) appears as a faint groove (Fig. 1a). By G110, major sulci including the arcuate sulcus (AS), central sulcus (CS), intraparietal sulcus (IPS), and lunate sulcus have appeared (Fig. 1b). Additionally, the principle sulcus (PS) and inferior-occipital sulcus (IOS) begin to emerge. At G135, the existing sulci have deepened and secondary sulci emerge. The cerebral cortical surface has an adult appearance (Fig. 1c). As seen from the G85 T2W image template, three lamina are apparent in the caudal telencephalon, termed the germinal matrix (Fig.1d, triangle), subplate (Fig. 1d, white bar), and cortical plate (Fig. 1c, arrow). At G110, the germinal matrix is no longer apparent in the T2W template. At places where fetal white matter tracts start to form, image hyper-intensity can be observed on the G110 T2W template (Fig. 1e, red arrows). At G135, the contrast between the subplate and fetal white matter, and sub-cortical gray matter nuclei has sharpened, and deep nuclei structures such as putamen (pu) and thalamus (Th) can be observed (Fig. 1f). The dramatic changes in gross anatomy are accompanied by changes occurring at the cellular level, characterized by changes in water fractional anisotropy within the brain. At G85, FA is relatively high and homogeneous throughout the cerebral cortex (Fig. 1g). Significant WM FA is observable in the corpus callosum (cc), external (ec) and internal capsule (ic) (Fig. 1g). At G110, cortical FA decreases compared to that of G85. Cortical FA is low around the SF and increases rostrally and caudally (Fig .1h). WM continues to mature, for example, the fornix appears and forceps major (Fmajor) tract extents towards the occipital lobe at G110 (Fig. 1h). At G135, FA is low across the cortex. In contrast, FA increases within commissural and projection WM tracts. Short range WM tracts, such as anterior cingulum WM (ACg-WM), inferior frontal gyrus WM (IFg-WM), superior temporal gyrus WM (STg-WM), and middle temporal gyrus WM (MTg-WM), start to gain diffusion anisoptropy (Fig. 1i).Conclusions
Development of fetal tissue zones and gyrification of cerebral cortex can be characterized from the T2W templates. In addition, morphogenesis of cortical neurons and maturation of WM tracts can also be inferred from the FA templates.Acknowledgements
This study was surpported by NIH/NIAAA grant R01 AA021981, a grant from a grant from the Bill & Melinda Gates Foundation, and grant P51OD011092References
1. Ernst, C. Trends Neurosci., 2016; 39(5):290-299.
2. Wang et al., Front Neuroanat. 2015;9:147
3. Fogtmann et al., IEEE Trans Med Imaging. 2014;33(2):272-289
4. Avants et al., Med. Image Anl. 2008; 12(1):26-41
5. Guimond et al., COMPUT VIS IMAGE UND. 2000; 77(1):192-210
Figures