2187
Effects of first-trimester alcohol exposure on fetal brain development characterized by in utero diffusion MR1Advanced Imaging Research Center, OHSU, Portland, OR, United States, 2Pediatrics, Bioengineering, and Radiology, University of Washington, 3Division of Neuroscience, Oregon National Primate Research Center
Synopsis
To assess the impact of first-trimester ethanol consumption on rhesus macaque fetal brain development, we employed anatomical and diffusion MRI to characterize macroscopic as well as cellular-level changes in ethanol exposed fetuses relative to controls at gestation days (G) 110 and G135. At both time points, perturbed brain maturation indicated by decreased brain volume, cortical surface area, and folding was seen in the ethanol exposed group. In addition, a trend for higher cortical water diffusion anisotropy seen in ethanol exposed group at G110 indicates abnormal dendritic differentiation.
Purpose
Alcohol consumption in pregnancy can interfere profoundly with fetal development1. To assess chronic effects of first-trimester drinking on the nonhuman primate fetal brain development, we employed anatomical and diffusion MRI to characterize macroscopic as well as cellular-level changes in ethanol exposed fetuses relative to controls.Methods
A cohort of 12 pregnant rhesus macaques were divided into ethanol exposed (n=6) and control (n=6) groups. Animals were trained to self-administer either 1.5g/kg/day of 4% ethanol (ethanol exposed group) or an isocaloric control fluid (control group) through gestation day (G) 60. At G110 and G135, 3 ethanol exposed and 3 control monkeys underwent anatomical and diffusion MRI examination using a Siemens 3T Tim Trio system following previously published procedures2. T2-weighted (T2W) volumes and fractional anisotropy (FA) maps were reconstructed at 0.5 mm3 and 0.75 mm3 isotropic resolution respectively using retrospective motion corrected methods3. Fetal brains were manually segmented from reconstructed volumes and cortical surfaces were generated from these brain segmentations using CARET software. Cortical surface area and curvature were also computed from cortical surfaces. A size-independent metric K*, was then computed by normalizing the amplitude of cortical surface curvature to its characteristic length4. Cortical FA was mapped onto cortical surfaces using customized MATLAB functions.Results
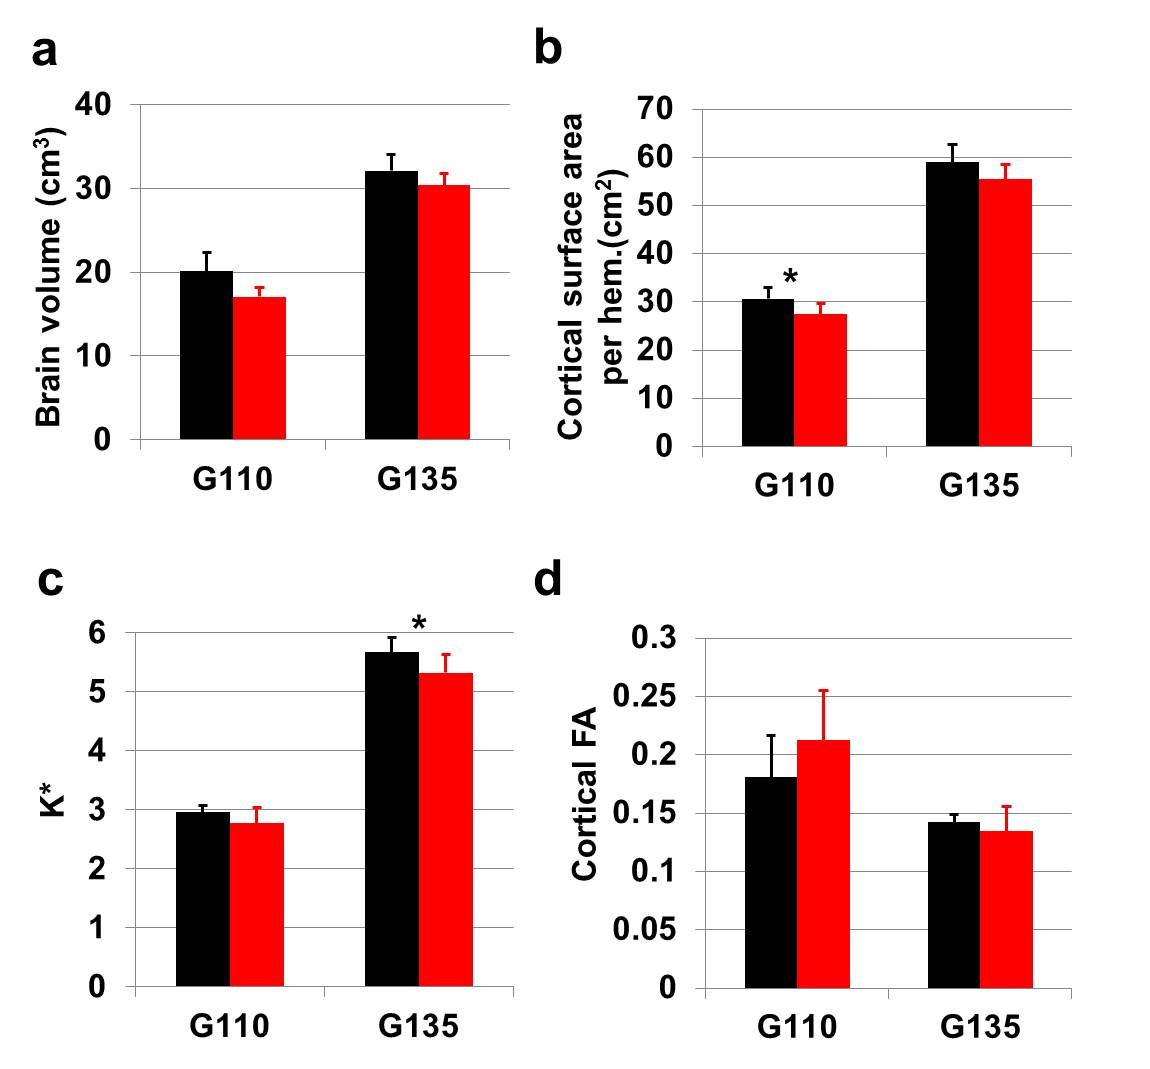
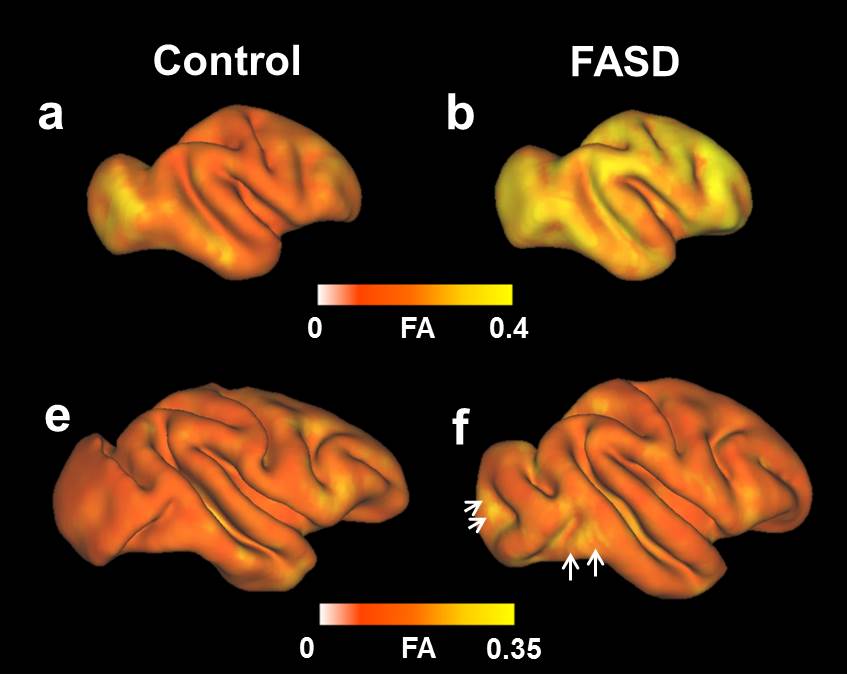
At G110, although mean fetal brain volume (Fig. 1a) and mean K* (Fig. 1c) were smaller in ethanol exposed animals (red) relative to controls (black), these differences were not statistically significant (p=0.17 and 0.10, respectively). Cortical surface area, another maturation marker that increases with brain volume and folding, was found to be significantly smaller in the ethanol exposed group compared to controls (Fig. 1b, asterisk, p=0.02). A trend of higher water diffusion anisotropy within the isocortex was observed the in ethanol exposed group (Fig. 1d, p=0.14). In Figure 2, a representative hemisphere from each group was color coded with cortical FA. At G110, cortical FA of the control hemisphere shows a previously documented pattern where it is minimal around insula and increases in both caudal and rostral directions (Fig. 2a). Cortical FA of the representative ethanol exposed hemisphere, however, is markedly higher across the entire isocortex (Fig. 2b). At G135, slightly lower, but non-statistically significantly different mean brain volume (Fig. 1a) and mean cortical surface area per hemisphere (Fig. 1b) were observed in ethanol-exposed, compared to control groups (p= 0.28 and 0.08, respectively). However, the curvature parameter K* was significantly lower in the ethanol exposed group (Fig. 1c, asterisk, p=0.04). As demonstrated by a representative hemisphere from each group at G135, cortical FA is higher at occipital and temporal regions in the ethanol exposed brain (Fig. 2f, arrows) than that of control (Fig. 2e). Nevertheless, FA value is marginally (with no statistical significance) lower in the ethanol exposed group while averaged over the entire isocortex (Fig. 1d).Conclusions and future work
Overall, a trend of decreased brain volume, cortical surface area, as well as K* in the ethanol exposed group at both G110 and G135 reflect perturbed brain maturation. At G110, a higher mean cortical FA in the ethanol exposed group indicates abnormal dendritic differentiation of cortical neurons5. However, equal, or even lower cortical FA observed in the ethanol exposed group at G135 might suggest that measurement of water diffusion anisotropy lost its sensitivity at this age. Region of interest or tract based analyses of the white matter FA is to be performed to characterize the effect of ethanol exposure on fetal white matter development in the future.Acknowledgements
This study was supported by NIH grant R01 AA021981 and grant P51OD011092References
1. Mattson et al., Neuropsychology 1998, 12(1):146-53
2. Wang et al., Front Neuroanat. 2015; 9:147
3. Fogtmann et al., IEEE Trans Med Imaging. 2014;33(2):272-89
4. Knutsen et al., Cereb Cortex. 2013, 23(2): 488-98
5. Leigland et al., Alcohol Clin Exp Res. 2013;37(6):924-32
Figures