2182
In vivo Diffusion tensor imaging to unravel the contribution of thyroid hormones in seasonal neuroplasticity in European Starlings (Sturnus vulgaris)1Bio-Imaging Lab, University of Antwerp, Wilrijk, Belgium, 2Laboratory of Comparative Endocrinology, KU Leuven, Leuven, Belgium
Synopsis
The effect of thyroid hormones on seasonal neuroplasticity in adult songbirds was never investigated before. To study this we treated photorefractory starlings with methimazole, which resulted in a depletion of thyroid hormones plasma levels. Using repeated measures of in vivo DTI and song recordings, neuroplasticity and song behaviour were monitored over different photoperiods. We found indications that thyroid hormones can modulate the seasonal neuroplasticity both directly at the level of the song control system, as suggested by direct changes in song behaviour after methimazole-treatment, and indirectly via the hypothalamus-pituitary-gonad axis, as methimazole-treatment inhibited the testosterone increase upon photostimulation.
Purpose
One of the most dramatic examples of adult neuroplasticity is the seasonal plasticity that occurs in the song control system (SCS) of songbirds. The primary factor inducing this neuroplasticity is the photoperiodic induced increase in testosterone. However, it has been shown that steroid-independent photostimulation can also induce SCS plasticity. One of the proposed alternatives is the mediating effect of thyroid hormones (THs), as THs are associated with neurogenesis and play an important role in the regulation of seasonal reproduction. Prior studies1-3 showed that photostimulation induces an upregulation of thyroid stimulating hormone and type 2 deiodinase, resulting in increased active T3 levels which modulate gonadotropin-releasing hormone neurons leading to an activation of the hypothalamus-pituitary-gonadal (HPG) axis. We investigated whether THs are required to induce SCS plasticity and whether THs could affect the seasonal neuroplasticity (1) directly at the level of the SCS by binding to TH receptors or (2) indirectly via the HPG axis.
Methods
Thirty photorefractory male starlings were divided into a hypothyroid (n=16) and a control group (n=14). Hypothyroidism was induced by adding 0.05% methimazole (MMI) to the drinking water upon switching from long days (16L:8D) to short days (8L:16D). Starlings followed a photoperiodic regime where they became subsequently photorefractory, photosensitive and photostimulated. Structural neuroplasticity was monitored over these different photoperiods by acquiring MRI images on a 7T Bruker MR system equipped with a 400 mT/m gradient insert. Each imaging session consisted of a T2-weighted 3D anatomical RARE scan (TR: 2000 ms; TE: 11 ms; RARE factor: 8; zerofilled to a matrix of (256x92x64) with voxel resolution (0.089x0.25x0.25)mm³) followed by a DTI scan (TR: 7000 ms; TE: 23 ms; d 4ms, D 12ms; b-value 670 s/mm²; 60 diffusion gradient directions; spatial resolution: (0.179x0.179x0.35)mm³; 28 horizontal slices). Throughout the entire imaging procedure, respiration rate and temperature were kept within narrow physiological ranges (41.0 ± 0.2)°C. All datasets were spatially normalized to a population-based template after which a whole-brain voxel-wise repeated measures two-way ANOVA was performed on the smoothed Fractional Anisotropy (FA) and Mean Diffusion (MD) maps (SPM12). Based on the anatomical contrast of the FA maps AreaX, RA and the HVC-RA tract were manually delineated using Amira 5.4. At each time point blood samples were taken to determine plasma levels of T3, T4 and testosterone. At each photoperiod songs were recorded and the song bout length and singing rate were quantified as a measure of the singing behavior.Results & Discussion
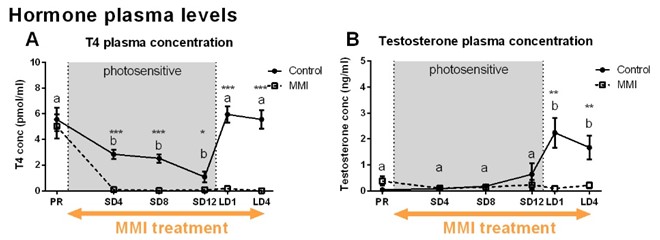
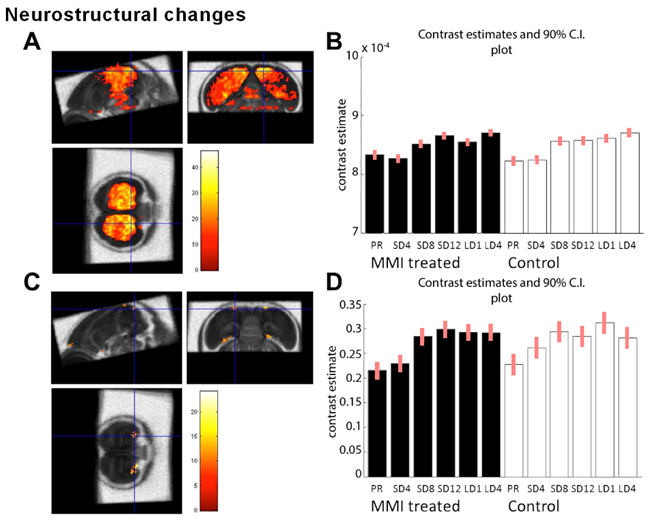
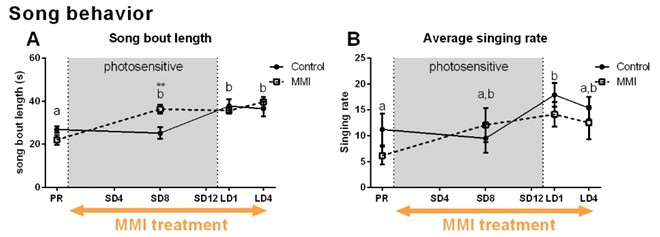
MMI treatment successfully depleted TH plasma levels, while in the control group TH levels decreased during the photosensitive phase and increased again upon photostimulation (Fig. 1A). Interestingly, MMI treatment also inhibited the increase in testosterone levels upon photostimulation, indicating that hypothyroidism affects the HPG axis activation (Fig. 1B). A voxel based analysis of the MD and FA maps showed a widespread increase over time located in the nidopallium and HVC respectively, in both groups (Fig. 2). Similarly, AreaX and RA volumes increased gradually over time in both groups. These neuroplasticity changes started already during the photosensitive phase. The FA value of the HVC-RA tract increased significantly upon photostimulation in the control group, but not in MMI-treated starlings. This could be due to the decreased levels of both THs and testosterone, as testosterone is known to play a role in the increased connection between HVC and RA4. Analysis of the song recordings showed that the average singing rate increased gradually over time in both groups (Fig. 3B). The song bout length increased upon photostimulation in the control group, while in MMI treated birds song bout length already increased during the photosensitive phase (Fig. 3A). This indicates that hypothyroidism can directly affect the singing behavior, irrespective of increased testosterone concentrations and photostimulation.Conclusion
Based on these results we have found indications that THs can modulate the SCS neuroplasticity both directly at the level of the SCS, as suggested by the direct changes in the song behavior of MMI-treated starlings, and indirectly via the HPG axis, as MMI treatment inhibited the testosterone increase upon photostimulation. This inhibition of testosterone increase could explain the absence of the increased connection between HVC and RA. However, additional experiments are required to discriminate fully between the effects of T and THs, as the current treatment affected both testosterone and TH levels.Acknowledgements
This research is supported by a Belspo IAP grant (PLASTOSCINE: P7/17) from the Belgian Science Policy Office and by grants from the Research Foundation – Flanders (FWO, project Nr 1115217N, 1274714N, 12R1917N and G030213N).References
1. Nakao N, et al. Nature. 2008; 452(7185): 317-322.
2. Yoshimura T et al. Nature. 2003; 426(6963): 178-181.
3. Nakane Y, Yoshimura T. Cell Tissue Res. 2010; 342: 341-344.
4. Rasika S et al. Proc. Natl. Acad. Sci. USA. 1994; 91: 7854-8
Figures