2176
Post-contrast Signal Enhancement in Dentate Nucleus on Unenhanced T1 Weighted MRI in Rodents1Department for Diagnostic and Interventional Imaging, UT Health Science Center At Houston, Houston, TX, United States
Synopsis
Some of the gadolinium based contrast agents are shown to produce enhancements on T1-weighted images long after their administration in certain brain structures in humans, raising questions about the safety of these agents. The enhancement is thought to be due to dechelation of the contrast agents. Understanding the pathophysiological effects requires systematic pre-clinical studies. As a first step towards this goal we conducted longitudinal in vivo studies in rodents administered Magnevist and Omniscan for ten days to quantify the temporal profile of enhancement using relaxometry and investigate if this enhancement has an effect on the tissue microstructure. Our results show that Ominiscan lowers both T1 and T2 starting from week 2 post contrast administration. However, such changes were not observed in Magnevist and saline treated animals. The contrast agents do not appear to have significant effect on any of the DTI measures.
Introduction
Kanda et al.1 demonstrated the long-lasting enhancements on the unenhanced T1-weighted scans in the Dentate Nucleus (DN) and the Globus Pallidus (GP) as result of repeated applications of Gadolinium-based MRI contrast agents (GBCA). Radbruch et al.2 observed this enhancement in patients who were administered linear GBCA, Magnevist. Robert et al.3 in a pre-clinical study, showed that the linear GBCA Omniscan administration also resulted in long-lasting enhancement of the DN’s signal. Both authors did not find enhancements when the macrocyclic CA Dotarem was used. Since GBCAs have become an important diagnostic tool their dissociation into potentially toxic fragments has recently gained FDA attention. Most of the studies reported so far used semi-quantitative methods to detect and quantify the enhancement as ratios between the signal intensities of enhanced and unenhanced tissues. However, such an approach may not be robust since signal intensities depend on many variables as TR, TE, and type of pulse sequence, among others. To overcome this limitation we investigated the effect of GBCAs under physiological conditions by using quantitative methods that include NMR relaxometry (T1 and T2 measurements) and DTI-metrics FA, MD, LD, RD.Methods
A 7-Tesla Bruker Biospin scanner with actively shielded gradients was used for the acquisition of MRI. Radio frequency pulses were transmitted with a linear volume coil and an in-house designed surface coil that can be remotely tuned and matched was used for reception. 22 female Lewis rats were used in this study. Baseline scans of all animals were acquired before administering GBCAs. The animals were divided into three groups and treated either with saline, Omniscan or Magnevist. The animals received daily applications of either 0.3 ml Saline or 0.1 mmol/kg GBCA over a period of 10 days. The animals were scanned again 2, 4, and 6 weeks after the start of the treatment. A multi slice multi echo sequence with 10 echoes was used to map T2. T1 was mapped in single slice containing DN with a FAIR-EPI sequence (flow-sensitive alternating inversion recovery echo planar imaging). DTI data was collected with a 2D EPI sequence using navigator echoes and double sampling with 3 segments: TR 1250 ms, TE 24.4 ms, NA 3, 9 b0 images and 42 weighted (b=800 s/mm2) directions in bidirectional icosahedric orientations (2 repetitions). All images at all time points were acquired with an isotropic resolution of 200 microns.Results
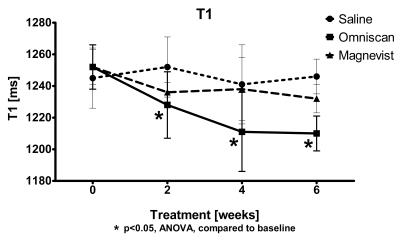
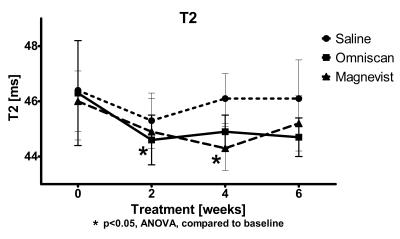
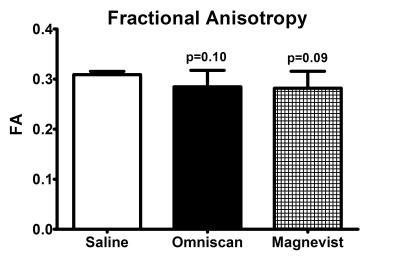
The mean T1 of the DN decreased from 1250±15 ms to 1210±11 ms six weeks after the start of the Omniscan treatment (Figure 1). The changes were significant for the differences of baseline vs 2, 4, and 6 weeks (ANOVA). The ANOVA analysis for Saline or Magnevist did not show significant changes. The differences of T1 at six weeks after the treatment initiation were also significant (ANOVA; Bonferroni post-test for multiple comparisons) in the Omniscan treated group compared to the Saline or the Magnevist treated groups (Figure 1). The differences in T2 in the Omniscan treated group were significant at two weeks after begin of treatment compared to the baseline values. The T2 values in both the Magnevist and Omniscan groups T2 were significantly different at 4 weeks of treatment compared to the baseline values. No significant changes were observed in the T2 values of the saline controlled group (Fig. 2). The analysis of the DTI measures did not show differences at any of the time points in any of the three groups. However differences in FA between saline and the Magnevist or Omniscan groups at six weeks produced only a trend (p~0.1) on uncorrected t-tests (Figure 3).Conclusion
We believe that these are the first studies that investigated longitudinal quantitative changes in T1, T2, and DTI measures. Unlike the studies by Robert et al.3, the dose we used is similar to what is used routinely in clinical studies. In the current study the DTI-metrics did not detect significant changes in the three groups. It is possible that a larger sample size and longer treatment duration would produce significant changes in the DTI measures. Overall, our studies indicate that Omniscan, a linear non-ionic contrast agent has stronger effect than Magnevist, linear ionic contrast agent.Acknowledgements
This study was funded by the National Multiple Sclerosis Society, grant number PP2247.References
1. Kanda T, Ishii K, Kawaguchi H, et al. High signal intensity in the dentate nucleus and globus pallidus on unenhanced T1-weighted MR images: relationship with increasing cumulative dose of a gadolinium-based contrast material. Radiology. 2014; 270(3):834–41.
2. Radbruch A, Weberling LD, Kieslich PJ, et al. Gadolinium Retention in the Dentate Nucleus and Globus Pallidus Is Dependent on the Class of Contrast Agent. Radiology. 2015; 275(3):783-91
3. Robert P, Lehericy S, Grand S, et al. T1-Weighted Hypersignal in the Deep Cerebellar Nuclei After Repeated Administrations of Gadolinium-Based Contrast Agents in Healthy Rats: Difference Between Linear and Macrocyclic Agents. Invest. Radiol. 2015; 50(8):473–80.
Figures


