2173
In vivo Magnetic Resonance Imaging of the Marmoset Spinal Cord at 7T1TNS/NIB/NINDS, National Institutes of Health, Bethesda, MD, United States, 2CENIR, UPMC-Inserm U1127, CNRS 7225, Institut Cerveau Moelle, Paris, France, 3CMS/LFMI/NINDS, National Institutes of Health, Bethesda, MD, United States, 4VIS/NIB/NINDS, National Institutes of Health, Bethesda, MD, United States
Synopsis
When induced to have experimental autoimmune encephalomyelitis (EAE), marmosets can suffer from motor and sensory deficits highly suggestive of lesions located in the spinal cord. In this study, we developed an in vivo spinal cord imaging protocol at 7T for marmosets, and were able to visualize gray and white matter as well as focal EAE lesions. Future work will focus on characterizing the spatiotemporal evolution of spinal cord EAE lesions over the disease course.
Introduction
Experimental autoimmune encephalomyelitis (EAE) in the common marmoset often involves motor and sensory deficits, similar to MS1. Previous study using postmortem MRI on the spinal cord (SC) of marmosets with EAE showed that demyelinated lesions can be frequently found, and that these lesions are distributed along the entire SC length2. However, the dynamics of SC lesion development in marmoset EAE are still unknown. Therefore, the goal of the present study was to develop an in vivo MRI protocol enabling the visualization of normal SC gray (GM) and white (WM) matter in healthy marmosets, as well as the detection of SC abnormalities in marmosets with EAE.Methods
Two healthy and one EAE animals were used in this study. MRI was performed on a 7T/30cm MRI scanner (Bruker). A 3D-printed cradle was designed to position the anesthetized animals in the supine position inside the scanner. A custom-built 12-channel phased-array coil was incorporated inside the plastic cradle to image the entire SC length. A proton density-weighted (PD-w) fast-spin-echo sequence (2D RARE, TR/TE/Rare factor/NA:3500ms/15ms/2/4) was acquired at the cervical and thoracic levels in sagittal (0.125×0.125×0.6 mm3) and axial (0.135×0.135×0.6 mm3) planes. Signal-to-noise ratio (SNR) and contrast-to-noise ratio (CNR) were computed to assess the image quality.Results
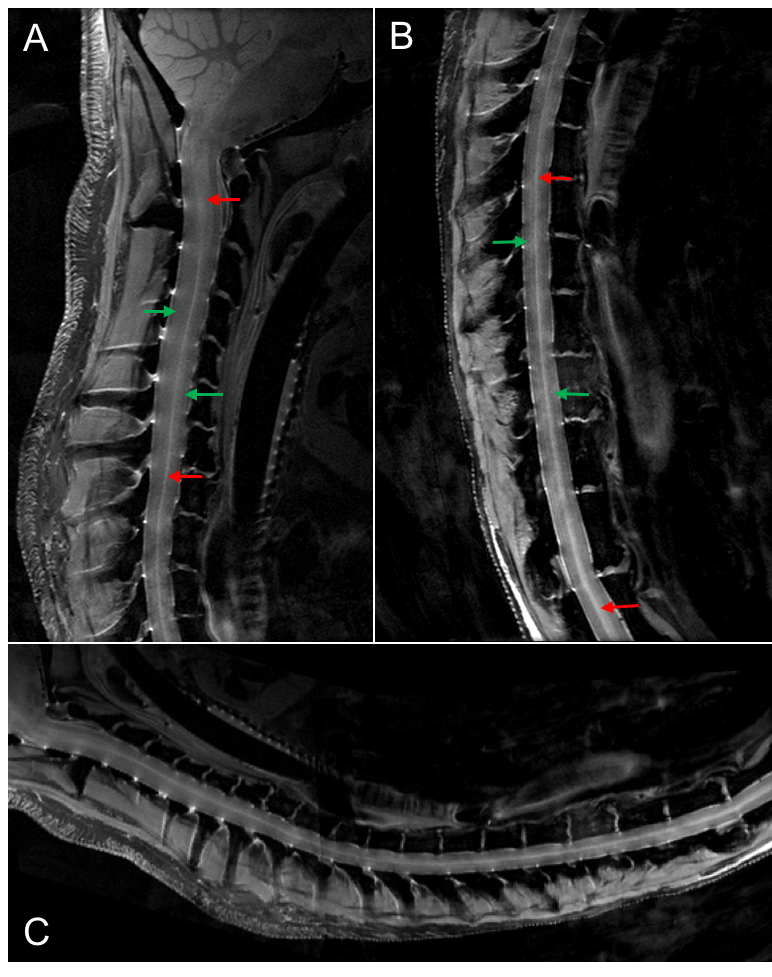
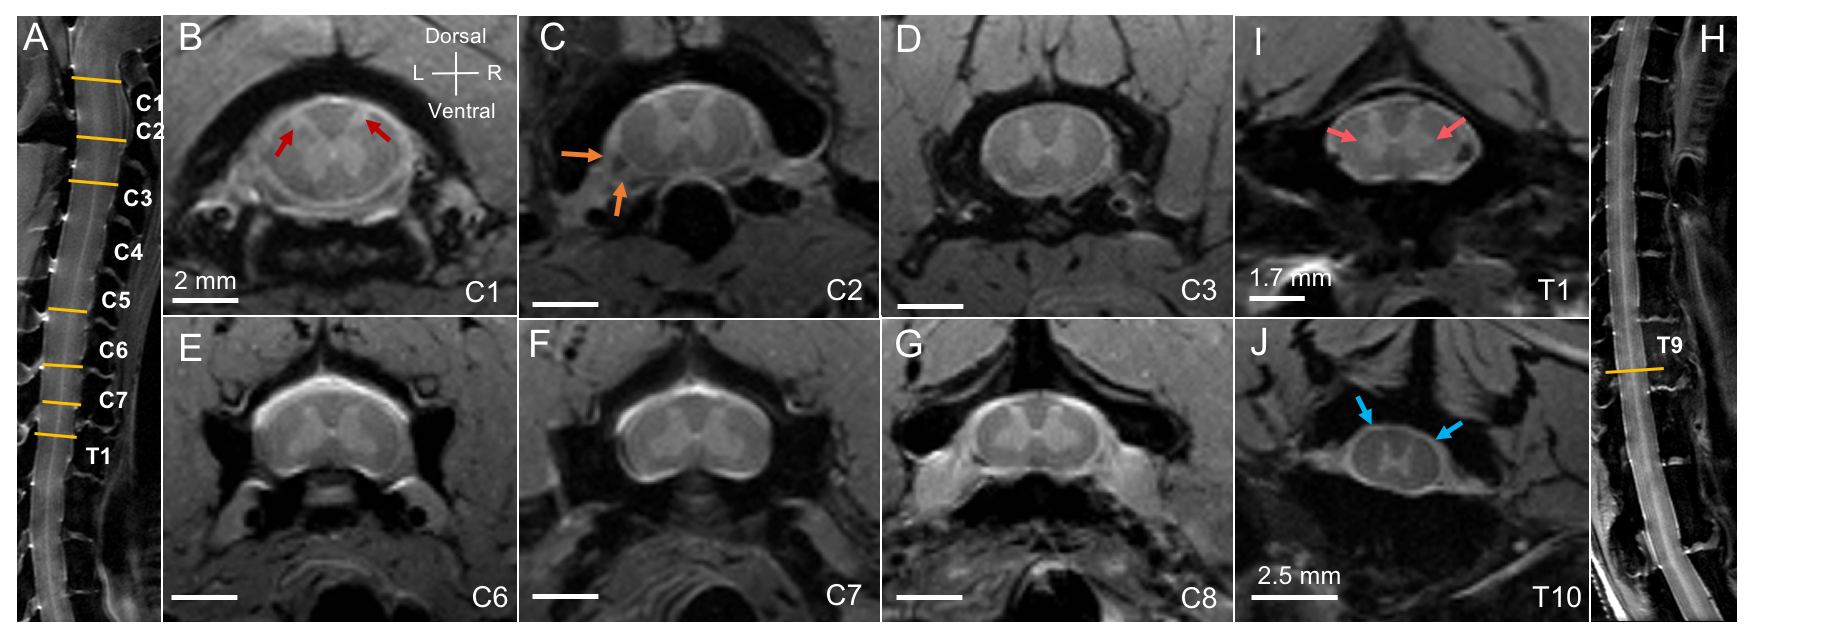
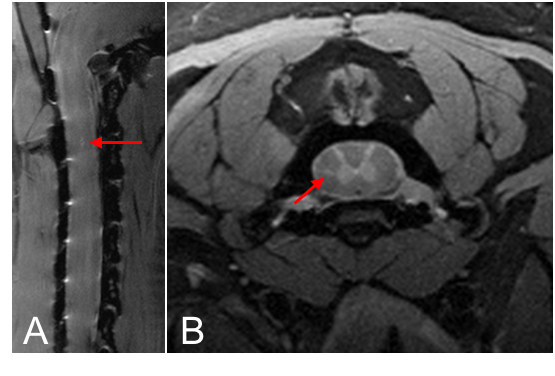
The 3D-printed cradle combined with the custom-built 12-channel phased-array coil fit the curvature of the entire marmoset spine length. This setup allowed for consistent alignment of the spine and optimal signal depth for the coil sensitivity. High-quality sagittal PD-w images showed uniform signal sensitivity along the cord length (Figure 1). Visualization of the SC was also excellent on axial PD-w images, partly due to the absence of magnetic susceptibility artifacts (Figure 2). With an SNR>30 for the SC tissues, anatomical structures (GM, WM, nerve roots, CSF) were clearly identified. Clear delineation between GM and WM tissues was also possible (CNRGM/WM>11). One focal hyperintense lesion was detected at the cervical level of an EAE marmoset located within the lateral WM column, possibly corresponding to an area of demyelination (Figure 3).Conclusion
A dedicated setup for imaging in vivo the entire marmoset spinal cord was developed in this study. High-quality images were acquired at 7T and displayed details of cord anatomy, including GM/WM tissue contrast. Future work will focus on characterizing aspects of marmoset, including robust detection of spinal cord lesions with various MRI contrasts and analysis of the spatiotemporal evolution of those lesions over the disease course.Acknowledgements
No acknowledgement found.References
1: Villoslada P, Hauser SL, Bartke I, et al. Human nerve growth factor protects common marmosets against autoimmune encephalomyelitis by switching the balance of T helper cell type 1 and 2 cytokines within the central nervous system. J Exp Med. 2000;191(10):1799-1806.
2: Lefeuvre J. Ultra-high-resolution postmortem imaging of marmoset EAE spinal cords. In Proceedings of the 24th Annual Meeting of ISMRM, Singapore, 2016. Program number 4404.
Figures