2172
Using intravoxel incoherent motion method to evaluate the effect of butylphthalide in middle cerebral artery occlusion rat model1MR Research China, GE Healthcare, Beijing, People's Republic of China, 2Department of MRI, The First Affiliated Hospital of Zhengzhou University, Zhengzhou, People's Republic of China
Synopsis
Stroke is the third leading cause of death in industrialized countries and the most frequent cause of acquired adult. Butylphthalide has been shown to have protective effects against ischemic stroke. This study would like to observe the temporal evolution of parameters calculated by IVIM model in an experimental middle cerebral artery occlusion (MCAO) rat model, and how the butylphthalide effect the physiological changes.
Purpose
Stroke is the third leading cause of death in industrialized countries and the most frequent cause of acquired adult [1]. 80 % of stroke cases occur due to the occlusion of arteries carrying blood to the brain and subsequent ischemia. Butylphthalide (NBP) has been shown to have protective effects against ischemic stroke [2]. Intravoxel incoherent motion (IVIM) theory provide information about microcirculation of blood in addition to the pure molecular diffusion which can be used in assessment and management of acute/subacute stroke patients[3]. This study would like to observe the temporal evolution of parameters calculated by IVIM model in an experimental middle cerebral artery occlusion (MCAO) rat model, and how the butylphthalide effect the physiological changes.Method
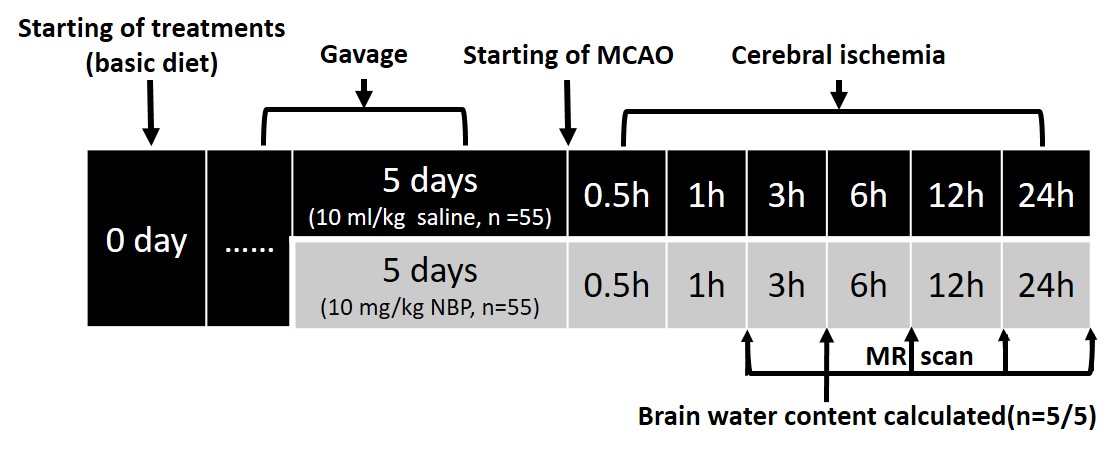
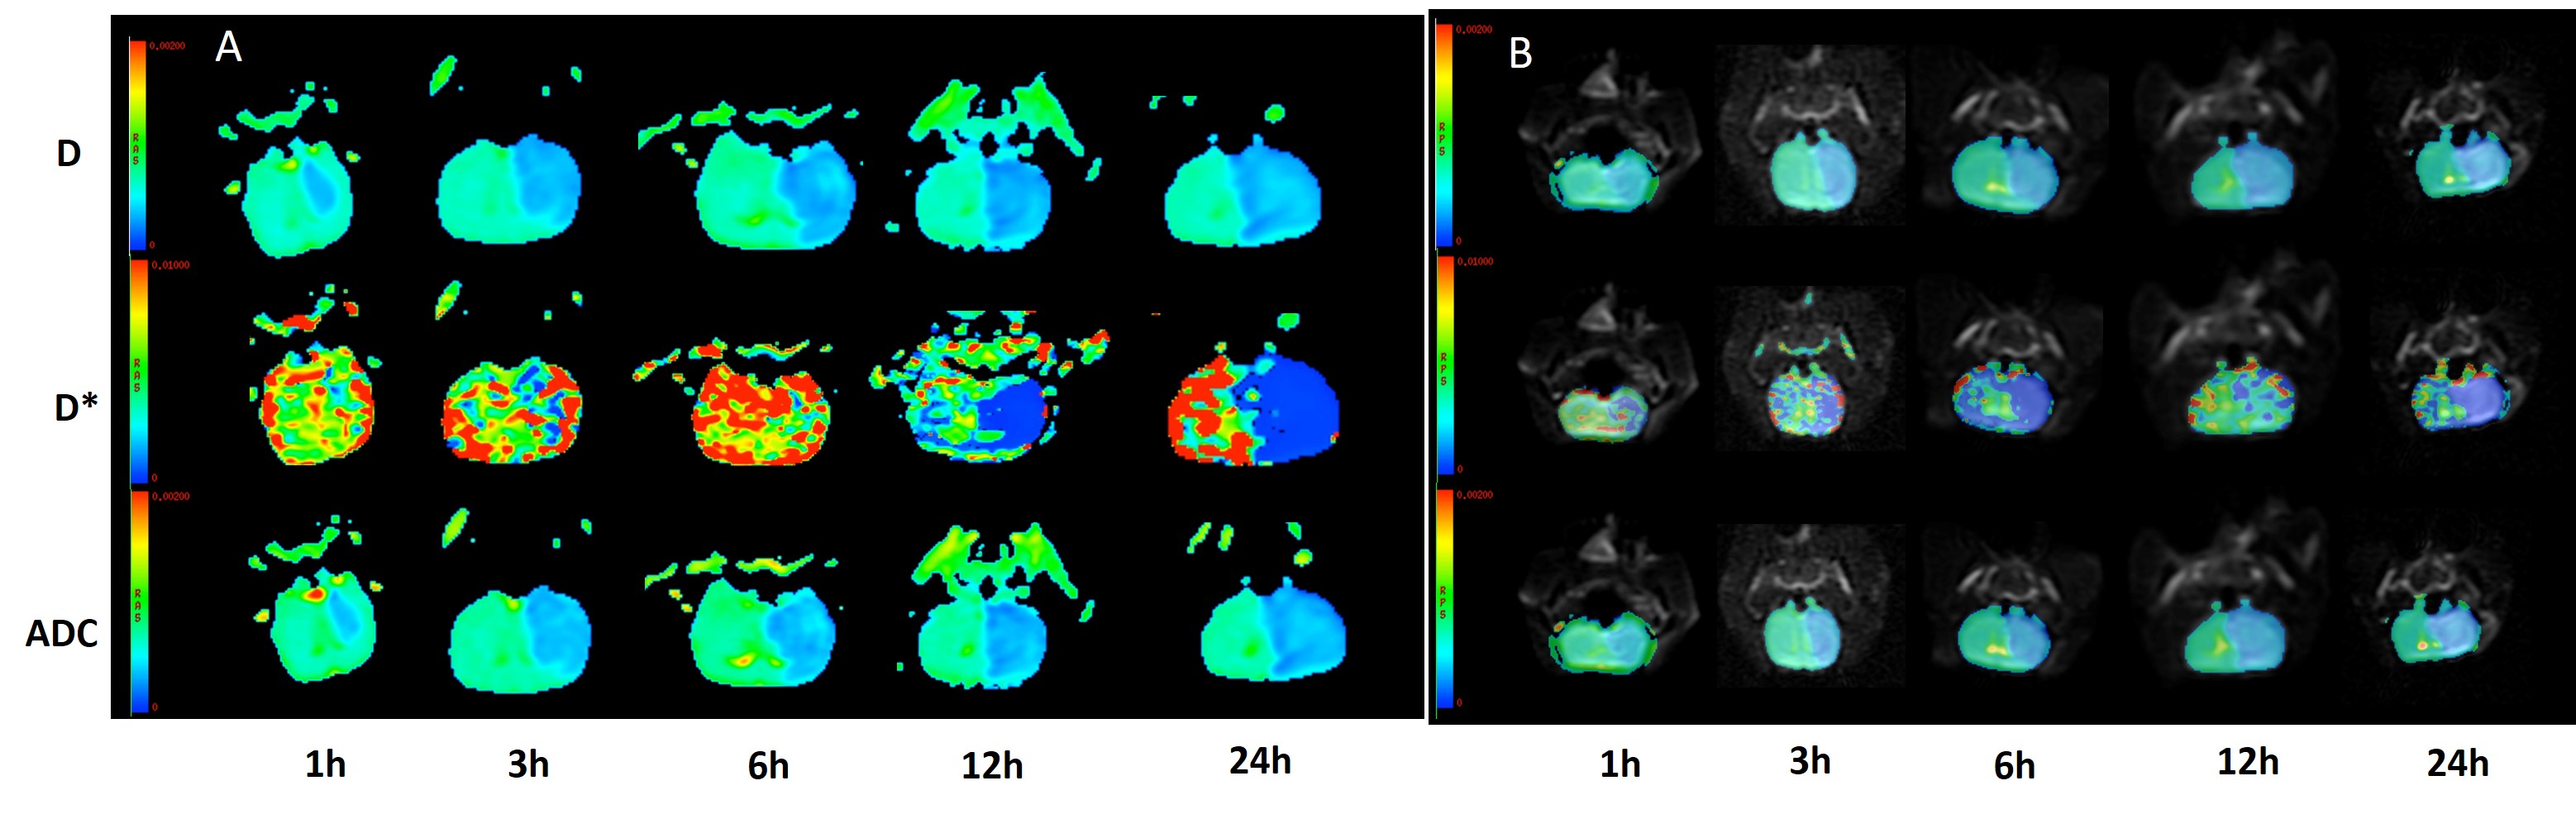
The experimental protocol was approved by the hospital's ethics committee for animal studies under the surveillance of the National Animal Research Authority. A total of 120 male Sprague–Dawley rats weighting 270 to 310 g were used for the studies. Rats were housed in triplets in plastic cages with free access to food and water. Rats were randomly divided into two groups with administered 10 ml/kg saline (MCAO group) or 10 mg/kg NBP (BNP group) per day by gavage for five days. The animal model of the left middle cerebral artery occlusion was established with modified Zea-Longa suture method [4] in rats of both groups. And MR scans were operated at 1, 3, 6, 12, 24h after modeling. 10 brains (5 NBP-treated and 5 non–NBP-treated) were harvested after 3h of modeling with removal of the cerebellum and brain stem. The brains were divided into 2 hemispheres along the midline, and the wet weight of the left hemispheres was measured. The left hemispheres were then incubated at 100°C for 48 hours, and the dry weight was measured. Water content was calculated as (wet weight−dry weight). Schedule of the experimental procedure and design were shown in Fig.1. Ten additional rats with skin incision and carotid vascular separation were included as control group.Image data were acquired on a 3.0T MRI scanner (Discovery MR 750; GE Medical Systems, Milwaukee, WI, USA) with a 4-channel animal coil using a multi-b single shot SE-EPI pulse sequence with the following parameters: TR/TE=3200/110 ms, acceleration factor 2, slice thickness 3 mm with no gap and FOV 70×35, matrix size 96×64. For each subject, eleven b-values set at (number of excitation, NEX): 0(2), 50(2), 100(2), 150(2), 200(3), 300(3), 500(3), 800(4), 1000(4), 1300(4) and 1500 (5) s/mm2 in three orthogonal directions were acquired. The standard ADC (ADCst) was calculated by the mono-exponential model. The IVIM-related parameters, perfusion fraction f, pseudo diffusion coefficient D* and diffusion coefficient D, were calculated using a bi-exponential model. The different parameter maps at different time points were shown in Fig.2
SPSS 17.0 software was used to analyze the varying trends in ADCst, f, D and D* values. The comparison among the groups at different time points was based on a one way ANOVA, with P < 0.05 indicating statistical significance.
Results
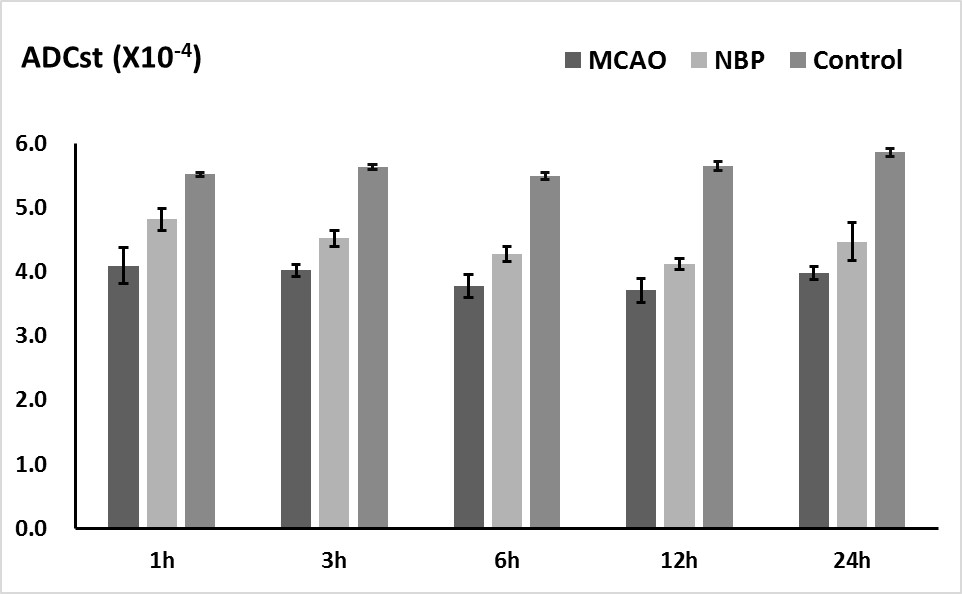
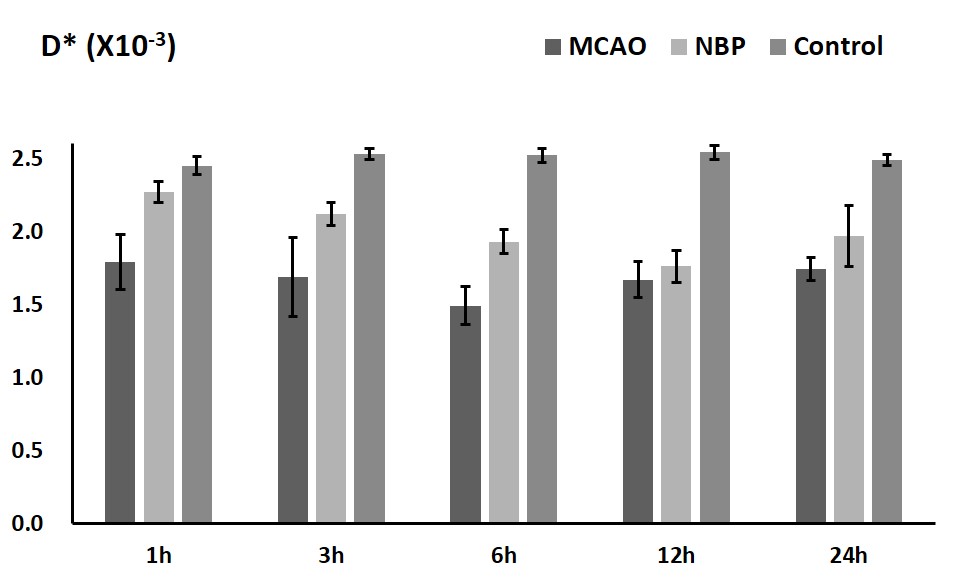
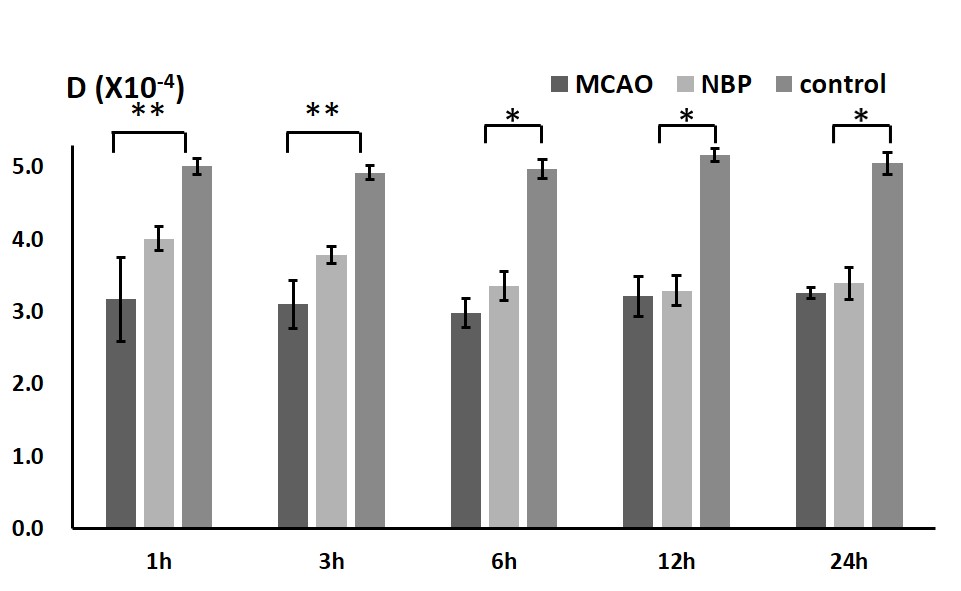
Compared with the NBP+MCAO group (0.91±0.58mg), the brain water content of the MCAO group (2.50±1.01mg) increased significantly after 3 hours onset. The ADCst in MCAO and NBP+MCAO group decline after 1h, and fell to the lowest point at 12h, then slightly increased. The difference between MCAO group and control group、NBP+MCAO group and control group, MCAO group and NBP+MCAO group was statistically significant. The ADCst values of NBP+MCAO group were higher than that of MCAO group at all the time point (Fig. 3). In MCAO group, D* and D fell to the lowest point at 6h, and then increased slightly. However, in NBP+MCAO group ,the value of the two parameters fell to the lowest at 12h. In 1-6h the difference between MCAO and butylphthalide group was statistically significant. The difference between MCAO and control、butylphthalide and control group was statistically significant (Fig. 4, 5). (P<0.05)Discussion and Conclusion
In this study, there is a significantly decline of D* in experiment groups during onset 1-6h, which may relate to the decrease in the extracellular space volume fraction and restriction of the microcirculation inside the ischemic tissue[5]. The molecular cascade initiated by cerebral ischemia includes the loss of membrane ionic pumps and cell swelling. The rapid changes of D and D* indicated that the pathological change in ischemic area may be increasingly severe from 1 to 6 h after onset. The present findings demonstrate the protective effect of butylphthalide on cerebral ischemia, especially which supports using butylphthalide for therapy of cerebral ischemia.Acknowledgements
No acknowledgement found.References
No reference found.Figures