2168
Cerebral metabolic and physiological evidence supporting a shift toward glycolysis in a mouse model with congenital anemia.1Radiology, Albert Einstein College of Medicine, Bronx, NY, United States, 2Medicine/Hematology, Albert Einstein College of Medicine, Bronx, NY, United States, 3Albert Einstein College of Medicine, Bronx, NY, United States, 4Physiology & Biophysics, Albert Einstein College of Medicine, Bronx, NY, United States
Synopsis
The effect of congenital anemic hypoxia on brain energy metabolism was studied on BERK-Hemi mouse exhibiting poor oxygen delivery secondary to reduced hemoglobin oxygen affinity. Regionally increased CBF in BERK-Hemi mouse was correlated with decreased mean diffusivity and tissue T1. Additionally, BERK-Hemi mouse exhibited elevated concentrations in N-acetylaspartate, glutamate, total choline and glucose in thalamus, but a lower concentration of glutamine. Together, the results suggest BERK-Hemi mice develop a compensatory mechanism which leads to increased glycolysis to combat hypoxia and increased reactive oxygen stress.
Purpose
Acute and semi-chronic experimental reductions in oxygen availability1-3 and its impact upon cerebral blood flow (CBF) have been studied extensively. Less well understood is the effect of chronic congenital hypoxia on brain metabolism and function. As a model of congenital hypoxia, we used MRI to study a unique transgenic mouse model of congenital anemia (the BERK-Hemi) which expresses ~15% β human sickle globin and 85% mouse β globin (nearly 100% human α globins) and exhibits reduced tissue oxygen delivery4 due to low oxygen affinity of the hybrid (human α/mouse β) hemoglobin5 thought to produce chronic hypoxia.Methods
BERK-Hemi mice (age 2.7±0.8 months) and C57BL control mice (age 3.4±0.9 months) were studied at 9.4-Tesla (Agilent, Inc) under isoflurane anesthesia. Quantitative CBF images were acquired using continuous ASL6. Tissue T1 was estimated using inversion recovery. DTI was accomplished7 with b-values of 858 s/mm2 over a 128x128 matrix with FOV=25mm2 and 12 slices. T2-wt anatomical images were acquired (FSE, 4 echoes, TE 26 ms). Images of fractional anisotropy (FA) and mean diffusivity (MD) were calculated using the FMRIB FSL diffusion toolbox. The BOLD response to a 6 minute period of hyperoxia (100% O2, BOLD-RHO), was assessed to characterize oxygen extraction. Functional data were registered to anatomical data, which in turn were registered to a template8 using FSL routines. Prior to functional imaging, 1H MRS was acquired on a 1.7x3.2x2.0 mm3 voxel in thalamus via a LASER sequence9 using WET sequence10 for water suppression. Metabolites were quantified using LCModel11,12. Statistical analyses of all data were accomplished in Prism 7 (Graph Pad Software, Inc.). All results are shown as mean ± SD.Results
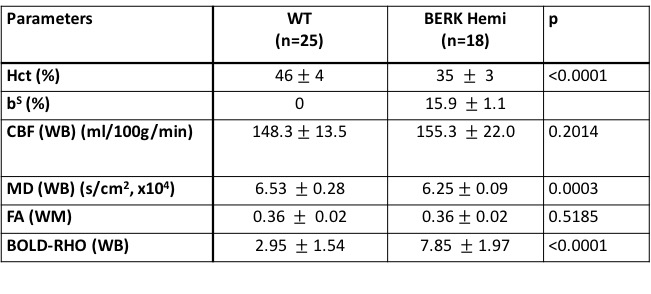
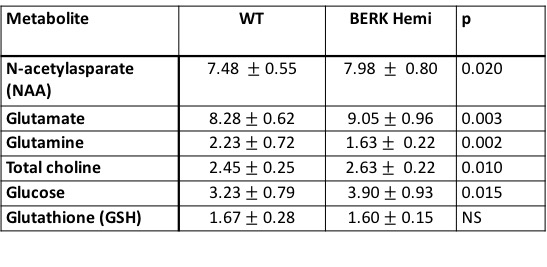
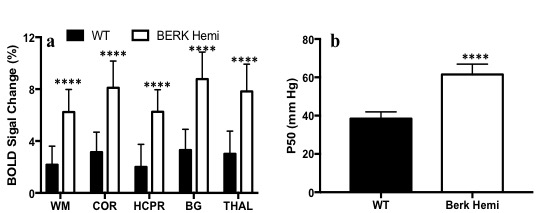
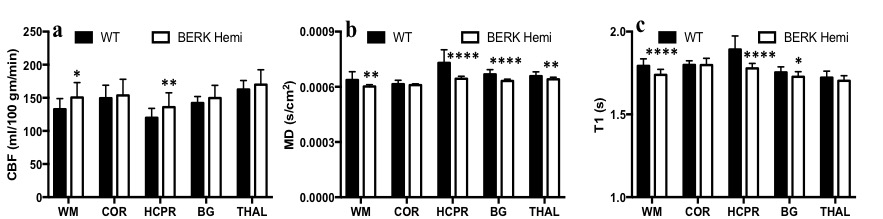
Hematocrit of WT mice was significantly higher than that of Hemi mice (Table 1). The P50 saturation point of Hemi hemoglobin was significantly higher than that of WT (Fig.1b), reflecting the reduced oxygen affinity of interspecies hybrid Hb (human α /mouse β) hemoglobin in Hemi mice. White-matter FA was not significantly different between groups (Table 1). MD of Hemi mice was lower than that of WT mice in whole brain and within WM, HCPR, BG and THAL, but not in COR region (Fig.2b). Both whole-brain (Table 1) and regional (Fig.1a) BOLD-RHO of Hemi mice was significantly higher than that of WT mice. Whole-brain CBF was not different between WT and Hemi mice, but regionally within the white matter and hippocampus of Hemi mice , CBF was higher than in WT mice (Fig.2a). T1 showed similar trend as MD (Fig.2c). In the thalamus, Hemi mice had elevated concentrations of NAA, glutamate, total choline and glucose, but reduced concentration of glutamine (Table 2) when compared to WT mice.Discussion
In Hemi mice, anemia induced by the abnormally low oxygen affinity has been associated with significant but subtle organ pathology4,13-16. Here we report that the Hemi mouse also exhibits altered brain energy and metabolism in comparison to WT mice. Although whole-brain CBF was not significantly different from that in WT mice, locally increased flow in white matter and hippocampus was likely in compensation for poor oxygen delivery (Fig.1) and lower hematocrit (Table 1). Additionally, the increase in BOLD-RHO across brain regions indicates that 100% oxygen delivery increased brain oxygen extraction, suggesting baseline cerebral metabolic rate of oxygen (CMRO2) is limited in Hemi mice, similar to a previous study in which cats that underwent a 320-day hypoxia17 experienced reduced CMRO2. Increased CBF, and reduced MD and T1 in WM and HCPR regions suggest ongoing injury and possibly cellular swelling. Elevated thalamic NAA concentration parallels findings of increased NAA levels in children with sickle cell disease (SCD)18,19 and in one of our mild SCD mouse models20. Elevated NAA and glutamate and decreased glutamine concentrations suggest elevated glycolysis, which we attribute to chronic anemia induced hypoxia and increased hemolytic-induced reactive oxygen stress (ROS)13,21,22. The elevated brain glucose in Hemi mice may be due to chronic hypoxia23 and may be a compensatory mechanism to meet the demand of elevated glycolysis. Despite hypoxia and possible ROS, the concentration of the antioxidant glutathione in Hemi mouse was not different from that in control mouse, suggesting efficient recycling of glutathione from its oxidized form by NADPH-dependent glutathione reductase, leading to the observed decreased glutamine and increased glutamate concentrations (Table 2) promoting NAD(P)H biosynthesis24.Conclusion
The BERK-Hemi mouse with congenital/chronic anemia resulting in mild hypoxia exhibits brain structural changes, mildly increased CBF and compensatory adjustments in brain energy and metabolism homeostasis suggesting a shift toward increased glycolysis. This phenomena is believed to result from chronic hypoxia and possibly hypoxia induced ROS.Acknowledgements
No acknowledgement found.References
1. Ainslie PN, Ogoh S. Regulation of cerebral blood flow in mammals during chronic hypoxia: a matter of balance. Exp Physiol 2010;95:251-62.
2. Zhou H, Saidel GM, LaManna JC. Cerebral blood flow adaptation to chronic hypoxia. Adv Exp Med Biol 2008;614:371-7.
3. Hoiland RL, Bain AR, Rieger MG, Bailey DM, Ainslie PN. Hypoxemia, oxygen content, and the regulation of cerebral blood flow. Am J Physiol Regul Integr Comp Physiol 2016;310:R398-413.
4. Noguchi CT, Gladwin M, Diwan B, et al. Pathophysiology of a sickle cell trait mouse model: human alpha(beta)(S) transgenes with one mouse beta-globin allele. Blood Cells Mol Dis 2001;27:971-7.
5. Roy RP, Nacharaju P, Nagel RL, Acharya AS. Symmetric interspecies hybrids of mouse and human hemoglobin: molecular basis of their abnormal oxygen affinity. J Protein Chem 1995;14:81-8.
6. Kim SG, Tsekos NV. Perfusion imaging by a flow-sensitive alternating inversion recovery (FAIR) technique: application to functional brain imaging. Magn Reson Med 1997;37:425-35.
7. Jones DK, Lythgoe D, Horsfield MA, Simmons A, Williams SC, Markus HS. Characterization of white matter damage in ischemic leukoaraiosis with diffusion tensor MRI. Stroke 1999;30:393-7.
8. Bai J, Trinh TL, Chuang KH, Qiu A. Atlas-based automatic mouse brain image segmentation revisited: model complexity vs. image registration. Magn Reson Imaging 2012;30:789-98.
9. Garwood M, DelaBarre L. The return of the frequency sweep: Designing adiabatic pulses for contemporary NMR. J Magn Reson 2001;153:155-77.
10. Ogg RJ, Kingsley PB, Taylor JS. WET, a T1- and B1-insensitive water-suppression method for in vivo localized 1H NMR spectroscopy. J Magn Reson B 1994;104:1-10.
11. Provencher SW. Estimation of metabolite concentrations from localized in vivo proton NMR spectra. Magn Reson Med 1993;30:672-9.
12. Provencher SW. Automatic quantitation of localized in vivo 1H spectra with LCModel. NMR Biomed 2001;14:260-4.
13. Kiefmann R, Rifkind JM, Nagababu E, Bhattacharya J. Red blood cells induce hypoxic lung inflammation. Blood 2008;111:5205-14.
14. Diwan BA, Gladwin MT, Noguchi CT, Ward JM, Fitzhugh AL, Buzard GS. Renal pathology in hemizygous sickle cell mice. Toxicol Pathol 2002;30:254-62.
15. Kohli DR, Li Y, Khasabov SG, et al. Pain-related behaviors and neurochemical alterations in mice expressing sickle hemoglobin: modulation by cannabinoids. Blood 2010;116:456-65.
16. Solovey A, Kollander R, Shet A, et al. Endothelial cell expression of tissue factor in sickle mice is augmented by hypoxia/reoxygenation and inhibited by lovastatin. Blood 2004;104:840-6.
17. Cervos-Navarro J, Sampaolo S, Hamdorf G. Brain changes in experimental chronic hypoxia. Exp Pathol 1991;42:205-12.
18. Steen RG, Ogg RJ. Abnormally high levels of brain N-acetylaspartate in children with sickle cell disease. AJNR Am J Neuroradiol 2005;26:463-8.
19. Emam AT, Ali AM, Babikr MA. Magnetic resonance spectroscopy of the brain in children with sickle cell disease. Neurosciences (Riyadh) 2009;14:364-7.
20. Cui M-H, Suzuka S, Branch N, et al. Brain neurochemical and hemodynamic findings in the NY1DD mouse model of mild sickle-cell disease and the possible role of oxidative stress. NMR Biomed Under revision.
21. Abugo OO, Rifkind JM. Oxidation of hemoglobin and the enhancement produced by nitroblue tetrazolium. J Biol Chem 1994;269:24845-53.
22. Balagopalakrishna C, Manoharan PT, Abugo OO, Rifkind JM. Production of superoxide from hemoglobin-bound oxygen under hypoxic conditions. Biochemistry 1996;35:6393-8.
23. Harik SI, Behmand RA, LaManna JC. Hypoxia increases glucose transport at blood-brain barrier in rats. Journal of applied physiology (Bethesda, Md : 1985) 1994;77:896-901.
24. Morris CR, Suh JH, Hagar W, et al. Erythrocyte glutamine depletion, altered redox environment, and pulmonary hypertension in sickle cell disease. Blood 2008;111:402-10.
Figures