2167
Loss of lateral asymmetry in the brain of mouse models of autism1Hospital for Sick Children, Toronto, ON, Canada, 2Department of Medical Biophysics, University of Toronto, Toronto, ON, Canada
Synopsis
Examination of lateral asymmetry differences in mouse models related to Autism. Using 42 different mouselines as a representative sample of an autistic population, we show a loss of asymmetry in the mutant mice compared to wild-type that may be indicative of functional and/or behavioural variations.
Background
Lateral
asymmetry in the brain is common in most biological systems. Differences in that asymmetry can provide
insight into functional and/or behavioural variations in the population.
Studies have shown asymmetry differences in autism compared to typically
developing controls (1). Previous work
on the mouse highlights several regions of asymmetry in the mouse brain (2),
including the striatum, hippocampus, and areas within the thalamus and cortex.Objectives
Using 42 different mouselines related to autism as a representative sample of an autistic population, we hypothesized asymmetry differences compared to wild-type (WT) would be found in the autistic population that would be indicative of functional and/or behavioural variations.Methods
In total 1340 mouse brains were examined from 42 different mouselines related to autism (3). For each mouseline, mutant mice were compared with their own wild-type controls and in some cases certain lines would have multiple mutations (i.e. heterozygotes and homozygotes).
MRI Acquisition - For the 42 mouselines, 1340 individual scans were acquired using previously detailed high-throughput techniques (4), which allow 16 mouse brains to be scanned at a time using a 7.0 Tesla MRI system (Agilent Inc.). As the data in this study was acquired over a period of 7+ years the MRI sequence used was refined over time. The current sequence used is a T2-weighted, 3D fast spin-echo sequence was used with restricted sampling (cylindrical acquisition), TR of 350 ms with a TEeff of 12 ms per echo over 6 echoes, field-of-view of 20 × 20 × 25 mm3, matrix size = 504 x 504 x 630, yielding images with 0.040 mm isotropic voxels and an imaging time of ~14 h.
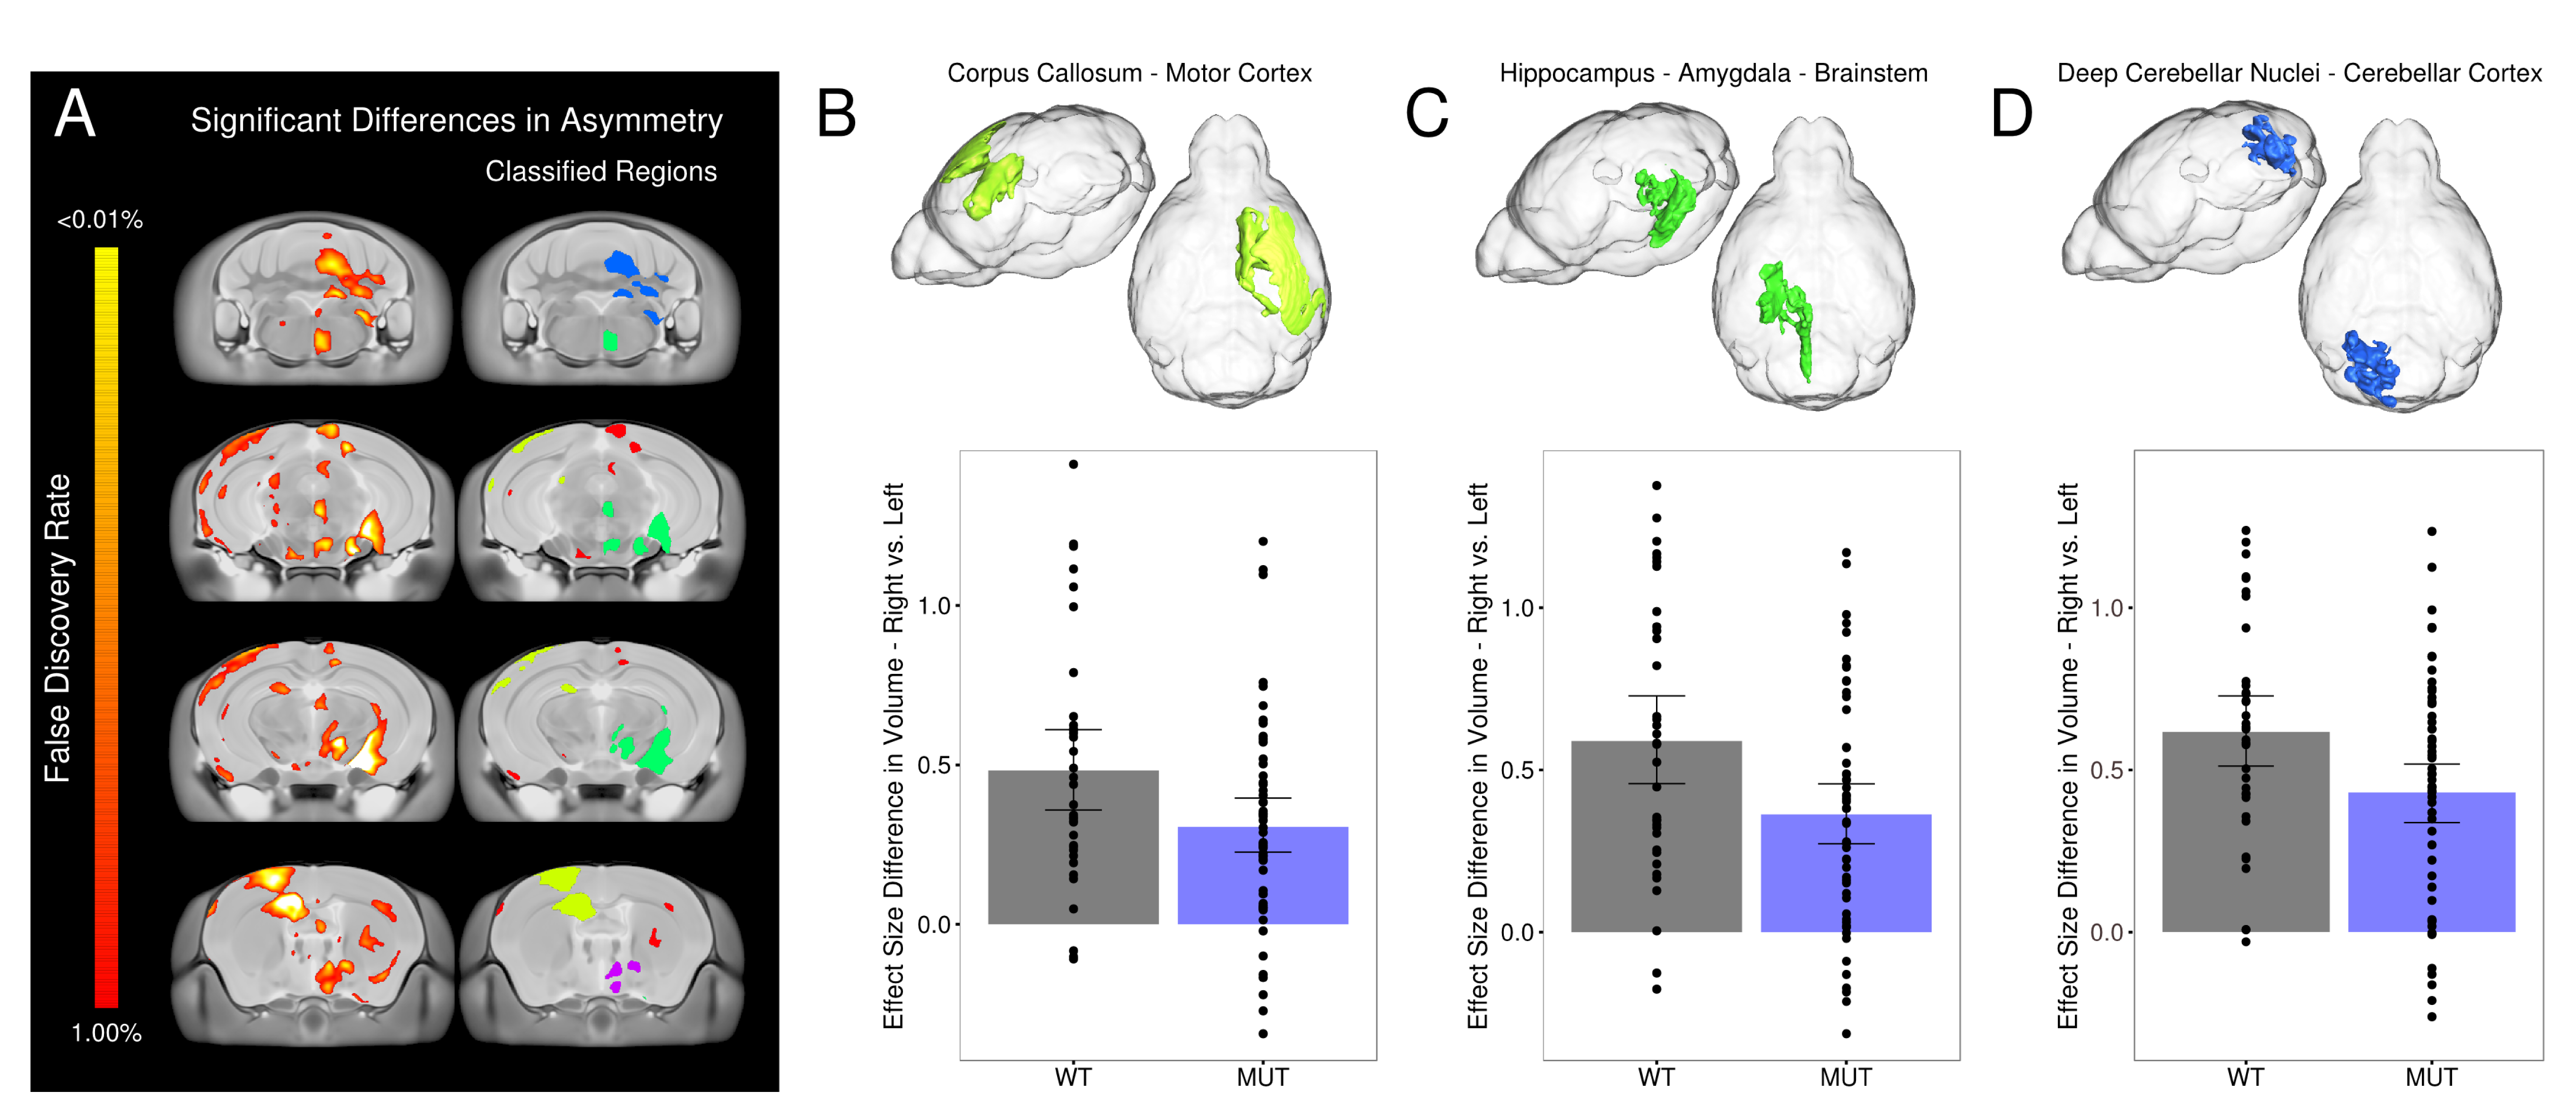
Data Analysis – After acquisition a two level registration pipeline was used to compare images. Prior to the registration acquisition images were flipped/mirrored along the midline axis to create the target for the first level of the registration. The first level registered the acquisition image to its flipped version and the second level registered all those images together. Comparisons were made between the flipped and original image to assess asymmetry and across mouselines. Baseline asymmetry was established using 476 C57Bl6/J mice (Figure 1A). Areas of significant voxelwise asymmetry were used to form regional asymmetry networks (Figure 1A – classified regions). 20 different asymmetric areas were identified. The mean effect size differences in asymmetry were calculated both regionally (131 lateralized regions) as well as within these 20 areas for the WT and mutant in each of the 42 different mouselines. Significant differences between the WT and mutant group were calculated using a linear model and multiple comparisons were controlled for using False Discovery Rate (FDR).
Results
Of the 20 regional networks/areas that were examined we found a loss in lateral asymmetry in the 3 largest areas. The strongest losses were found in areas in the hypothalamus and thalamus (p=0.01, FDR=11%) as well as a corpus callosum to motor cortex network (p=0.01, FDR=12%). Additional losses of asymmetry were found in a memory network involving the hippocampus, amygdala, and brainstem (p=0.03, FDR=12%), and a cerebellar area involving the deep cerebellar nuclei (p=0.03, FDR=12%). The models with the strongest asymmetry loss in these 3 areas were Cntnap2, Foxp1, Gtf2i, 22q11, and Slc6a4 KI in that order. The loss of asymmetry in the corpus callosum to motor cortex network could be related to functional deficits as several lines have motor abnormalities (e.g. En2, Gtf2i, Mecp2 etc.). Similarly the loss of asymmetry in the memory network (Hippocampus–Amygdala–Brainstem) may be related to cognitive deficits in several lines (e.g. Shank3, 15q11-13, Cntnap2 etc.).Conclusions
Overall, we found several specific areas where normal lateral asymmetry was lost in the brain of autism related mouse models.Acknowledgements
The authors would like to acknowledge the Canadian Institute for Health Research, Brain Canada, and the Ontario Brain Institute.References
1) Herbert et al. Abnormal asymmetry in language association cortex in autism. Ann. Neurol., 2002; 52(5):588-96, 2) Spring et al., Cerebral asymmetries in 12-week-old C57Bl/6J mice measured by magnetic resonance imaging. NeuroImage 2010; 50(2):409-15, 3) Ellegood et al., Clustering autism: using neuroanatomical differences in 26 mouse models to gain insight into the heterogeneity. Mol Psych. 2015; 20(1):118-25, 4) Lerch et al., MRI phenotyping of genetically altered mice. Methods Mol. Biology, 2011; 711:349-61.Figures