2165
Developmental assay with Magnetization Transfer Ratio in non-human primate1Tokyo Metropolitan University, Tokyo, Japan, 2Central Institute for Experimental Animals (CIEA), Kawasaki, Japan, 3School of Medicine Keio University, 4Brain Science Institute, RIKEN
Synopsis
MTR reflects the protein content such as myelin of brain. We examined the age-related MTR for common marmosets (1-18 months). Almost all regions of the brain have increased as T1 relaxation similar curve and the rate change of the MTR in each region was different. In voxel-wise analysis, MTR increase shows back-to-front maturation patterns in white matter. This pattern has observed in human studies. MTR can be a good marker to evaluate the normal brain development of common marmoset, and eventually a suitable parameter to assess brain developmental disorders for study, diagnosis, and treatments.
Purpose
Magnetization Transfer Contrast (MTC) is based on exchange of magnetization between protons that are bound to macromolecules and protons in free water. Quantitative Magnetization Transfer Ratio (MTR) is calculated by using non MT images and MTC images. This value has been already used for clinical practice and studies such as demyelinating disease typified by multiple sclerosis and young children with autism. 1,2
Common marmosets can be a good disease model for such preclinical researches; i) their brain is more similar than other research animals; ii) the brain is compact; iii) marmosets can be genetically modified and manipulated. .In humans, myelination progresses rapidly during infancy and continues through the adolescent stage. A number of studies have suggested that MTR value increases in healthy human brain development. 3,4 In this study, we assessed age-related changes in magnetization transfer ratio with atlas based whole brain analysis in common marmoset development. MTR is expected a good marker to evaluate the normal brain development of common marmoset.
Methods
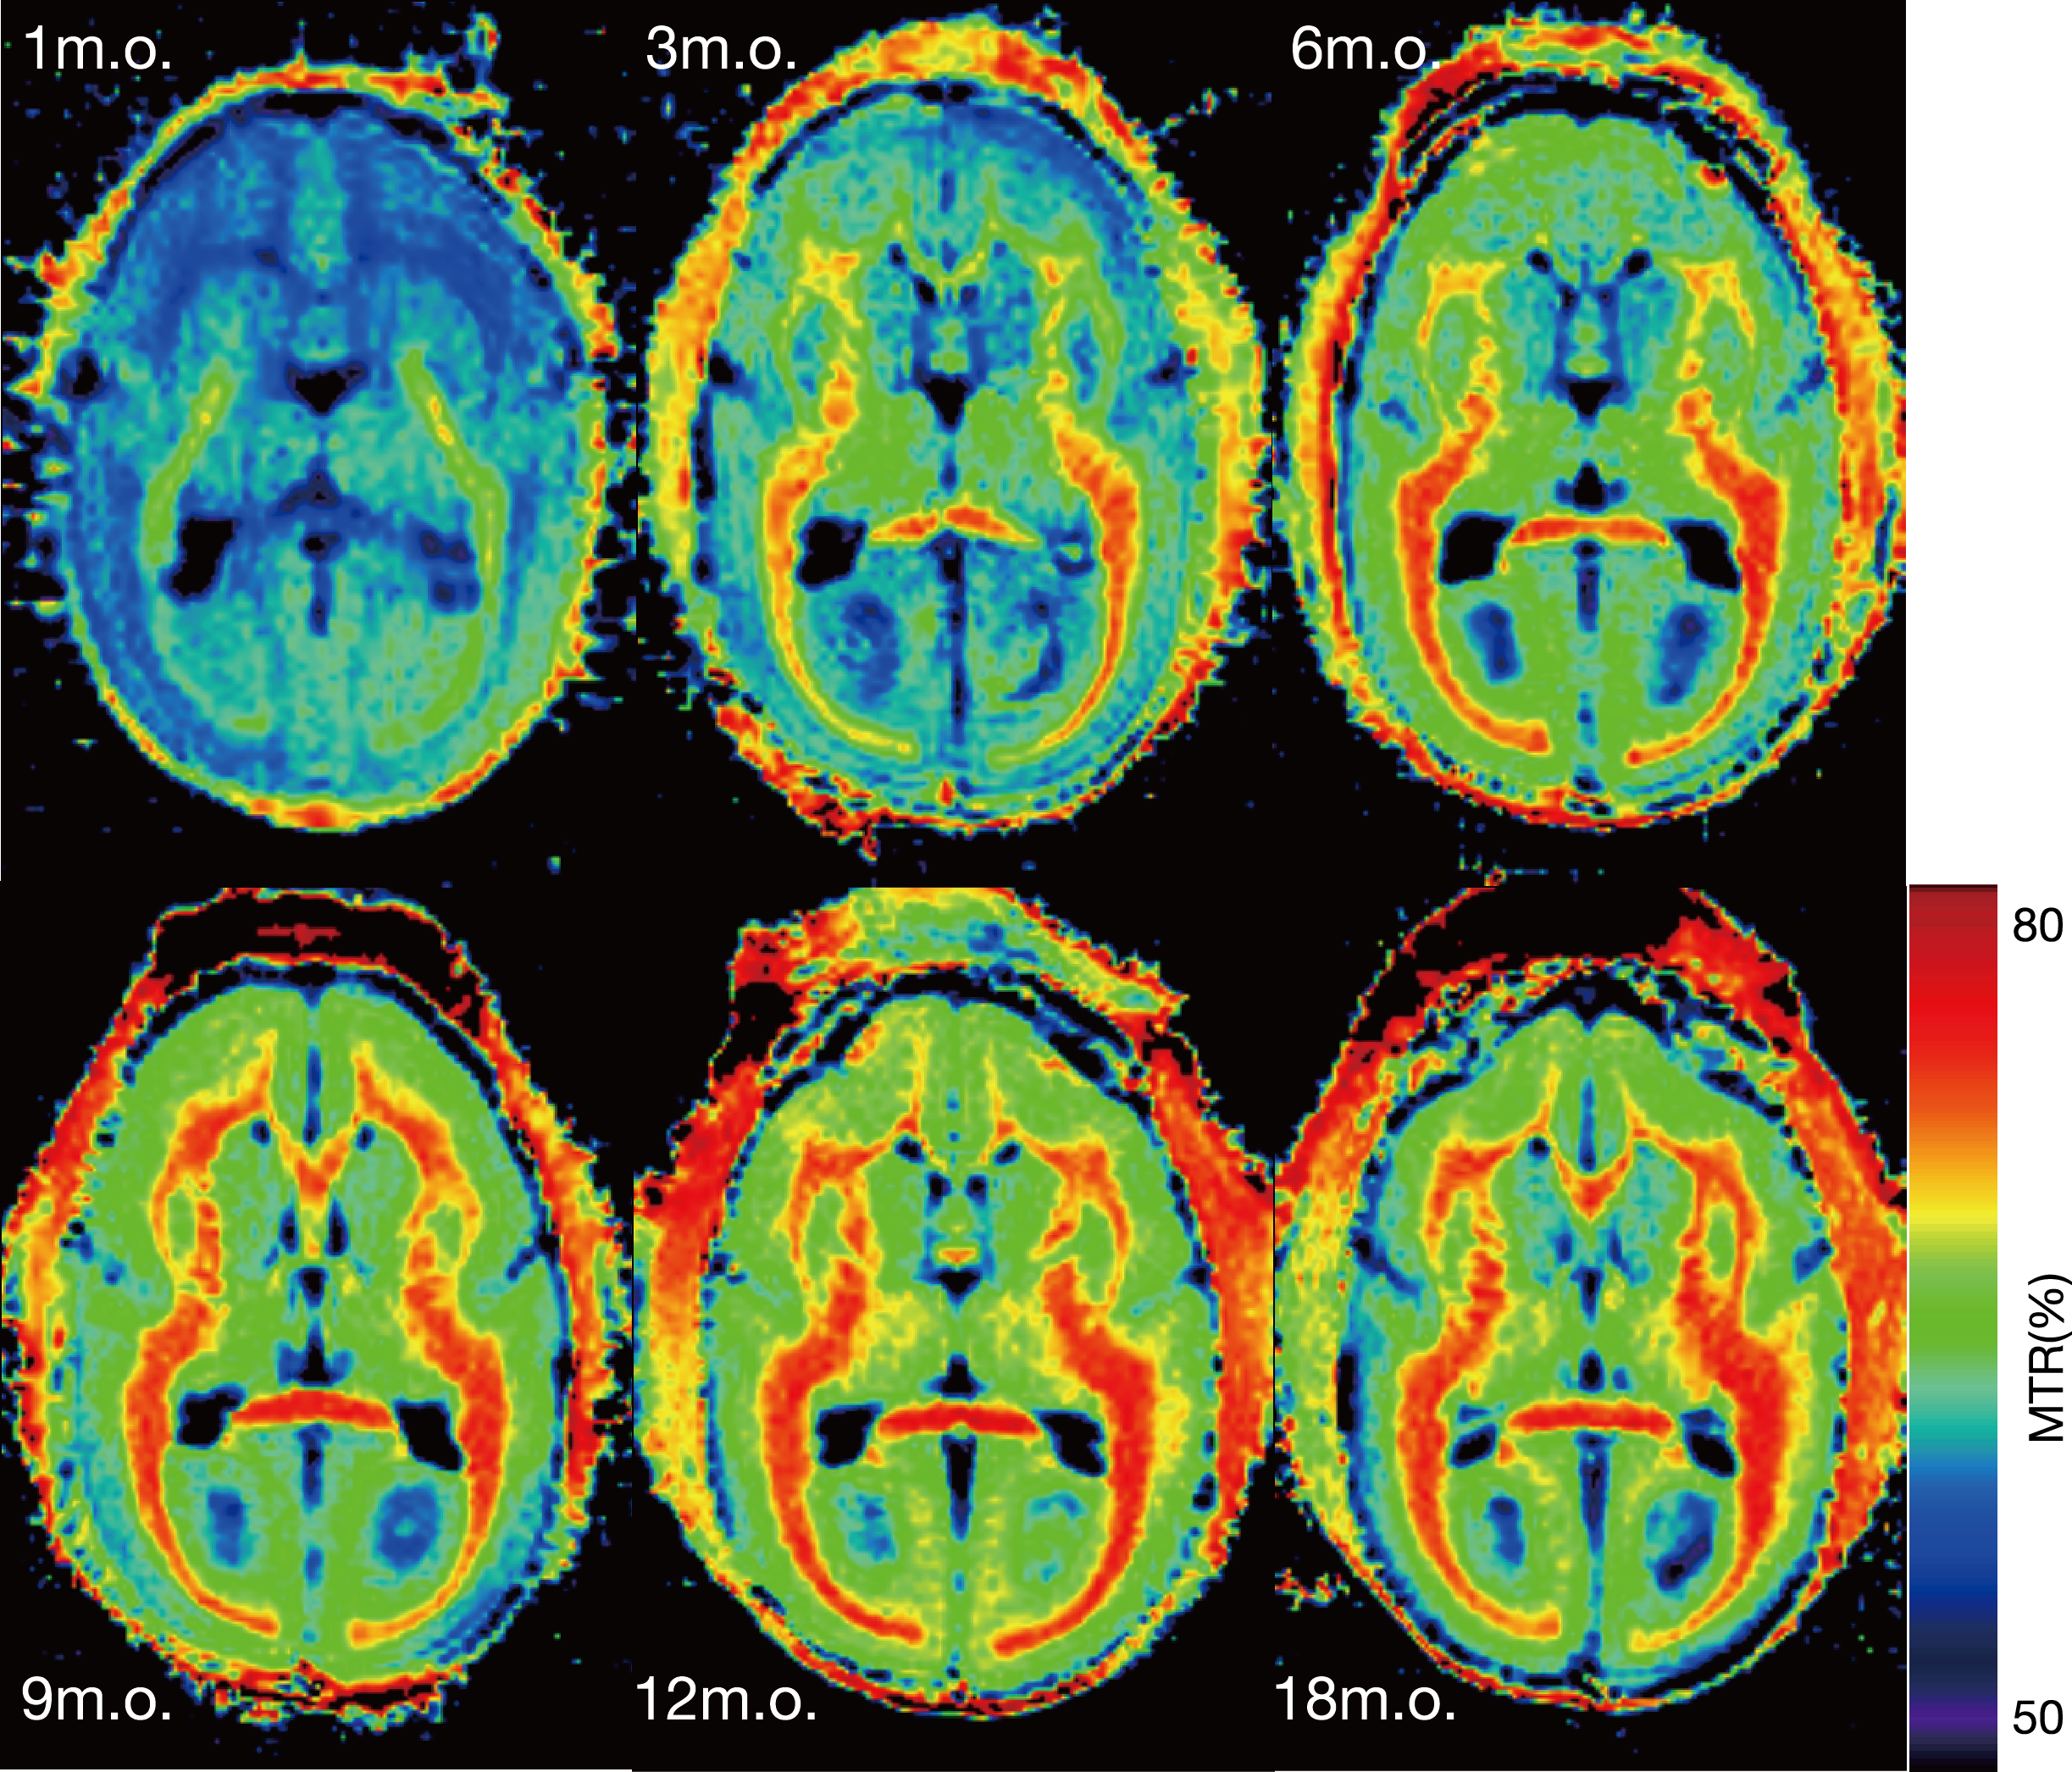
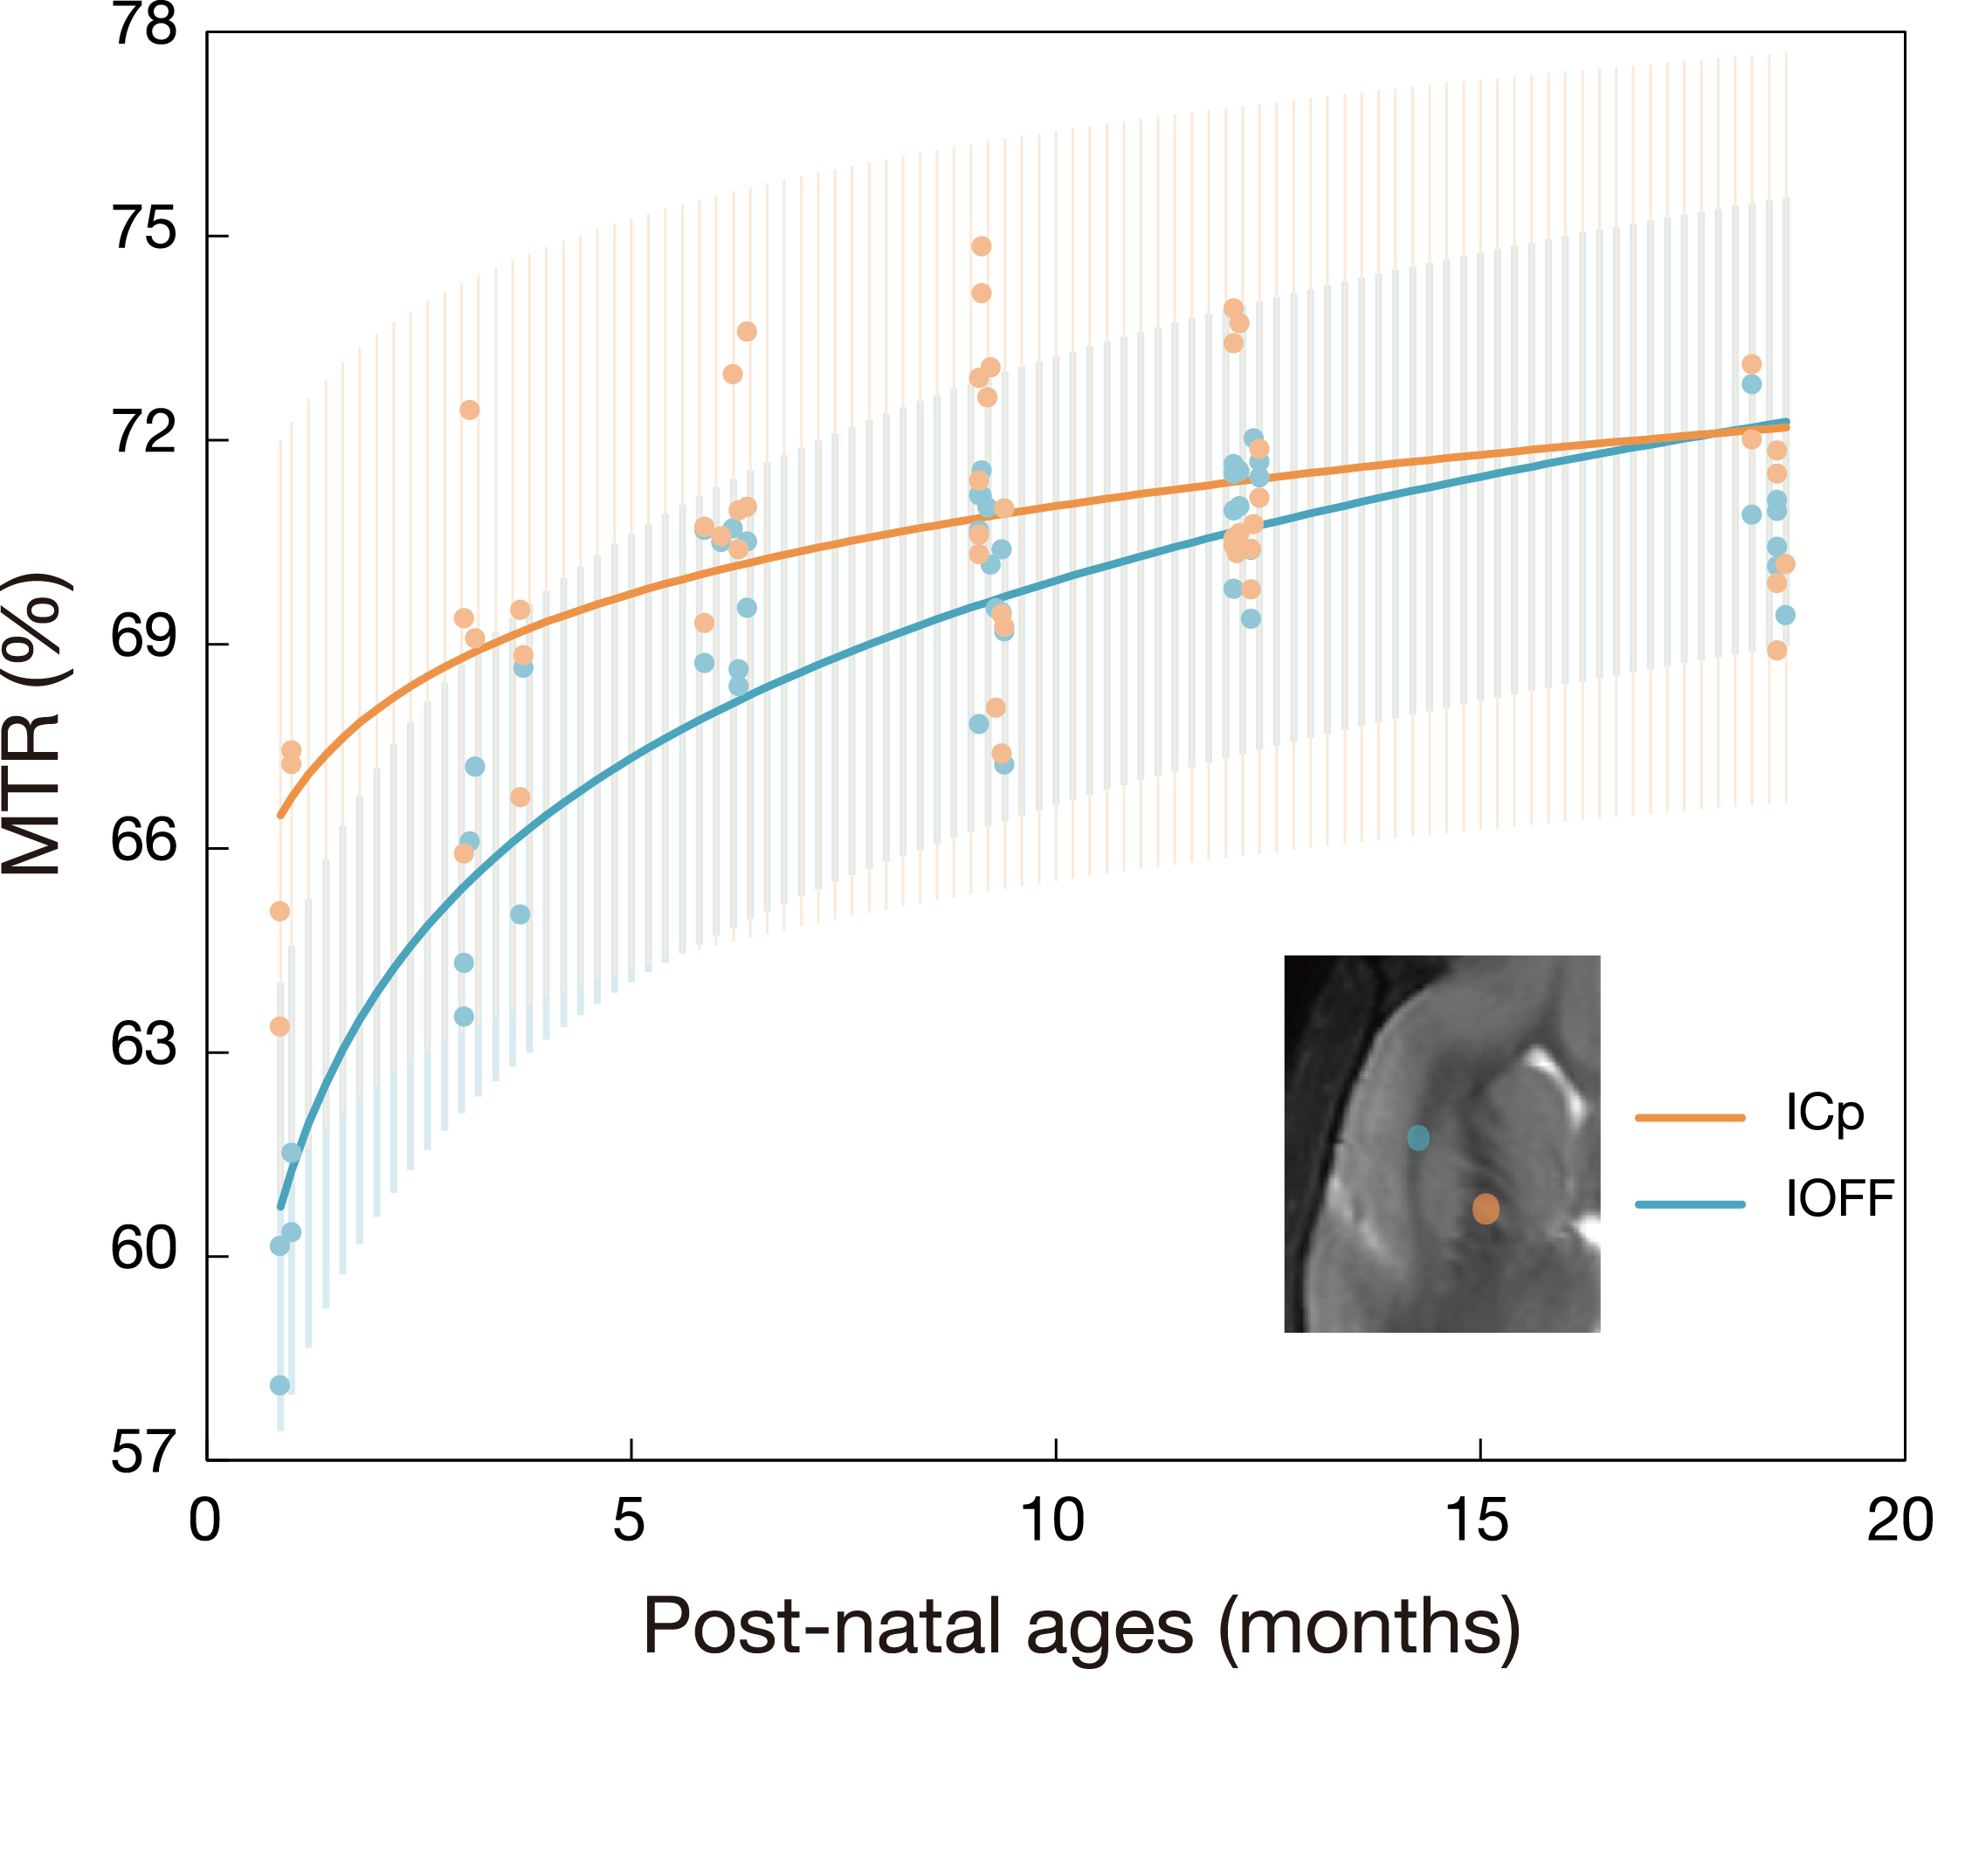
All data were acquired in 21 healthy common marmosets (10 males, 11 females, 1-18 months old) with 7.0T MRI (Biospec 70/16, Bruker BioSpin, Ettlingen,Germany ) using a conventional linear polarized birdcage resonator. The geometry was identical for all scan: 128 × 128 matrix size, 50 mm FOV, 54 slices. For the MTR acquisition, a FLASH sequence was used, with (Ms) and without (M0) an offset magnetization transfer saturation pulse (+1500 Hz off resonance5, Gaussian shaped, 7.0 µT strength, 2.0 ms duration, number of pulses: 16, 1370 Hz band width, 90 degree flip angle), number of averages 1, TE = 2.860 ms, TR = 2600 ms and flip angle = 70 degree. MTR images were calculated using the formula: MTR = 100 × (M0– Ms) / M0 (1). We thought there was difference between ICp (posterior limb of internal capsule) and IOFF (inferior occipitofrontal fascicle) from figure 1. Then we measured these areas with ROI. And MTR images were normalized using population-averaged standard brain template.6 We measured MTR value in a plural region of brain parcels using anatomical atlas label7, and assessed the age-related changes of MTR for each region. And MTR were also calculated by voxel. 3D color maps that reflected age-related MTR changes by voxel were superimposed on the average template image for visualization.Results & Discussion
In ICp and IOFF, MTR increased with age, but we found that there was a difference in the speed. Figure 2 shows a faster change in ICp whereas IOFF is slow. It is known regions associated with basic function such as ICp develop earlier; on the other hand, those associated with executive function such as IOFF develop later. By measuring whole brain with anatomical label, MTR increased in almost all regions of the brain as matured. In addition, the rate change of the MTR in each region was different. Overall, a negative exponential relationship similar to T1 relaxation curve to exists between MTR and age. From this, we approximated the curve by following formula and obtained the rate change of MTR. The voxel-by-voxel rate change was mapped in 3D (figure 3). In the color scale, the cool colors (blue) is fast of the MTR changes, warm colors (red) is slow. The occipital lobe reached plateau earlier whereas the frontal lobe reached later. This pattern corresponds to back-to-front maturation pattern observed in human studies.These data demonstrate MTR can evaluate the brain development of common marmosets. MTR can provide more detailed information about properties of the underlying white matter tissue. Thus increase the number of data considering individual differences would lead to more accurate and specific evaluation.Conclusion
In this study, we examined the age-related MTR for common marmosets (1-18 months), the results were as follows:
1. ICp (posterior limb of internal capsule) related to motor function develop earlier; on the other hand, IOFF (inferior occipitofrontal fascicle) related to higher-cognitive function develop later.
2. Almost all regions of the brain have increased as T1 relaxation similar curve.
3. In voxel-wise analysis, the rate of increase of MTR was fast in the occipital lobe, but was slow in the frontal lobe.This difference in speed may reflect the different timing of myelination in each region.
These results indicate MTR can be a good marker to evaluate the normal brain development of common marmoset, and eventually a suitable parameter to assess brain developmental disorders for study, diagnosis, and treatments.
Acknowledgements
This research is partially supported by the program for Brain Mapping by Integrated Neurotechnologies for Disease Studies (Brain/MINDS) from Japan Agency for Medical Research and development, AMED.References
1. Erwin LAB. Quantitative MRI-pathology correlations of brain white matter lesions developing in a non-human primate model of multiple sclerosis. NMR Biomed. 2007;20:90–103.
2. Gozzi M. A magnetization transfer imaging study of corpus callosum myelination in young children with autism. Biol Psychiatry. 2012;72:215–220.
3. Engelbrecht V. Age-dependent changes in magnetization transfer contrast of white matter in the pediatric brain. Am J Neuroradiol. 1998;19:1923–1929.
4. Dubois J. The early development of brain white matter: A review of imaging studies in fetuses, newborns and infants. Neuroscience. 2014;276:48–71.
5. Fjær S. Magnetization transfer ratio does not correlate to myelin content in the brain in the MOG-EAE mouse model. Neurochem Int. The Authors; 2014;83–84:28–40.
6. Hikishima K. Population-averaged standard template brain atlas for the common marmoset (Callithrix jacchus). Neuroimage. 2011 Feb 14;54(4):2741-9.
7. Hashikawa T. Current models of the marmoset brain. Neurosci Res. 2015 Apr ;93:116-27.
Figures
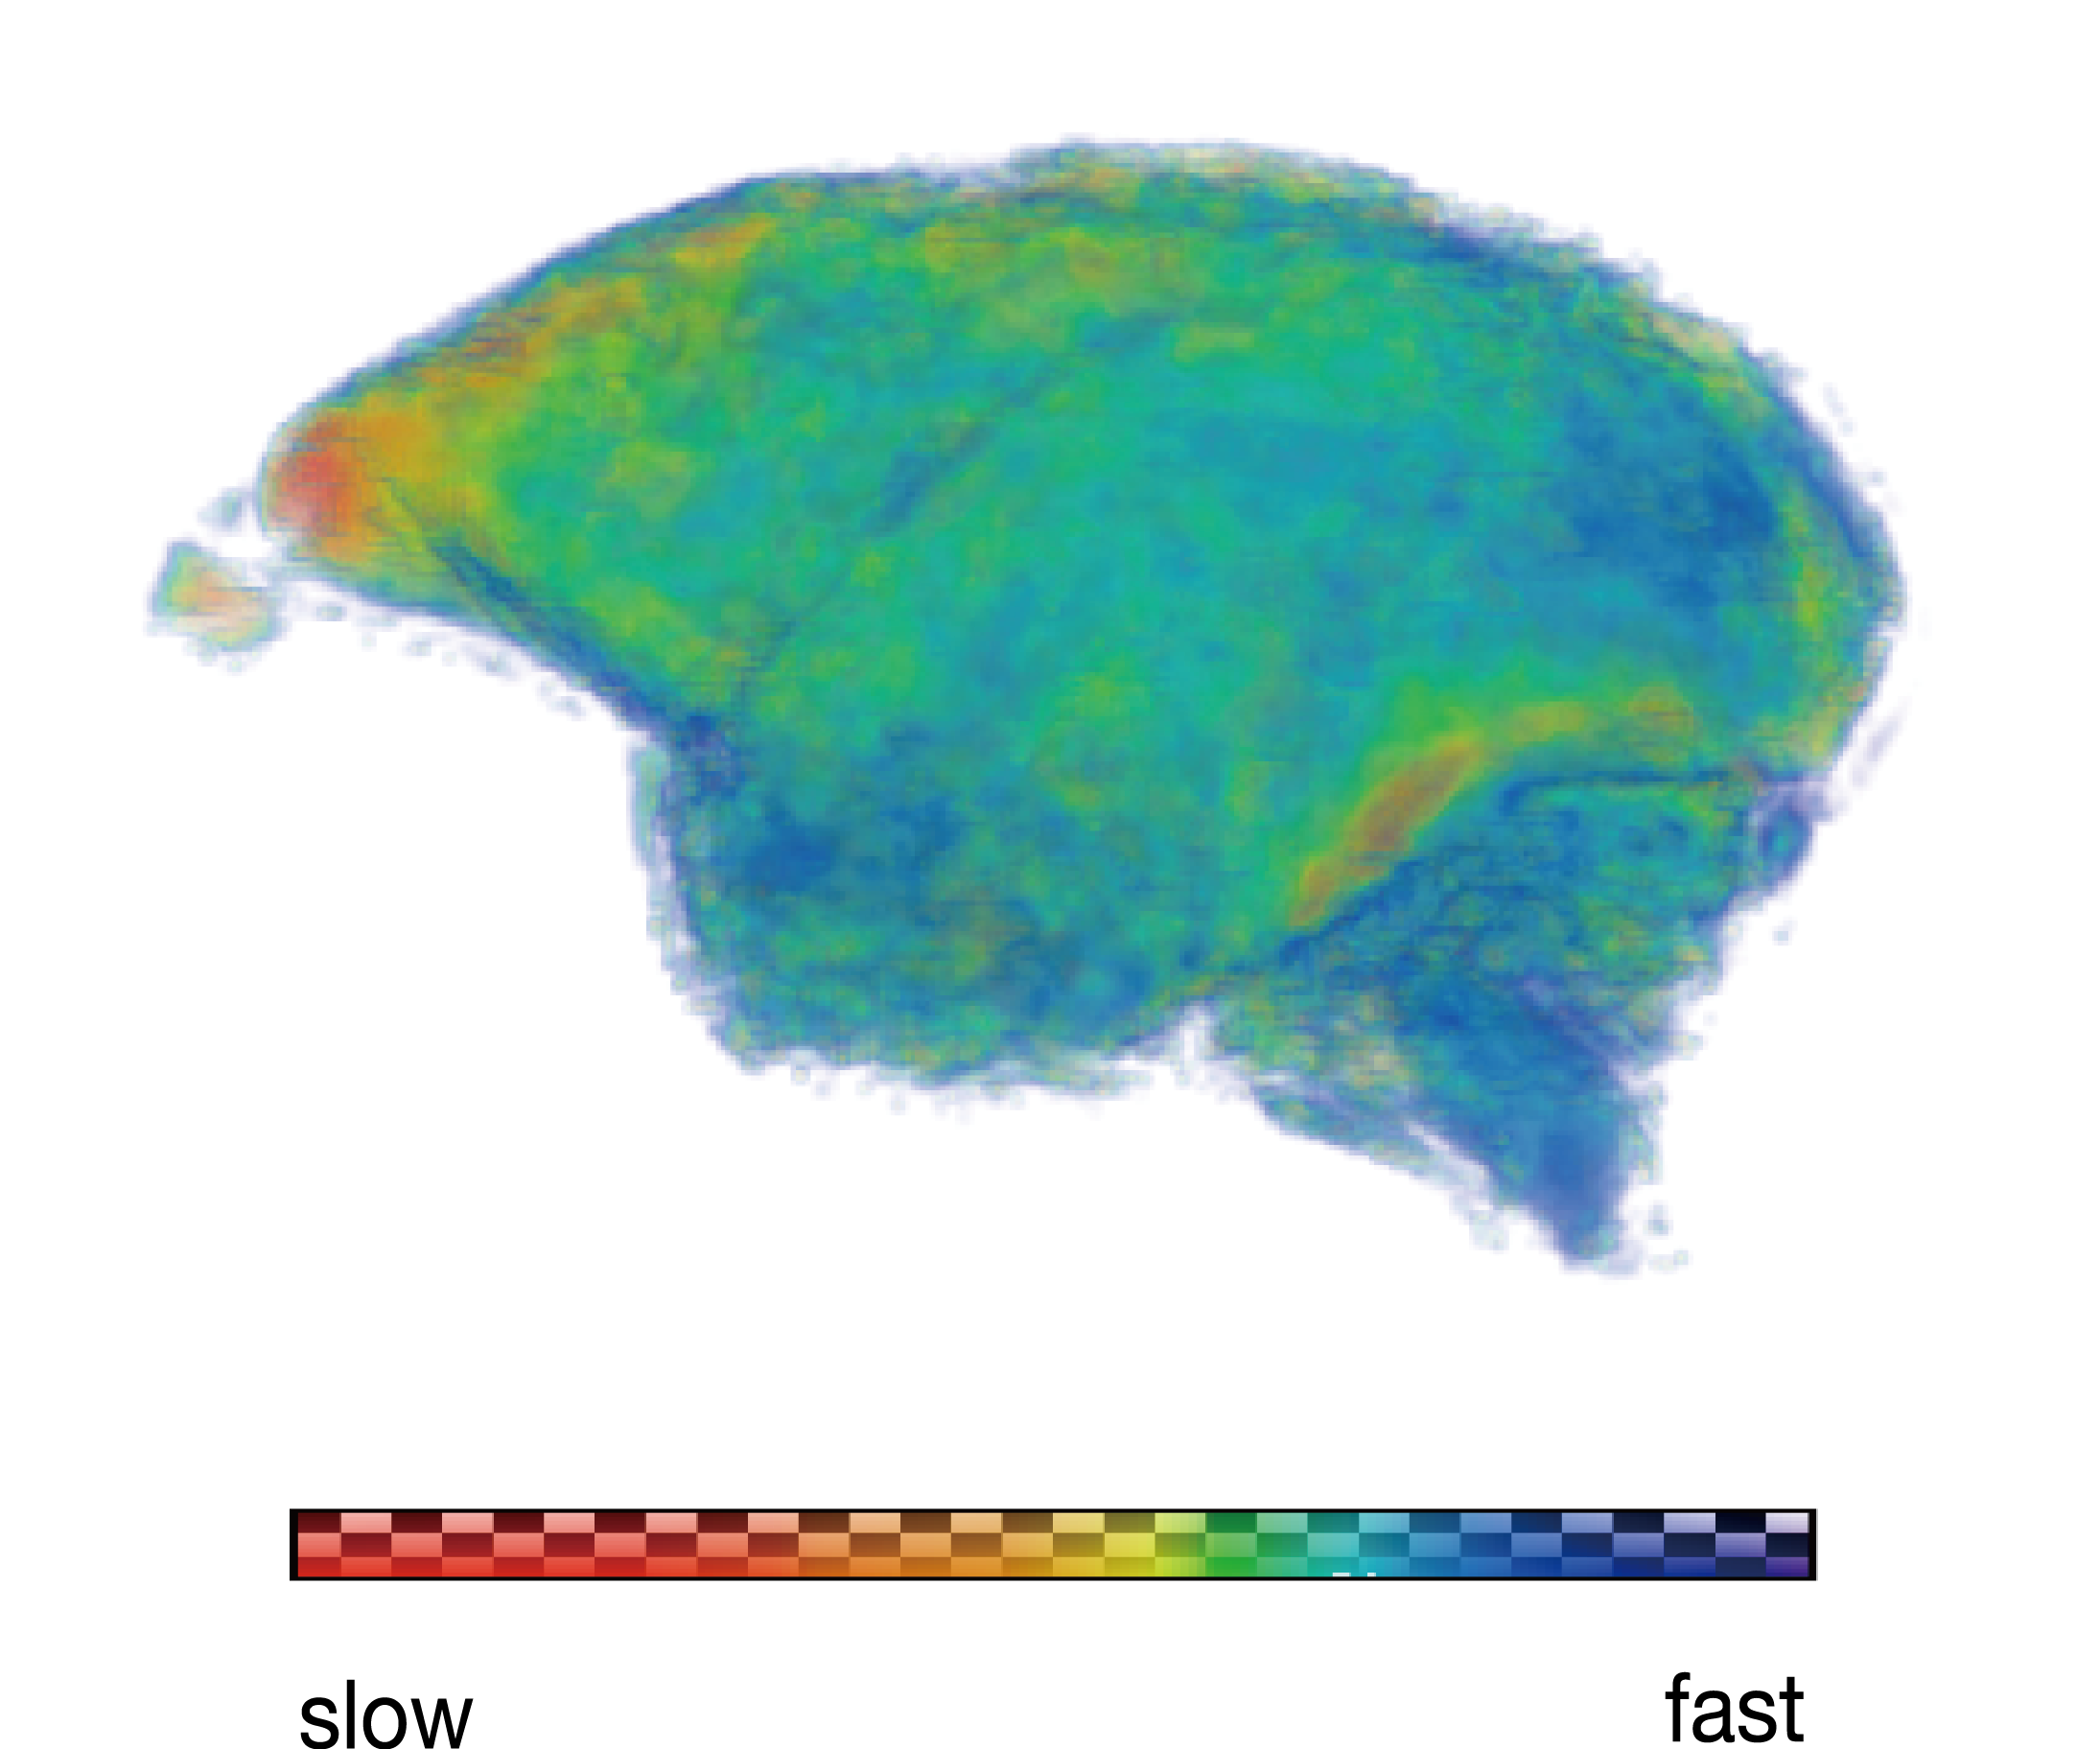
3D rendered image mapped the rate of MTR increase in development with voxel-wise analysis over the 1-18 month age range. We use the original approximation formula from that a negative exponential relationship similar to T1 relaxation curve to exists between MTR and age. In this color scale, cooler color like blue indicates fast and warmer color like red indicates slowly.