2158
k-space based Restoration of Hyperpolarized Xenon-129 MRI1Key Laboratory of Magnetic Resonance in Biological Systems, State Key Laboratory of Magnetic Resonance and Atomic and Molecular Physics, National Center for Magnetic Resonance in Wuhan, Wuhan Institute of Physics and Mathematics, Chinese Academy of Sciences, Wuhan, People's Republic of China
Synopsis
The magnetization of hyperpolarized media (such as Xenon-129, Helium-3 and Carbon-13) is nonrenewable, which makes it difficult to achieve both high signal-to-noise ratio and good spatial resolution in reconstructed MR images. Consequently, a k-space based restoration method is proposed to improve the quality of hyperpolarized MR images in this study, aiming to improve the visual quality of such images. Moreover, a new descriptor is proposed to measure the visual quality of hyperpolarized MR images. Experimental results demonstrated the proposed method is beneficial in visualizing detailed structures in pulmonary images, such as ventilation fine defects.
Introduction
The magnetization of hyperpolarized media (such as Xenon-129, Helium-3 and Carbon-13) is nonrenewable, which makes it difficult to achieve both high signal-to-noise ratio and good spatial resolution in reconstructed MR images. Moreover, due to limitations of MR hardware systems, hyperpolarized MR images are undoubtedly corrupted with different types of noise, or blurred by the physical properties of imaging devices. Consequently, a k-space based restoration method is proposed to improve the quality of hyperpolarized MR images. This is beneficial in visualizing detailed structures in pulmonary images, e.g. ventilation fine defects.Method
In the case of the gradient echo pulse sequence, the k-space signal after l excitations for proton MR at thermal equilibrium is s1(l)=∑x=0,...,N-1M0(x)exp(j2πlx/N), while that for hyperpolarized xenon-129 MRI [constant-flip-angle excitation, centric encoding] is s2(l)=∑x=0,...,N-1M0(x)exp(-(l-1)TR/T1)cosl-1αsinαexp(j2πlx/N), where M0 is the initial longitudinal magnetization, N is the total number of excitation pulses, x=-N/2, -N/2+1...N/2-1 is the spatial pixel index, α is the flip angles, and exp(j2πkx/N) is the phase-encoding term. The frequency encoding term is ignored for simplification. We know that the center of k-space has a low spatial frequency and represents contour features of the reconstructed image, while the edge of k-space has a high spatial frequency and characterizes fine details of the image. Owing to the rapid depletion of nonrenewable hyperpolarized magnetization, the centric phase-encoding strategy causes a loss of high frequency information. Compared the signals s1 with s2 [where T1 relaxation in s2 is ignored], it can be found that s1(l)=s2(l)(sinαcosl-1α)-1. Accordingly, if given k-space signal for hyperpolarized noble gas MRI, the k-space signal matrix will be modified by multiplying a weight coefficient matrix, aiming to ameliorate the high-frequency information of k-space. This may result in good spatial resolution in reconstructed image. Assume that the size of k-space matrix for hyperpolarized xenon-129 MRI is m×n [centric encoding], the weight coefficient matrix is C(p,:)=(sinθcos2(m/2-p)θ)-1, if p∈[1,m/2], or C(p,:)=(sinθcos2(p-m/2)-1θ)-1, if p∈[m/2+ 1,m], where θ is in an interval [2°,10°]. After that, an image is reconstructed by using Fourier transformation. Furthermore, we adopt the BM3D (block-matching and 3D filtering) method to filter the reconstructed image, for eliminating the potential effects of artifacts and noise. In order to better describe the visual quality of hyperpolarized noble gas MR image, we define a new descriptor, that is, SDs×t=-1/(s×t)∑x=1,...,s∑v=1,...,tβhβlnh, h=|Imax-2Imed+Imin|/|Imax+2Imed+Imin|, where an image is divided into s×t blocks, Imax, Imed and Imin are the maximum, medium and minimum of pixels in each block separately, and β is a positive constant. Then the average of the measure results of all blocks in the entire image is calculated as a quality measure.Results and Discussion
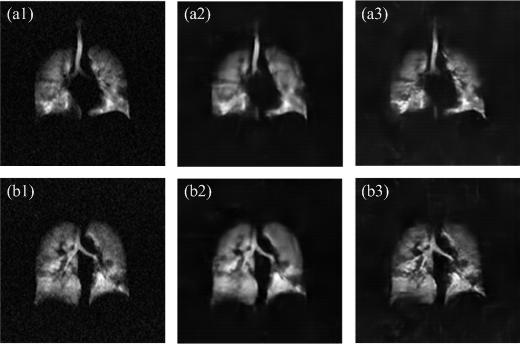
Fig. 1 shows hyperpolarized xenon-129 MR images of a asthma patient (female, age 34). These experiments were performed on 1.5 T Siemens. The MRI parameters were: TE=2.7 ms, TR=6.8 ms, matrix size=128×128, FOV=400×400 mm2, slice thickness=20 mm, bandwidth=25.6 kHz, number of slices=1, total scan time=6.97s, FLASH, constant flip angle [the angle is 9°], centric encoding. Figs. 1(a1) and (b1) are the fifth and sixth layers of lung, where exists ventilation defect regions. Through the proposed method, the reconstructed images are displayed in Figs. 1(a3) and (b3). The detailed structure information is much distinct in Figs. 1(a3) and (b3). This is useful to localize ventilation defect regions.
Since BM3D achieves state of the art denoising performance, the noise existed in original images is removed to some extent, but the detailed structures are blurred, as shown in Figs. 1(a2) and (b2). Via the proposed scheme, the noise is eliminated while enhancing the detailed structures, as shown in Figs. 1(a3) and (b3).
Conclusion
In this paper, a k-space-based restoration method is presented to improve detailed structures of hyperpolarized Xenon- 129 MR images. The presented method can not only remove noise, but also enhance the detailed structures. This is benefit to explore detailed information of the reconstructed hyperpolarized MR image.Acknowledgements
We acknowledge the support by the National Natural Science Foundation of China (81227902, 81625011, 61471355) and National Program for Support of Eminent Professionals (National Program for Support of Top-notch Young Professionals).References
1. H. Deng, J. Zhong, W. Ruan, X. Chen, X. Sun, C. Ye, M. Liu, X. Zhou, Constant-variable flip angles for hyperpolarized media MRI, J. Magn. Reson., vol. 263, pp. 92-100 (2016).Figures