2157
Fast Dynamic Lung Ventilation MRI of Hyperpolarized 129-Xenon using Spiral k-space Sampling1Department of Oncology, University Of Oxford, OXFORD, United Kingdom, 2Department of Radiology, The Churchill Hospital, OXFORD, United Kingdom, 3General Electric Global Research, Munich, Germany
Synopsis
We implemented a spiral k-space sampling approach for Dynamic hyperpolarized 129Xe Ventilation Imaging (DXeVI) of human lungs. The gas-inflow effect, susceptibility artifacts, spatial and temporal resolutions for capturing Gas Flow Patterns (GFPs) were quantified in the gas-flow phantom and compared to corresponding simulated GFPs. DXeVI of GFPs are shown to be sensitive to small gas flow changes between the anterior and posterior lung regions in healthy three subject. This technique can potentially be used to detect and quantify ventilation defects associated with early stage COPD or asthma to assess disease severity, response to treatments and to identify disease progression.
Introduction:
The purpose of this study was to develop and optimize a rapid Dynamic hyperpolarized 129Xe Ventilation Imaging (DXeVI) technique using an interleaved-spiral k-space sampling strategy. We aimed to investigate the feasibility of capturing pulmonary Gas-Flow Patterns (GFPs) using DXeVIs during a ~3s Inhalation Period (IP), ~5s Breath-Hold (BH), and ~3s Exhalation Period (EP). Static ventilation imaging acquired during a BH interval with Hyperpolarized (HP) 129Xe-MRI typically demonstrates homogeneous signal intensity throughout healthy lungs. Regions of absent or relatively low signal are known as “ventilation defects” and correspond to obstructed airflow1, 2. Previously, Dynamic Ventilation Imaging (DVI) with HP 3He-MRI was reported to be sensitive to regional GFPs in patients with lung disease including severe asthma, emphysema and cystic fibrosis3. In this work, DVI with HP 129Xe-MRI is presented using a rapid k-space sampling strategy to capture GFPs during a complete breath cycle.Theory:
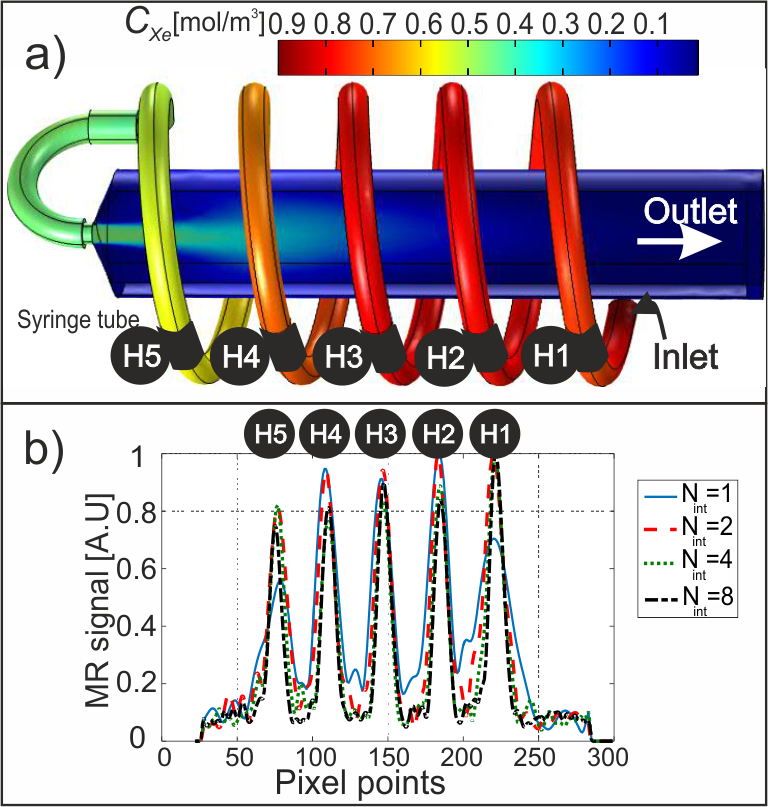
Quantitative analysis of DVI GFPs was carried out by modelling the loss of HP 129Xe magnetization as a function of RF pulses4 and finite element method modelling of 129Xe gas concentration cXe(r,t), solving the Navier Stokes, diffusion and convection equations5. A simulation geometry was built using similar dimensions to the gas-flow phantom geometry shown in Fig. 1(a). Simulated GFPs were then calculated from H1 to H5.Methods:
The gas-inflow effect, susceptibility artifacts, spatial, and temporal resolutions for capturing GFPs were quantified in the gas-flow phantom (Fig. 1(a)) and compared to corresponding simulated GFPs. MRI was acquired using a GE 1.5T system, a flexible vest-shaped transmit-receive RF coil, and nuclear enriched 129Xe gas polarized to ~10%. DXeVI using the gas-flow phantom was acquired for a varying number of interleaves (Nint=1, 2, 4, 8) on three healthy volunteers using: (i) Nint=2 with the following parameters: FOV: 30×30 cm, matrix size: 28×28, flip angle: 10o, slices: 13, slice thickness: 15 mm, temporal resolution: 0.6 s/volume image; (ii) Nint=8 with the following parameters: FOV: 30×30 cm, matrix size: 52×52, flip angle: 10o, slices: 13, slice thickness: 15 mm, temporal resolution: 2.4 s/volume image.Results:
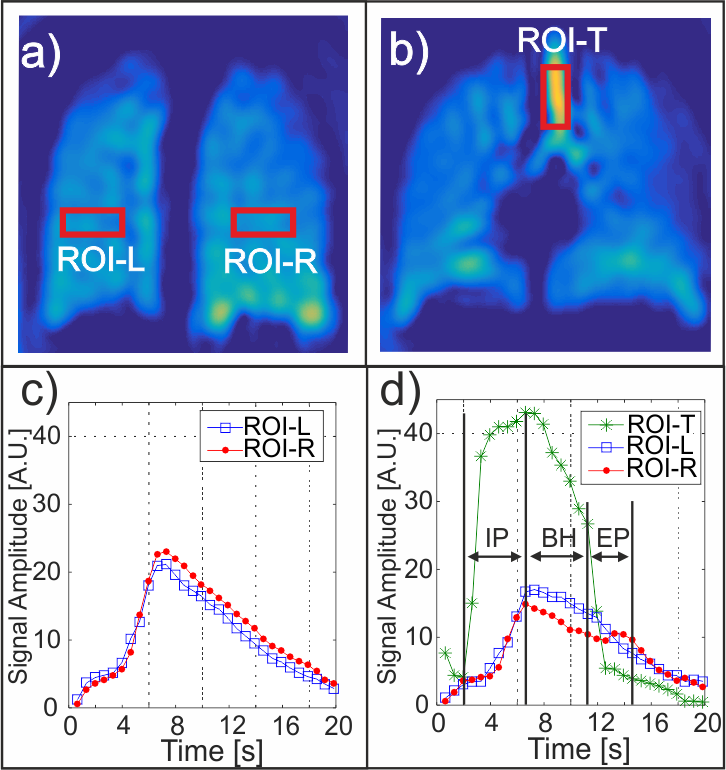
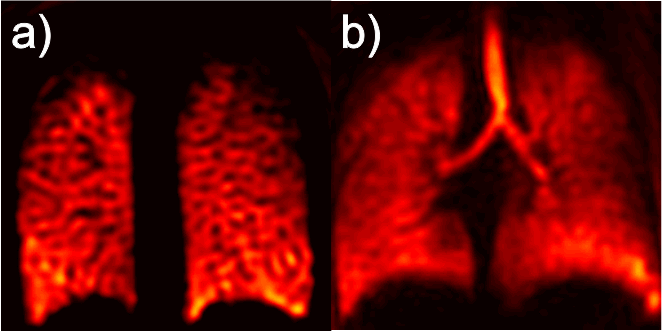
The change in simulated cXe(r,t) through the gas-flow phantom is shown in Fig. 1(a) 2s after the gas entered the inlet. As expected, the simulated and MR signal depends on the gas arrival time to each ROI, H1 to H5. This is confirmed by comparing simulated GFPs to the experimental GFPs in Fig 1(b). The Full Width at Half Maximum (FWHM) of the line profiles in Fig. 1(b) corresponds to the spatial resolution and the average FWHM of all peaks from H1 to H5 are measured to be 10.0±2.5 mm, 6.8±0.6 mm, 6.1±0.6 mm, and 5.5±0.5 mm for Nint=1, 2, 4, 8, respectively. Representative coronal DXeVI for Nint=2 and slices 2 (anterior) and 6 (center) during the BH are averaged and shown in Fig. 2(a) and (b). The corresponding GFPs from ROI-L and ROI-R (Fig. 2(a)) are shown in (c) and (d). Spearman's correlations between two closely spaced ROIs, ROI-L in slices 2 and 3, were 0.99, 0.99, and 0.98; two distant ROIs, ROI-R in slice 2 and 6, were 0.90, 0.95, and 0.94 in three healthy subjects. Fig. 3(a) and (b) show Nint=8 images from the same subject with higher spatial resolution than in Fig. 2(a) and (b) for Nint=2.Discussion:
The tradeoff between spatial and temporal resolution, including the dependency on the number of interleaves was analyzed using a flow-phantom. Although the highest temporal resolution per volume image (0.3s) was achieved with Nint=1, the FWHM was larger by a factor of two compared to Nint=8 due to susceptibility and T2* blurring artifacts. The temporal resolution of Nint=2 (0.6s) was four times better than Nint=8, allowing for detection of GFPs during relatively short IP and EP intervals although images are of lower spatial resolution. This study has shown that regional GFPs are successfully detected using DXeVI in healthy volunteers. GFPs correlate well when closely spaced ROIs were selected, e.g. Slices 2 and 3. GFPs from distant ROIs, e.g. ROI-L in slice 2 and ROI-R in slice 6, correlate less well, confirming sensitivity of the technique to small changes in ventilation from anterior to central region of healthy lungs.Conclusions:
DXeVI has potential clinical application in obstructive lung disease where GFPs may be used to detect early stage disease with higher sensitivity than static imaging3. Furthermore in patients with COPD or asthma, GFPs may indicate collateral ventilation associated with ventilation defects. DXeVI may therefore present a unique non-invasive method to help determine patient suitability and monitor efficacy of regional treatments, for example lung volume reduction and airway bypass treatments.Acknowledgements
The authors thank Anthony McIntyre, Jennifer Lee, and Kenneth Jacop for practical assistance with HP 129Xe gas production and MR scans.References
1. G. Parraga, et al. Hyperpolarized He-3 ventilation defects and apparent diffusion coefficients in chronic obstructive pulmonary disease - Preliminary results at 3.0 Tesla. Investigative Radiology 2007;42:384-391.
2. N.J. Stewart, et al. Feasibility of human lung ventilation imaging using highly polarized naturally abundant xenon and optimized three-dimensional steady-state free precession. Magnet Reson Med. 2015;74:346-352.
3. M. Salerno, et al. Dynamic spiral MRI of pulmonary gas flow using hyperpolarized He-3: Preliminary studies in healthy and diseased lungs. Magnet Reson Med. 2001;46:667-677.
4. H.E. Moller, et al. Signal dynamics in magnetic resonance imaging of the lung with hyperpolarized noble gases. Journal of Magnetic Resonance. 1998;135:133-143.
5. L. de Rochefort, et al. In vitro validation of computational fluid dynamic simulation in human proximal airways with hyperpolarized 3He magnetic resonance phase-contrast velocimetry. J Appl Physiol. 2007;102:2012-2023.
Figures