2156
Point-resolved spectroscopy with self-navigation for precise reversible transverse relaxation quantification in pulmonary tissue robust to breathing state variation at 1.5 and 3 Tesla1Computer Assisted Clinical Medicine, Heidelberg University, Mannheim, Germany, 2Electrical and Computer Engineering, University of Minnesota, Minneapolis, MN, United States, 3Center for Magnetic Resonance Research, University of Minnesota, Minneapolis, MN, United States
Synopsis
The reversible transverse relaxation time is currently under investigation as a promising biomarker for diagnosis of lung diseases. We propose an enhanced point-resolved spectroscopy sequence for precise relaxation quantification with self-navigation robust to breathing state variation. The obtained relaxation times show evidence for sensitivity to tissue structure alteration during normal breathing. This approach potentially enables a precise assessment of tissue structure in pulmonary diseases such as fibrosis and COPD.
Purpose
The reversible transverse relaxation time has potential as a clinical biomarker for the assessment of tissue structure in diseased lungs, which has been demonstrated in COPD patients1. Recently, a point-resolved spectroscopy (PRESS) sequence combined with Gaussian relaxation model was presented for relaxation time measurements with increased precision2. However, to obtain sufficient signal-to-noise ratio long acquisition times and multiple averages are required. This renders the method sensitive towards the level of lung inflation, which is subject to breathing motion, and is known to induce changes in the relaxation time. These breathing artifacts are a common source of misdiagnosis. Therefore, the aim of this work was to integrate a self-navigation technique into a PRESS sequence for precise relaxation quantification in human lungs robust to variation in the breathing states.Methods
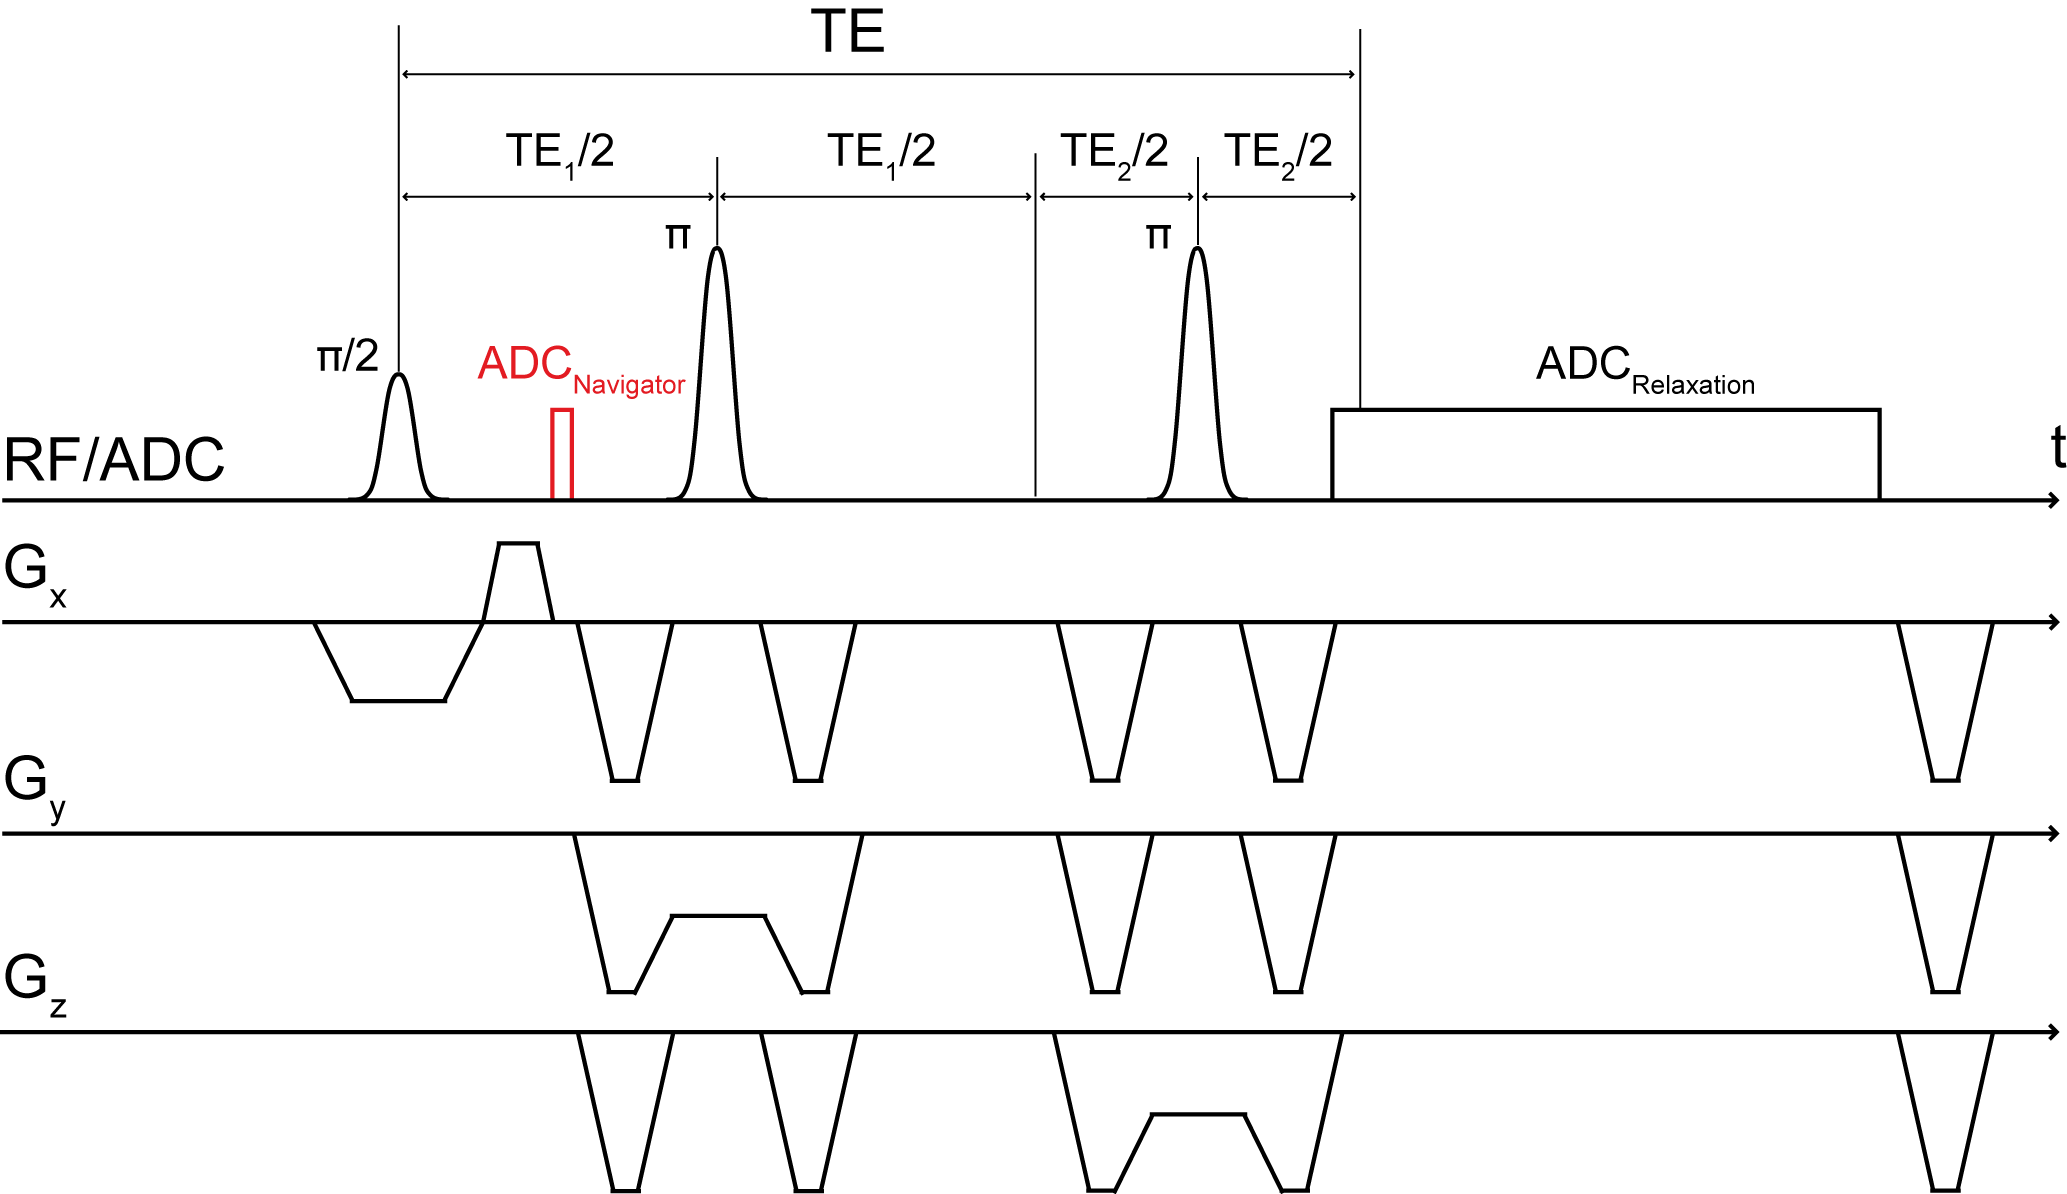
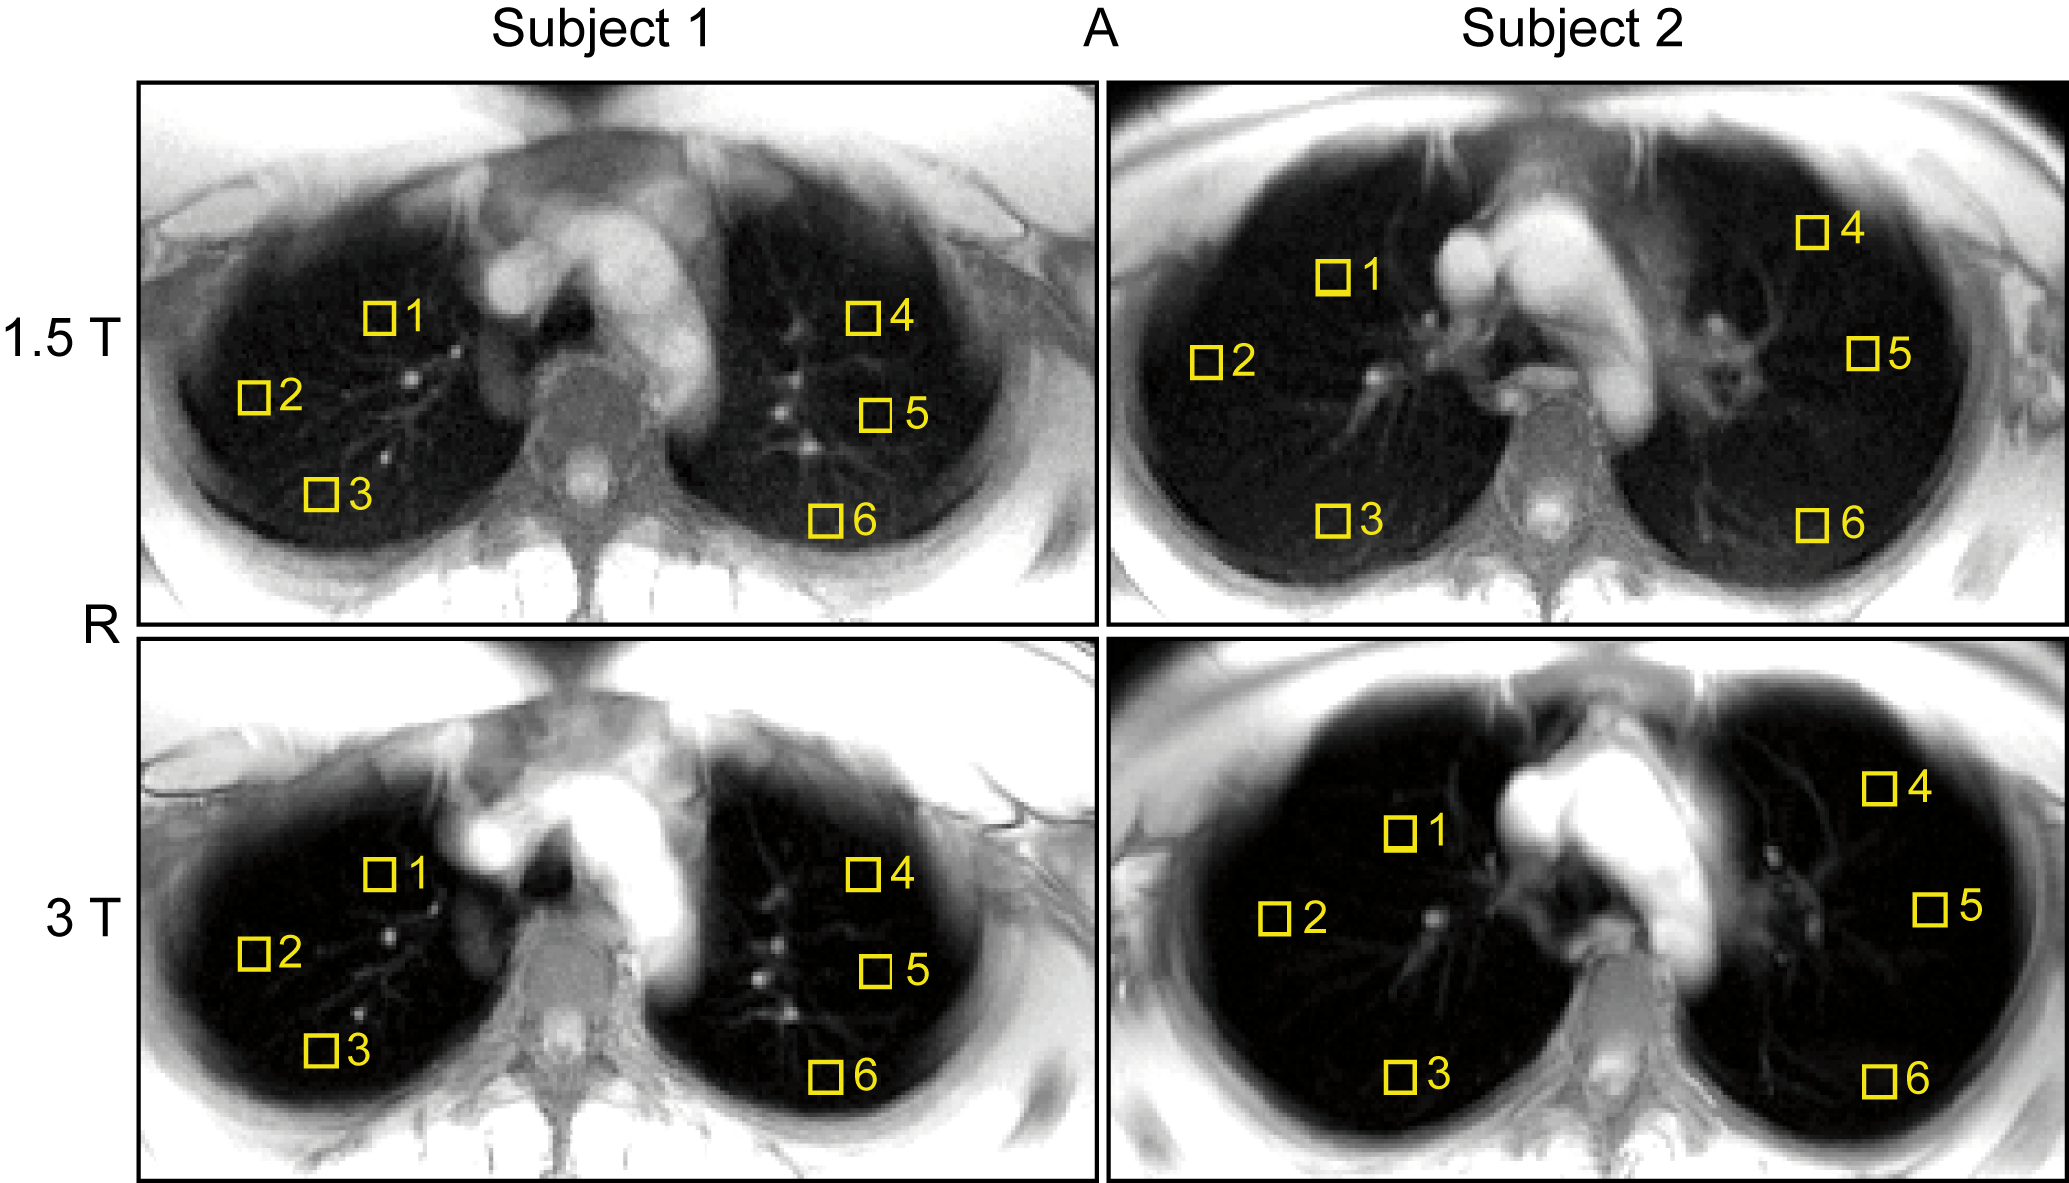
Self-navigation3 was integrated into a PRESS sequence4 with Mao-optimized refocusing pulses5 and crusher gradients6 as schematically visualized in Fig.1. In total, 24 measurements were performed, 12 with two (2 males: 26 and 29 years old) healthy volunteers (6 ROIs for each subject, normal breathing only) at each field strength. ROIs were positioned in the upper lungs at height of the aortic arch, where little breathing motion was expected, as shown in Fig.2. Data were acquired using a 1.5T and 3T MR system (Magnetom Avanto and Trio, Siemens Healthcare, Erlangen, Germany) with manufacturer provided thorax/spine coils as receiver. The following sequence parameters were used for all measurements: voxel volume 10x10x20mm3; TE/TR=27/300msec; 500 repetitions; acquisition time=150sec; ADC for navigation: 32 data points sampled with BW=28-120kHz; ADC for pulmonary relaxation: between 2,080 and 2,112 data points sampled with BW=10kHz and nominal spectral resolution of 0.005kHz, that is ADC duration of 0.2sec, which enabled the extraction of a sufficient number of noise samples at the end of the ADC sampling interval for error estimation of the signal magnitude. Respiratory gating was performed retrospectively. The repetitions of each measurement were classified into two breathing states, expiration and inspiration, depending on their low pass filtered (pass band < 0.6Hz, stop band > 0.7Hz) navigator signal phase or magnitude, as described below. Since the phase and magnitude are not necessarily well correlated and their polarity can vary with ROI position, a smoothed (span=5) histogram of the navigator signal time response with 30 bins was used for automated breathing state classification including selection of phase or magnitude for gating. For all measurements, the histogram’s peak with the smallest width at 80% of the maximum height was classified as expiration and the associated signal component (phase or magnitude) was chosen for gating. Pulmonary signal relaxations were obtained by coherently averaging the signals of the repetition of the respective breathing state class. The Gaussian relaxation model, used for the determination of the Gaussian relaxation time T2’,G, and the fitting procedure were as previously reported2.Results and Discussion
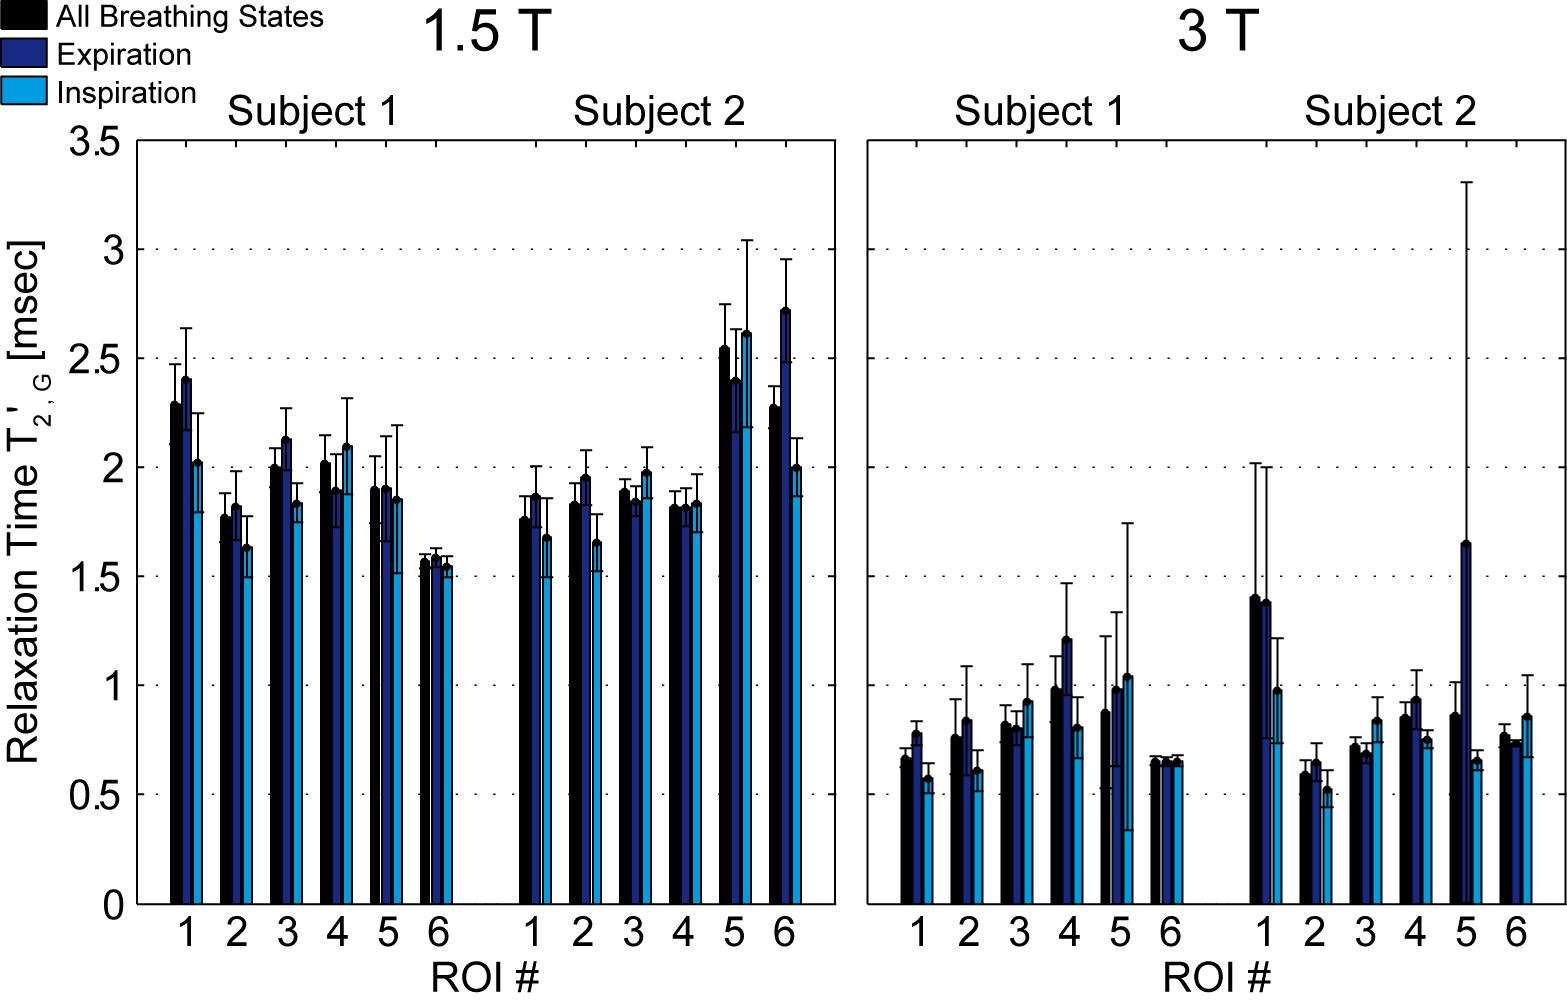
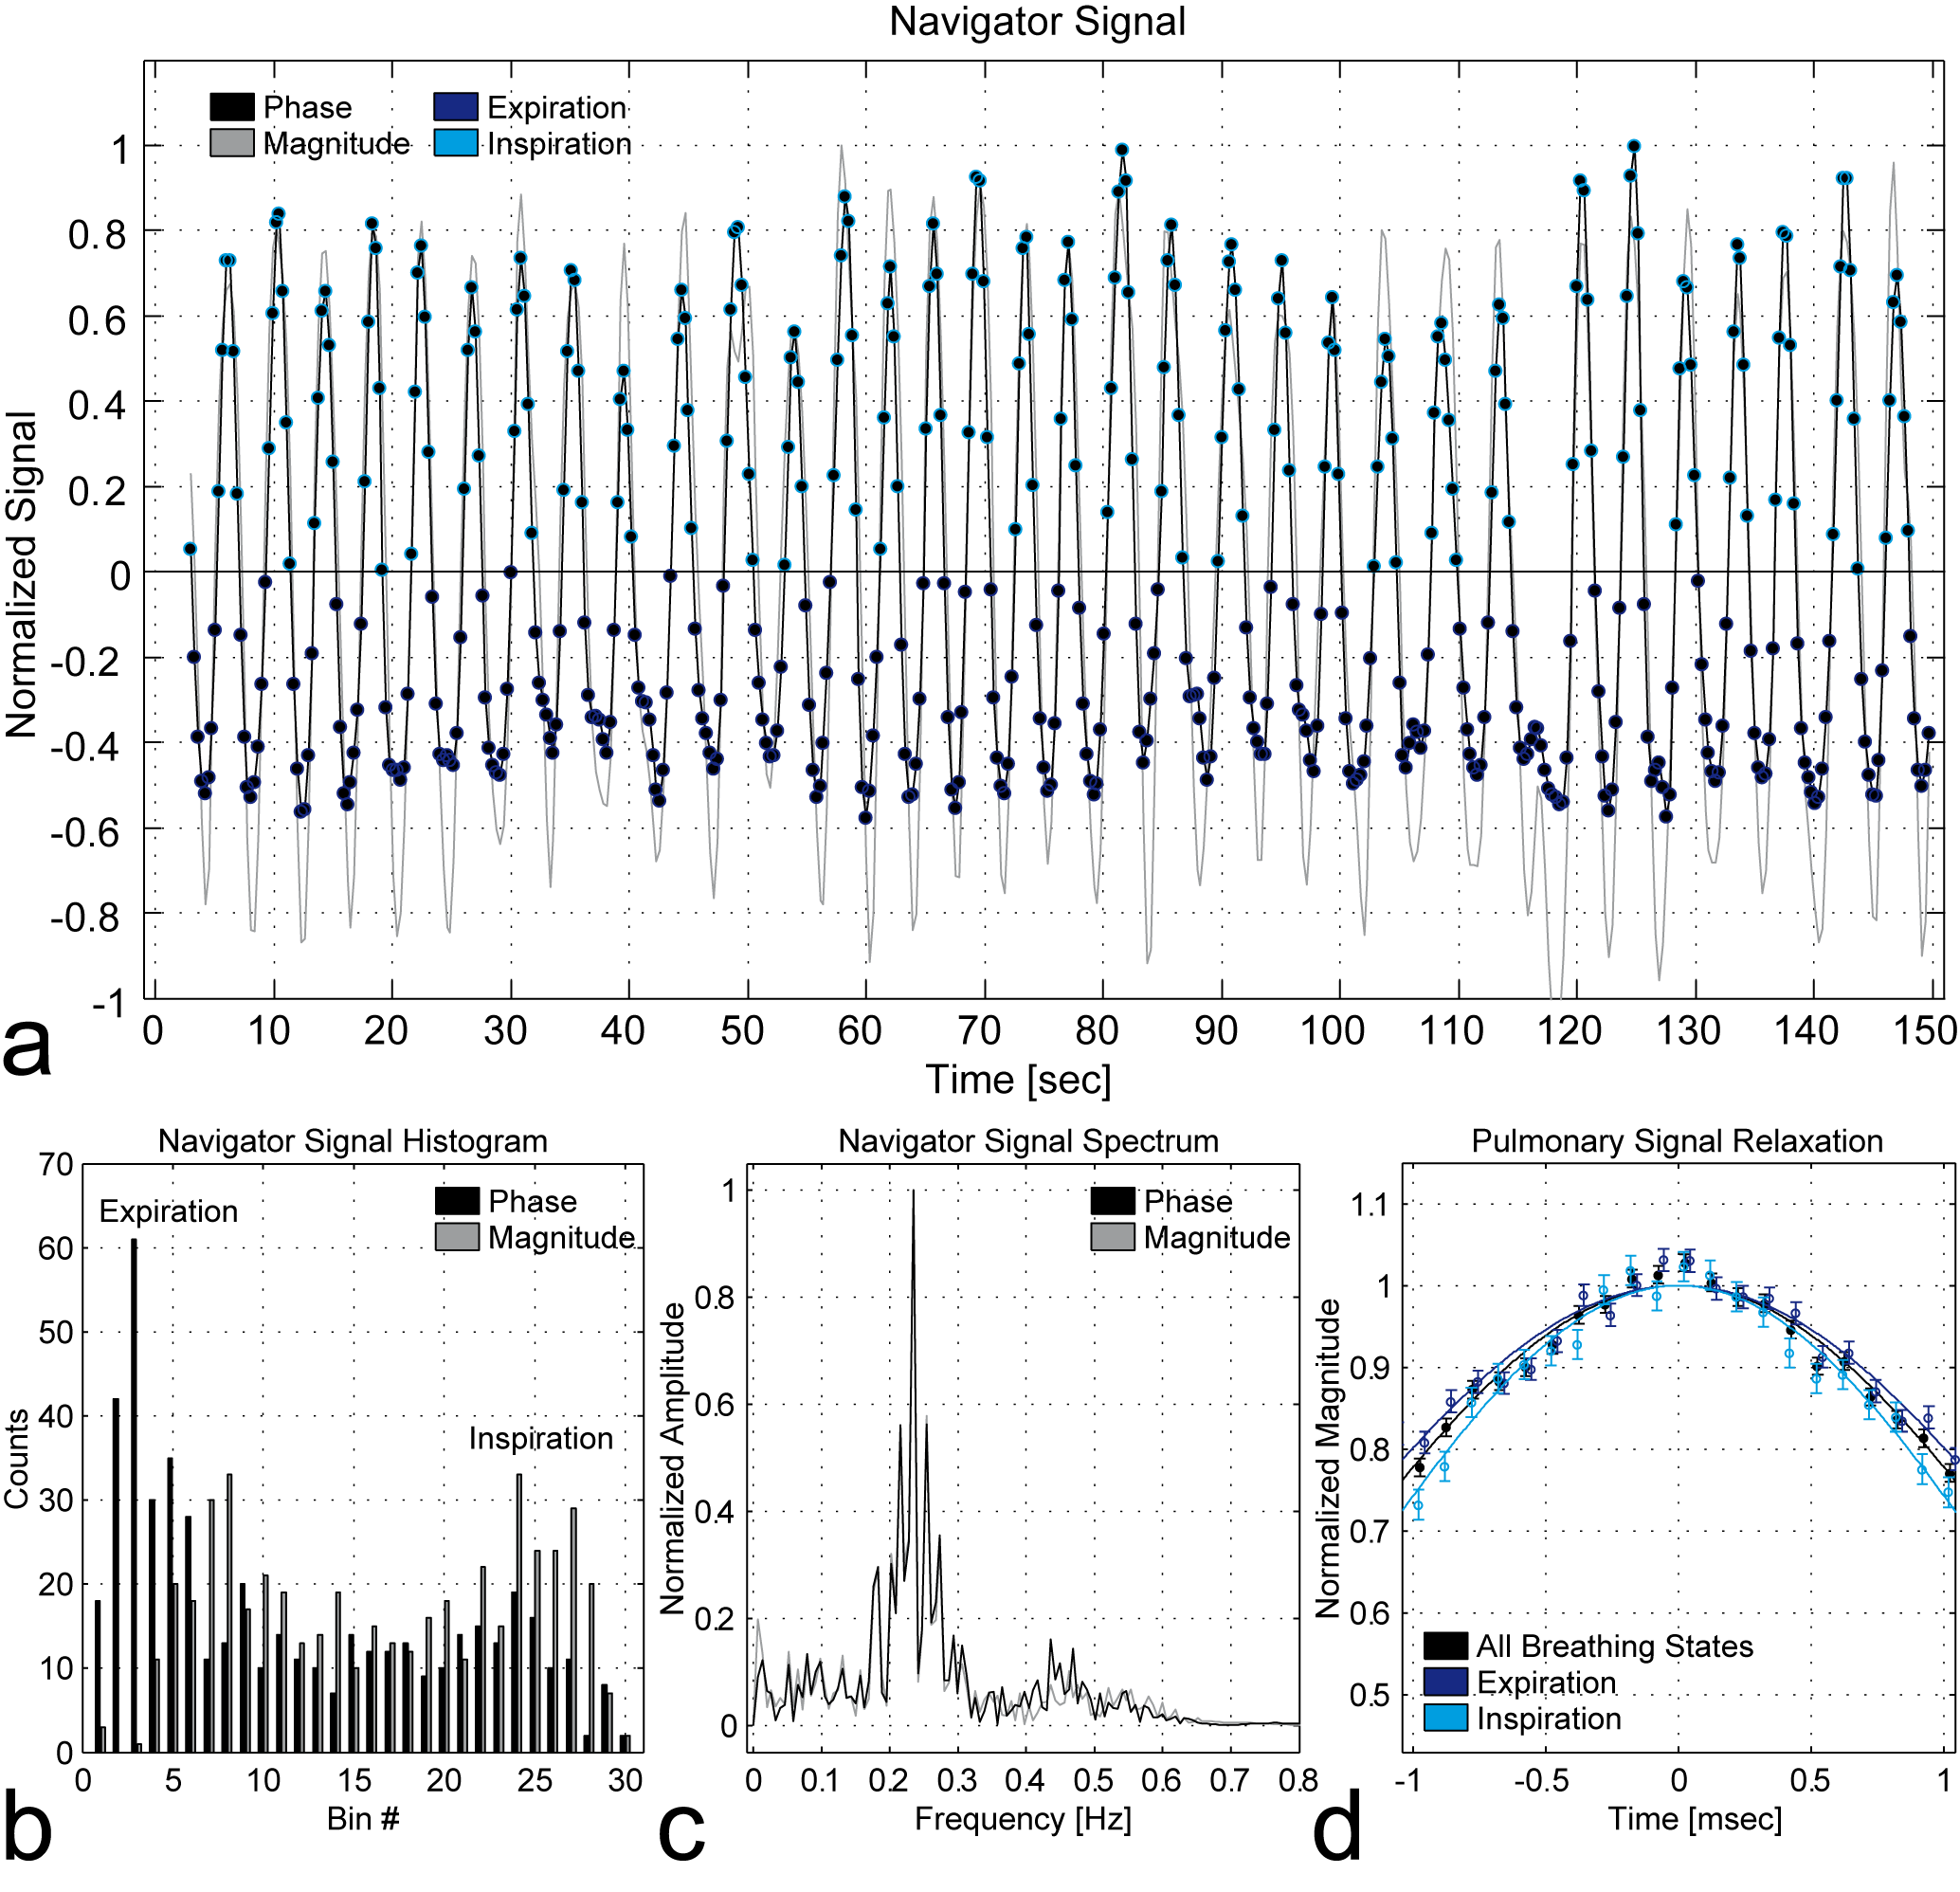
Fig.3 presents the relaxation times of the Gaussian model T2’,G for all measurements. Expiration and inspiration can be significantly discriminated in 7 out of 24 cases (1.5T: Subj.1/ROI3, Subj.2/ROI2+6; 3T: Subj.1/ROI1+4, Subj.2/ROI3+4). Hence, different breathing states during acquisition can influence relaxation times even in upper lung regions, where little breathing motion was expected. Except for one of these 7 cases (3T: Subj.2/ROI3), the relaxation times for inspiration are lower than that for expiration as expected. Fig.4 illustrates the navigator signal characteristics together with the differently gated pulmonary signal relaxations of one exemplary measurement (1.5T: Subj.1/ROI3). Both phase and magnitude of the navigator signal oscillate around their respective mean value at the characteristic breathing frequency of about 0.2-0.3Hz. Depending on the ROI position, the navigator signal phase or magnitude can exhibit typically high counts around end-expiratory values and therefore both components are valuable for automated breathing state classification.Conclusion
In this study we have proven the feasibility of a self-navigated PRESS sequence for precise reversible transverse relaxation quantification in human lungs robust to breathing state variation. The resulting relaxation times T2’,G show evidence for sensitivity to tissue structure alteration caused by normal breathing and hence represent a promising biomarker for tissue structure assessment in pulmonary diseases such as fibrosis and COPD.Acknowledgements
We thank Deutsche Forschungsgemeinschaft for financial support (grant number: DFG SCHA546/14-2).References
1. Ohno Y, Koyama H, Yoshikawa T, Matsumoto K, Takahashi M, Van Cauteren M, Sugimura K. T2* measurements of 3-T MRI with ultrashort TEs: capabilities of pulmonary function assessment and clinical stage classification in smokers. AJR Am J Roentgenol 2011;197:W279–W285.
2. Zapp J, Domsch S, Weingärtner S, Schad LR. Gaussian signal relaxation around spin echoes: Implications for precise reversible transverse relaxation quantification of pulmonary tissue at 1.5 and 3 Tesla. Magn Reson Med 2016;doi:10.1002/mrm.26280.
3. Brau AC, Brittain JH. Generalized self-navigated motion detection technique: preliminary investigation in abdominal imaging. Magn Reson Med 2006;55:263–270.
4. Bottomley PA. Selective volume method for performing localized NMR spectroscopy. US patent 4,480,228. 1984.
5. Mao J, Mareci TH, Andrew ER. Experimental study of optimal selective 180° radiofrequency pulses. J Magn Reson 1988;79:1–10.
6. Bottomley PA, Edelstein WA. Method of eliminating effects of spurious free induction decay NMR signal caused by imperfect 180 degrees RF pulses. US patent 4,484,138. 1984.
Figures